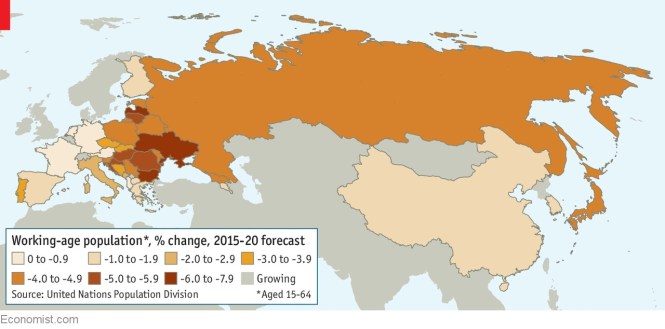
Gone in their prime Many countries suffer from shrinking working-age populations
There are things they can do to mitigate the dangers
May 5th 2018| VILNIUS
MANY developed countries have anti-immigration political parties, which terrify the incumbents and sometimes break into government. Lithuania is unusual in having an anti-emigration party. The small Baltic country, with a population of 2.8m (and falling), voted heavily in 2016 for the Lithuanian Farmer and Greens’ Union, which pledged to do something to stem the outward tide. As with some promises made elsewhere to cut immigration, not much has happened as a result.
“Lithuanians are gypsies, like the Dutch,” says Andrius Francas of the Alliance for Recruitment, a jobs agency in Vilnius, the capital. Workers began to drift away almost as soon as Lithuania declared independence from the Soviet Union in 1990. The exodus picked up in the new century, when Lithuanians became eligible to work normally in the EU. For many, Britain is the promised land. In the Pegasas bookshop just north of the Neris river in Vilnius, four shelves are devoted to English-language tuition. No other language—not even German or Russian—gets more than one.
Mostly because of emigration, the number of Lithuanians aged between 15 and 64 fell from 2.5m in 1990 to 2m in 2015. The country is now being pinched in another way. Because its birth rate crashed in the early 1990s, few are entering the workforce. The number of 18-year-olds has dropped by 33% since 2011. In 2030, if United Nations projections are correct, Lithuania will have just 1.6m people of working age—back to where it was in 1950.
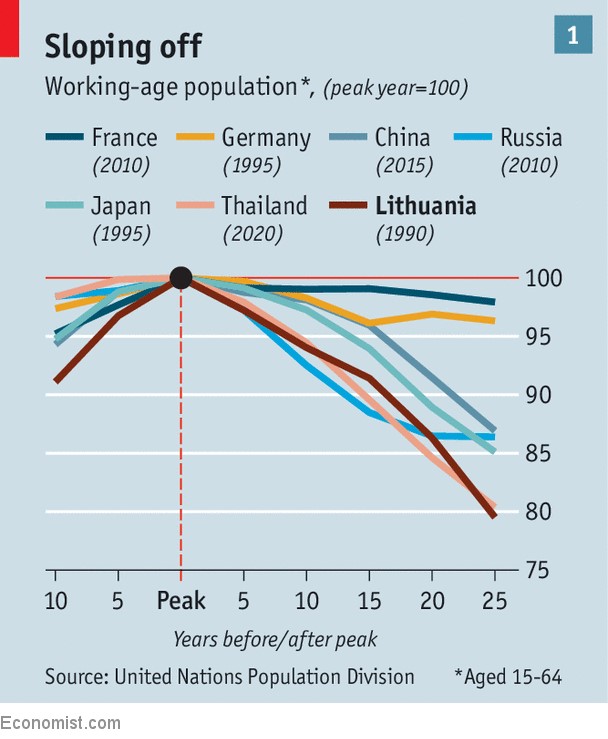
Lithuania was an early member of a growing club. Forty countries now have shrinking working-age populations, defined as 15- to 64-year-olds, up from nine in the late 1980s. China, Russia and Spain joined recently; Thailand and Sri Lanka soon will. You can now drive from Vilnius to Lisbon (or eastward to Beijing, border guards permitting) across only countries with falling working-age populations.
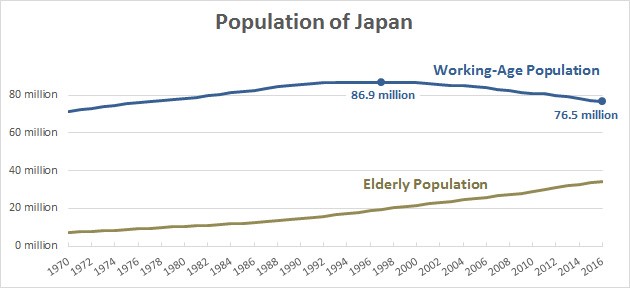
It need not always be disastrous for a country to lose people in their most productive years. But it is a problem. A place with fewer workers must raise productivity even more to keep growing economically. It will struggle to sustain spending on public goods such as defence. The national debt will be borne on fewer shoulders. Fewer people will be around to come up with the sort of brilliant ideas that can enrich a nation. Businesses might be loth to invest. In fast-shrinking Japan, even domestic firms focus on foreign markets.
The old will weigh more heavily on society, too. The balance between people over 65 and those of working age, known as the old-age dependency ratio, can tip even in countries where the working-age population is growing: just look at Australia or Britain. But it is likely to deteriorate faster if the ranks of the employable are thinning. In Japan, where young people are few and lives are long, demographers expect there to be 48 people over the age of 65 for every 100 people of working age in 2020. In 1990 there were just 17.
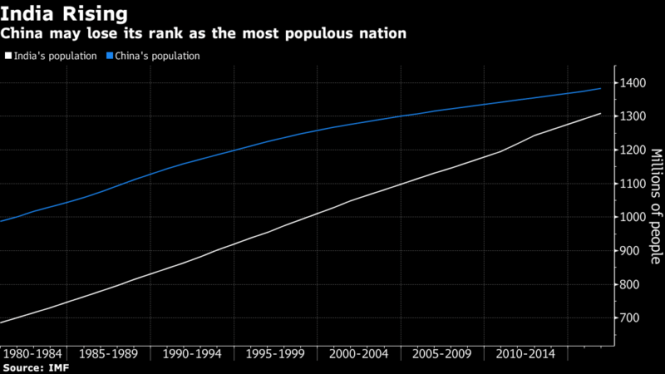
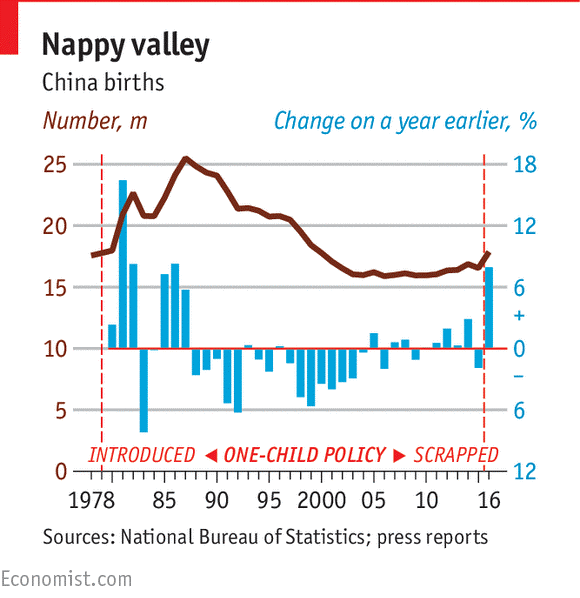
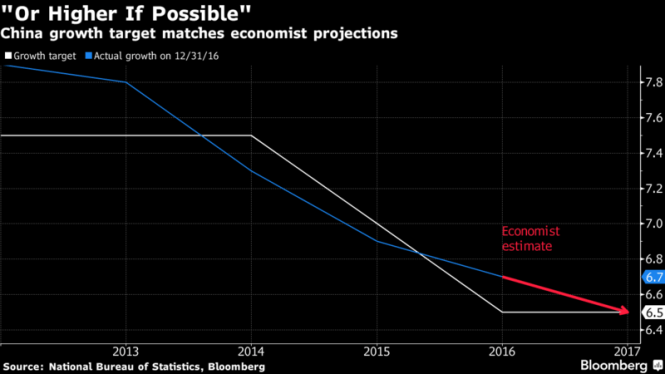
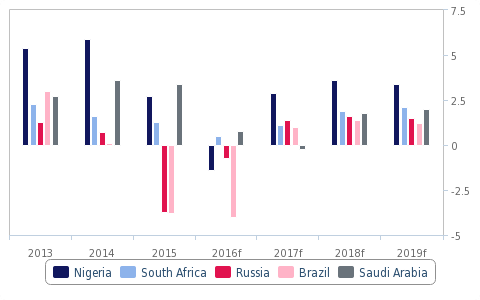
Some countries face gentle downward slopes; others are on cliff-edges. Both China and France are gradually losing working-age people. But, whereas numbers in France are expected to fall slowly over the next few decades, China’s will soon plunge—a consequence, in part, of its one-child policy. The number of Chinese 15- to 64-year-olds, which peaked at just over 1bn in 2014, is expected to fall by 19m between 2015 and 2025, by another 68m in the following decade, and by 76m in the one after that (see chart 1).
Jörg Peschner, an economist at the European Commission, says that many countries face demographic constraints that they either cannot or will not see. He hears much debate about how to divide the economic cake—should pensions be made more or less generous?—and little about how to prevent the cake from shrinking. Yet countries are hardly powerless. Even ignoring the mysterious business of raising existing workers’ productivity, three policies can greatly alleviate the effects of a shrinking working-age population.
Never done
The first is to encourage more women to do paid work. University-educated women of working age outnumber men in all but three EU countries, as well as America and (among the young) South Korea. Yet female participation in the labour market lags behind men’s in all but three countries worldwide. Among rich countries, the gap is especially wide in Greece, Italy, Japan—and South Korea, where 59% of working-age women work compared with 79% of men.
Governments can help by mandating generous parental leave—with a portion fenced off for fathers—to ensure that women do not drop out after the birth of a child. And state elderly care helps keep women working in their 50s, when parents often become needier. But a recent IMF report argues the greatest boost to recruiting and keeping women in paid jobs comes from public spending on early-years education and child care.
Employers can do more too, most obviously by providing flexible working conditions, such as the ability to work remotely or at unconventional hours, and to take career breaks. Fathers need to be able to enjoy the same flexible working options as mothers. Some women are kept out of the workforce by discrimination. This can be overt. According to the World Bank, 104 countries still ban women from some professions. Russian women, for example, cannot be ship’s helmsmen (in order, apparently, to protect their reproductive health). More often discrimination is covert or the unintended consequence of unconscious biases.
Countries can also tap older workers. Ben Franklin, of ILC UK, a think-tank, argues that 65, a common retirement age, is an arbitrary point at which to cut off a working life. And in many countries even getting workers to stick around until then is proving difficult. Today Chinese workers typically retire between 50 and 60; but by 2050 about 35% of the population are expected to be over 60. Thanks to generous early-retirement policies, only 41% of Europeans aged between 60 and 64 are in paid work. Among 65- to 74-year-olds the proportion is lower than 10%. In Croatia, Hungary and Slovakia it is below one in 20.
The levers for governments to pull are well known: they can remove financial incentives (tax or benefits) to retire early and increase those to keep working. Raising the state retirement age is a prerequisite almost everywhere; if the average retirement age were increased by 2-2.5 years per decade between 2010 and 2050, this would be enough to offset demographic changes faced by “old” countries such as Germany and Japan, found Andrew Mason of the University of Hawaii and Ronald Lee of the University of California, Berkeley.
Employers, too, will have to change their attitudes to older workers. Especially in Japan and Korea, where they are most needed, workers are typically pushed out when they hit 60 (life expectancy is 84 and 82 respectively). Extending working lives will require investment in continued training, flexible working arrangements, such as phased retirement, and improved working conditions, particularly for physically tough jobs. In 2007 BMW, a German carmaker, facing an imminent outflow of experienced workers, set up an experimental older-workers’ assembly line. Ergonomic tweaks, such as lining floors with wood, better footwear and rotating workers between jobs, boosted productivity by 7%, equalling that of younger workers. Absenteeism fell below the factory’s average. Several of these adjustments turned out to benefit all employees and are now applied throughout the company.
A final option is to lure more migrants in their prime years. Working-age populations are expected to keep growing for decades in countries such as Australia, Canada and New Zealand, which openly court qualified migrants. Others can try to entice foreign students and hope they stick around. Arturas Zukauskas, the rector of Vilnius University, thinks that he could improve greatly on the current tally of foreign students—just 700 out of 19,200. In particular, he looks to Israel, which has the highest birth rate in the rich world. Lithuania had a large Jewish population before the second world war, and many prominent Israelis have roots in the country. Partly to signal the academy’s openness, Vilnius University has started awarding “memory diplomas”, mostly posthumously, to some Jewish students evicted on Nazi orders.
The trouble is that the countries with the biggest demographic shortfalls are often the most opposed to immigration. For example, the inhabitants of the Czech Republic and Hungary view immigrants more negatively than any other Europeans do, according to the European Social Survey. Those countries’ working-age populations are expected to shrink by 4% and 5% respectively between 2015 and 2020. Countries that lack a recent history of mass immigration may have few supporters for opening the doors wider. Even if they wanted new settlers, they might have to look for them far afield. Countries with shrinking working-age populations are often surrounded by others that face the same problem.
“China has never been a country of immigrants,” explains Fei Wang of Renmin University in Beijing. It is unlikely to become one, but is trying to lure back emigrants and to attract members of the ethnic-Chinese diaspora. In February the government relaxed visa laws for “foreigners of Chinese origin”. In Shanghai, and perhaps soon in other cities, foreign-passport holders are allowed to import maids from countries such as the Philippines. That is a small step in the right direction.

Just as countries’ demographic challenges vary in scale, so the remedies will help more in some countries than in others. Take Italy and Germany. Both have shrinking working-age populations that are likely to go on shrinking roughly in parallel. But Italy could do far more to help itself. Because the women’s employment rate in Italy lags so far behind the men’s rate, its active population would jump if that gap closed quickly—and if everybody worked longer and became more educated (see chart 2). Germany could do less to help itself, and Lithuania less still.
In theory, every rich country can prise open the demographic trap. Governments could begin by lowering barriers to immigrants and raising the retirement age. They could entice more women into the workforce. They could raise the birth rate by providing subsidised child care, which would create a wave of new workers in a couple of decades, just when the other reforms are petering out. But, when a country is shrinking, many things come to seem more difficult. Earlier this year, Poland built up a large backlog of immigration applications, many of them from Ukrainians. It turned out that the employment offices were badly understaffed, and could not process the paperwork in time. They had tried to take on workers, but failed.
This article appeared in the International section of the print edition under the headline “Small isn’t beautiful”
Why people are working longer
Labour-force participation rates are rising for older people in advanced economies

Jun 11th 2018
THE golden years of retirement, when decades of toil are traded for some downtime, are starting later. In the mid-1980s, 25% of American men aged 65-69 worked; today, nearly 40% do. The situation is the same for younger men. In 1994, 53% of 60- to 64-year-olds worked; now 63% do. American women are working longer too, and similar upticks have been witnessed in Japan and other parts of western Europe. Since unhealthy workers tend to retire earlier, many attribute the ageing workforce of today to improvements in health. Mortality rates for American men in their 60s have declined by 40% since 1980; for women, they have fallen by 30%. Education and occupation are also relevant. In countries of the OECD, the share of 55- to 64-year-olds with a college education has increased in the past three decades, and better-educated people tend to work longer, doing white-collar jobs. In a similar vein, the fact that modern jobs in general are less physically taxing than those of yore allows all people to work for longer or look for jobs suitable to their advancing years.
But these are not the primary drivers of the greying workforce, suggests Courtney Coile, an economist at Wellesley College. Social-security reforms and other institutional changes play a central role. In recent decades, many countries and companies have altered the way they fund pensions. About half of Americans working in the private sector participate in employer-sponsored plans. In the 1980s a third of these were “defined benefit” (DB) schemes, under which a company pays its retired employee a predetermined lump sum depending on tenure, age and past earnings. Now, though, “defined contribution” (DC) plans, for which employees contribute a percentage of their paycheques to their retirement fund, have largely supplanted DB plans. These are generally lower than DB pensions (hence their popularity with employers), so their recipients cannot afford to retire so early. By working longer, they increase the size of the pot. Researchers reckon the growth in DC plans has led to a five-month increase in the median retirement age.
Reductions in the generosity of social security and disability insurance have also had an impact. Since the 1990s, Italy, Germany, Japan and others have raised the minimum age at which citizens can accept retirement benefits. The labour-force participation rates for older workers there have risen in lock-step, with a one- to two-year lag. A final factor is the increased number of women in the workforce: about 44% more hold a job now, across 12 developed countries, than in 1995. And, like men, they are working longer. Given that married couples often retire at the same time, this “co-ordination”, which sees men working longer to keep up with Stakhanovite wives, can have profound effects. In Canada, for example, it could explain around half the change in the labour-force participation rates of married men aged 55-64.
This is good news. The “lump of labour” fallacy holds that older workers threaten economic prosperity by crowding out younger workers. (The same argument had been used to exclude women from the workforce.) In fact the economies of many countries with ageing workforces are growing quite quickly. Older workers use their wages to buy goods and services made by other workers. And as Lisa Laun of Sweden’s Institute for Evaluation of Labour Market and Education Policy points out, with more workers, of whatever age, tax revenues and pension contributions rise. That means a larger pie for everyone.
Not much leeway Singaporeans are in the dark about their next prime minister
Not that their views count for much

Apr 25th 2018 | SINGAPORE
A PILLAR of stability, Lee Hsien Loong, son of Singapore’s independence leader, Lee Kuan Yew, has run the country since 2004. Despite a decline in his party’s popularity, the manicured electoral system has returned him to office time and again, most recently in 2015. The country is now more than halfway to the next election, which must be held in 2021 at the latest. As it nears, a tricky subject looms: who will replace Mr. Lee? He plans to step down as prime minister ahead of his 70th birthday in 2022. The question has the government on edge.
Mr. Lee will almost certainly win the next election. The ruling People’s Action Party has held power since before independence in 1965. It holds 83 of the 89 elected seats in Singapore’s parliament. Predicting the identity of the next prime minister is trickier. But a cabinet reshuffle this week provided clues. Three older ministers, all in their 60s, stepped down. Younger ones won more responsibility.
Mr. Lee’s possible successors include Heng Swee Keat, the finance minister, Ong Ye Kung, the education minister and Chan Chun Sing, newly promoted from the prime minister’s office to the Ministry of Trade and Industry. Mr. Heng, who has led the education ministry and the Monetary Authority of Singapore, as well as serving as an aide to Mr. Lee’s father, is regarded as the frontrunner. One former official praises him for his growing ease in the public eye, despite not being “a natural politician”. Wonkiness does not tend to hold Singaporean politicians back. His health, however, might: he suffered a stroke in 2016.
Public opinion is unlikely to play much part in the decision. In fact, the government is further crimping freedom of speech in a country not exactly known for it. In March parliament passed a law that allows police to ban the dissemination of videos or pictures of certain events. The sorts of incidents that qualify range from terrorist attacks to demonstrations that block pavements or disrupt business. Plans to put cameras linked to facial-recognition software on more than 100,000 lampposts will further discourage even the most respectable protests. Social media are also being scrutinized by a parliamentary committee which wants to fight “deliberate online falsehoods”. Whoever ends up in charge, the government will be well defended against unruly critics.
This article appeared in the Asia section of the print edition under the headline “Not much leeway

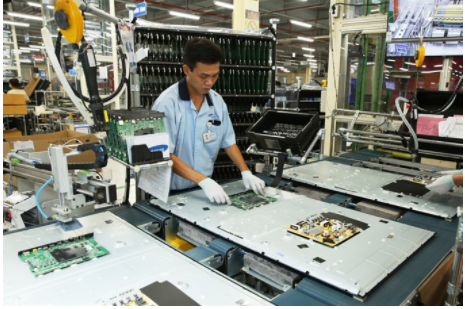
By Haiyan Zhang
Technical Director, Canada Wood Shanghai
May 30, 2018

Fire safety symposiums held in Shanghai and Beijing
Guest speakers at the event venue in Shanghai on April 27th.
Canada Wood China joined European Wood to hold symposiums on fire safety in timber structures. The first was in Shanghai on April 27th while the second was in Beijing on April 28th.
The seminars attracted more than 400 industry professionals including researchers, designers and developers. Five guest speakers from Canada, Europe and China gave presentations on fire safety attributes in modern timber structures. They also shared insight into the history and evolution of fire safety code requirements for timber structures in Canada and Europe. The latest in fire research, alternative solutions in fire safety design, and fire safety codes for timber structures in China were also discussed.

Audience members listen to a presentation at the event venue in Beijing on April 28th.
Officials from the Canadian Embassy, Canadian Consulate in Shanghai and MOHURD attended the seminars and made opening remarks.
Japan Housing Starts Summary for February & March 2018
By Shawn Lawlor
 Director, Canada Wood Japan
May 30, 2018
Total February housing starts edged down 2.6% to 69,071 units. Wooden starts fell 3.2% to 38,340 units. Pre-fab housing fell 8% to 10,063 units. Post and beam housing declined 3.2% to 29,070. Platform frame starts fell 3.0% to 8,255 units. The decline in 2×4 starts was primarily attributable to a 5.9% decrease in multi-family rentals. Platform frame custom ordered and built for sale spec housing gained 0.8% and 4.4% respectively.
March housing activity decelerated significantly with an 8.3% drop in total starts. Rental housing fell 12.3% compared to owner occupied single family starts which dropped 4.2%. Total wooden housing retreated 4.3% to 39,736 units. Post and beam starts fell 4.3% to 30,106 units. Wooden pre-fab fell 4% to 911 units. Platform frame starts fell 4.4% to 8,719 units. As with the previous month, results for platform frame were dragged down by weakness in rentals; single family starts showed gains. Platform frame rentals fell 9.1% to 5,385 units, custom ordered single family homes increased 3.0% to 2,226 units and built for sale spec homes increased 7.4% to 1,086 units.
Japan Economic Update
By Shawn Lawlor
Director, Canada Wood Japan
May 30, 2018
According to Cabinet Office date, Japan’s first quarter GDP slipped by 0.2%, thereby ending two consecutive years of continuous growth. The decline was attributable to flat consumer spending and a slight decrease in capital investment. The majority of analysts contend that this decline is a temporary blip and that economic fundamentals remain strong. A tightening labour market resulted in a 1.3% year increase in average wages and inflationary pressures are picking up. Improved capital spending and exports are expected to Japan’s GDP is expected to return into positive territory for the balance of the year.
Leading Architectural Firm and Prefabricator in Korea Join Forces for the Creation of Industrialized Wood Frame House
By Tae Hwang
 Program Manager / Market Development & Market Access, Canada Wood Korea
May 30, 2018
Gansam Architects & Partners, one of the top 10 architectural firms in Korea and Refresh House, the leading prefabricator-builder-developer of energy efficient wood frame houses, have joined their efforts together for the creation of small ready-to-order wood frame structure called “Off-site Domicile Module” or ODM. The ODM, with slogan of “Small but Enough,” has footprint of 7.25-meter x 3 meter rectangular shape with 20 m2 of floor area.
Several types of the module designed by Gansam will be built completely and entirely under the roof of Refresh House’s factory and can be transported to sites. The Nest, pictures shown in this article, is designed as small home consists of sleeping and living area, kitchen and bathroom. And other types for different uses include canteen, pop-up store, exhibition, café,etc. Also, you can order single module or two modules which can be joined at the site for more space.
Industrialized construction, off-site construction or prefabrication is gaining momentum in Korea as the weather dependent traditional site building is getting less and less productive due to harsher weather arising from climate change and the shortage of skilled labours combined with rising wages.

Japanese-style housing projects planned
Update: June, 25/2018 – 14:56
| TWGroup Corporation and Japan’s Hinokiya Group Co. on June 22 sign an agreement to develop housing and other projects in Việt Nam. — VNS Photo |
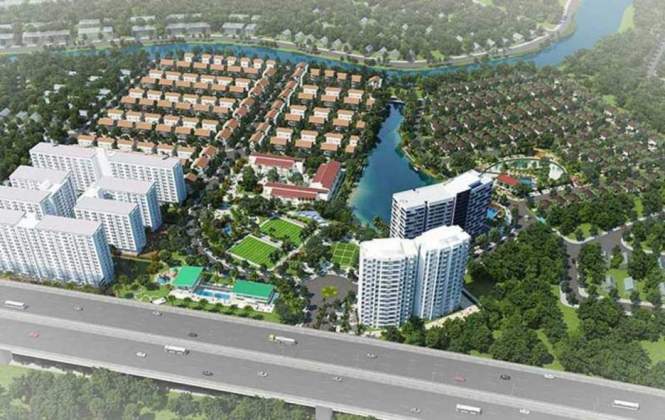
HCM CITY — TWGroup Corporation and Japan’s Hinokiya Group Co. have signed an agreement to develop housing and other projects in Việt Nam, starting off with a Japanese-style housing project in HCM City next year.
The low-rise residential project will have intelligent solutions enabling residents to live close to nature.
TW said in a press release that the outstanding elements of the project would include a relaxing onsen area – a Japanese hot spring for dipping in the buff — and a Japanese-style park with fresh greenery.
Lê Cao Minh, general director of TWGroup, said: “Hinokiya is a leading corporation of Japan, a pioneer in bringing solutions to improve the quality of life.
“After contacting Hinokiya leaders and visiting their projects in Japan, we are really convinced by their convenience, intelligence, safety, and, especially, the humanity.
“Hinokiya builds not only housing but also pre-schools and nursing homes for old people.”
Hinokiya said it fully believed that the experience of both parties would create projects bearing their own marks, meeting the needs of customers for ideal living spaces.
The company, established in 1988, designs, builds, and sells houses; undertakes renovation, expansion, and reconstruction works; offers real estate brokerage services; leases houses; provides real estate investment and lease management consultancy, and produces and sells thermal insulation materials.
It also operates nursing and childcare facilities.
TWG has interests in property, construction, construction consultancy, education, and healthcare. — VNS

China’s ambitious Belt and Road Initiative, formally announced in 2013, has revived the country’s ancient concept of the Silk Road.
Highlights
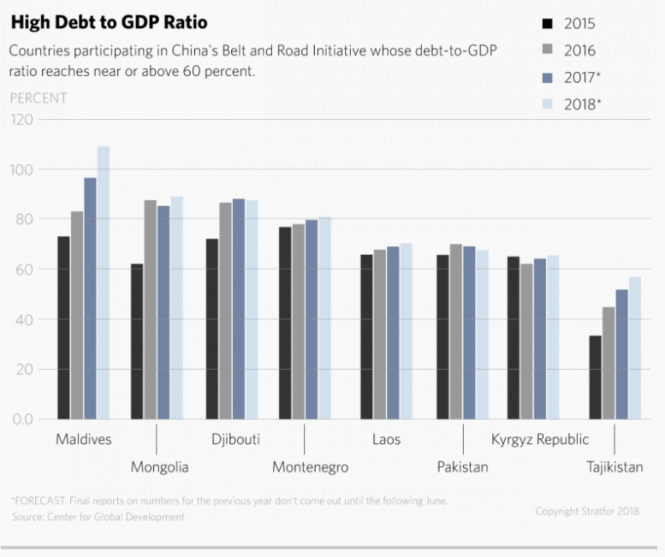
◾Despite its success in the developing world, Beijing’s approach to the Belt and Road Initiative has raised concerns over corrupt practices and financial sustainability in several recipient countries.
◾Beijing’s ambitious outreach, and its hidden agenda for strategic expansion riding on the initiative, will continue to fuel skepticism, suspicions and resistance among core powers.
◾Ultimately, given the sheer scale of the Belt and Road Initiative, snags, delays and cancellations are to be expected.
Since it began in 2013, the Belt and Road Initiative has become the centerpiece of China’s domestic and foreign policy, jump-starting diplomatic, financial and commercial cooperation between China and more than 70 neighboring countries across the Eurasian landmass. When complete, the massive infrastructure project will increase China’s overland and maritime connectivity to other regions, extending its trade and technology to new markets. The initiative also gives Beijing the opportunity to offload some of its excessive industrial capability, facilitating the necessary domestic industrial reforms it needs to establish a more stable economy.
In the past five years, China has spent at least $34 billion on the Belt and Road Initiative, focusing primarily on connectivity projects such as railways, ports, energy pipelines and grids. And though China has made major progress toward its long-term goals, it has also experienced several delays and setbacks. Given the sheer scale of the Belt and Road Initiative and how many large projects it encompasses, hold-ups, cancellations and failures are to be expected. But the causes of delays, in some cases a result of increased skepticism and resistance to China’s strategic aims, will continue to shape the future development of the Belt and Road Initiative.
The Big Picture
China’s ambitious Belt and Road Initiative, formally announced in 2013, has revived the country’s ancient concept of the Silk Road. Stratfor has closely tracked the development of this continent-spanning project, and in 2017 they published a four-part series discussing the underlying motivations behind this grand initiative — and the challenges it faces. Now that the Belt and Road Initiative has entered its fifth year, Stratfor is taking the time to examine the current state of the project and how its challenges will impact the way we analyze the initiative in the coming year
Strategic Partnerships
Though one of Beijing’s stated goals is to foster inclusive Eurasian integration with the Belt and Road Initiative, its scheme so far has focused on the developing world, particularly countries in Central and Eastern Europe, South and Southeast Asia and Central Asia. It has achieved only limited success drawing developed states, such as Japan, and core European powers into the Belt and Road project. After all, though they may share business interests with China, they also maintain a strong and growing skepticism about Beijing’s means of increasing its competitiveness and its agenda for strategic expansion on the global stage.
According to a survey covering primarily emerging and transitional economies, Chinese financing — such as the Silk Road Funds and the Asian Infrastructure Investment Bank — provides a more significant boost to the majority of Belt and Road countries than their own domestic financing or even, in many cases, the International Monetary Fund, the World Bank and other international financing institutions.
China has many reasons for focusing on developing nations with strategic positions. And the developing countries themselves, which in many cases have weak economic foundations and governance, have been extremely welcoming to the Belt and Road Initiative. Many of these countries — 11 of which have been identified by the United Nations as the world’s least developed, such as Laos, Tanzania and Djibouti — have major infrastructure deficits but are eager to avoid the kind of restrictive, strings-attached financing offered by Western institutions. Since China’s approach to funding emphasizes non-interference and is generally unconditional and indiscriminate of regime, Beijing has achieved more access and goodwill than is usually given to its Western competitors. China’s methods to draw these smaller countries into its Belt and Road framework also offer them a way to leverage their strategic positions and balance regional powers such as Russia, the European Union and India.
Domestic Complications
China’s aspirations with the Belt and Road Initiative have increasingly been constrained by its own approaches and strategic objectives. Though the Belt and Road gained great success in the developing world, challenges over financing capabilities and political instability in the recipient states have repeatedly caused delays and even cancellations. This has been the case with several transportation and energy projects in countries such as Kazakhstan, Bangladesh, Myanmar and Pakistan. Beijing also had the unlikely hope that it could link several war-torn states, such as Afghanistan and Yemen, but that will certainly not happen in the foreseeable future.
Moreover, China’s partnership and perceived support for partner countries’ ruling regimes have led to domestic political polarization, opposition and international criticism. In some cases, leaders of these states have used the Belt and Road Initiative in service of their domestic political agendas, leveraging Beijing’s international clout to further their own international interests. And more significantly, corrupt governments have used Chinese funds for their own personal and political benefit.
Problem Countries


Political corruption and instability have not only invited judgment but have also put Belt and Road projects at risk of delay. In Malaysia, for example, a game-changing May election turned several China-backed infrastructure projects into centerpieces of the political discourse. The new ruling power in Kuala Lumpur aims to investigate investments to not only delve into the corruption of the former government but to reduce its debt burden. Although Beijing’s policies are mostly to blame for such complications, China has also been frustrated by the liabilities caused by corrupt regimes. For instance, despite early investment, China has had to hold back some of its projects in politically risky countries such as Djibouti and Venezuela.
Finally, China’s eagerness to draw in partner countries provides these governments with leverage as they attempt to win investment from China’s rivals. Countries such as Thailand, Indonesia and some South Asian states, in particular, have been able to encourage Japan and India to compete with China over railways and hydropower projects at home, dampening Beijing’s objective of becoming the most influential regional power.
Debt Concern, or Debt Strategy?
China’s approach to debt financing in key strategic projects has also led to pushback, mainly over Beijing’s level of influence. For example, the East Coast Rail Link in Malaysia and the deep-water Kyaukpyu port in southern Myanmar are currently under review by the recipient governments, which are already critical of Beijing’s goal of securing supply routes other than the Strait of Malacca. Like Malaysia, Myanmar is concerned about the possibility of ending up in a “debt trap,” where China holds disproportionate control over the nation’s economy. After all, the $9 billion Kyaukpyu project is equivalent to 14 percent of Myanmar’s gross domestic product. As a result, the country is fearful that China could ultimately exert its influence to gain ownership of the strategically important Kyaukpyu port.
Myanmar’s concern is not unfounded. Both Sri Lanka and Pakistan — governments struggling with debt repayment and financing negotiations — have entered into “debt-for-assets” land-lease agreements with Chinese companies. In Sri Lanka, the Hambantota Port is now leased for 99 years, while areas around the Gwadar Port in Pakistan are leased for 43 years. In other states that already have high external debt or rely excessively on direct Chinese investment — such as Djibouti, Laos, Tajikistan, Kyrgyzstan and Montenegro — Beijing has used different forms of debt relief or forgiveness measures, in some cases resorting to acquiring the recipient country’s natural resources or long-term oil contracts to offset the loans. And speculation is rising over whether China will leverage its financing of strategic deep-water ports in countries like Myanmar and Djibouti to gain an advantage in the Indian Ocean supply routes. Just recently, China established its first overseas naval base in Djibouti.
Confronting the Core Powers
There is a growing wariness of China’s strategic intent and expanding influence with the Belt and Road Initiative. Beyond the concerns of developing states, China’s strategic rivals and powers throughout the developed world maintain a strong, if not growing, resistance to the project. Though core regional powers such as India, Russia and some European countries share business interests with China, they also maintain a strong and growing skepticism about Beijing’s means of increasing its competitiveness. And beyond that, China’s hidden agenda for strategic expansion on the global stage.
Despite India’s tactical recalibration to ease its tense relationship with China, New Delhi remains vehemently opposed to the China-Pakistan Economic Corridor. This is seen by India as part of Beijing’s strategy to encroach on the subcontinent and could potentially undermine New Delhi’s claims to the contested Kashmir region. Indeed, India’s opposition has factored significantly in some South Asian states’ strenuous geopolitical balance. For instance, last year Nepal scrapped a $2.5 billion Budhi Gandaki hydropower project, because of Indian concerns.
In Europe, core EU members such as Germany and France have found Beijing’s outreach in Central and Eastern Europe to be more competitive than cooperative, viewing the project as an attempt to dilute the bloc’s rule and agenda. This led to ongoing criticism and increased scrutiny over Chinese investment and projects in Eastern and Central Europe. The proposed railway between Budapest and Belgrade — a key piece of Beijing’s strategy to link to the Mediterranean port of Piraeus — is under review.
Where China’s outreach has received some success in the developed world is in Russia and, to some extent, Japan. Initially suspicious of the Belt and Road Initiative, Russia has grown more amiable as it recognizes how Chinese investment can benefit its own economy and foster development in Central Asian countries over which it exerts significant control. Moscow has begun supporting and even participating in some Belt and Road projects. Most recently, it entered into a co-financing agreement with China for close to 70 projects under its own Eurasian Economic Union, a move that will greatly ease the barriers to Beijing’s investment in some Eastern European and Central Asian countries as well as the Arctic.
Japan, for its part, continues to refrain from openly endorsing the Belt and Road Initiative. But in more tacit ways, the Japanese government is working to encourage its companies to participate in some of China’s projects. This is especially true in areas such as Central Asia and Africa, where Tokyo hopes to boost Japanese corporations’ waning overseas presence.
Looking Forward
Despite these successes, Beijing’s ambitious outreach will continue to fuel skepticism, suspicion and resistance among the core powers and complicate its agenda, especially as it works to hedge against increased pressure from the United States. And China has even inadvertently encouraged loose regional blocs to counter it. Japan and India, for instance, have begun working on an alternative to the Belt and Road Initiative on the African continent, participating in a U.S.-led proposal to establish a quadrilateral framework for infrastructure investment. Elsewhere, Australia is pledging an extensive campaign of aid, trade and diplomacy in the South Pacific, hoping to regain the position it has lost to China in its traditional backyard.
The reality is that none of these countries’ proposals can outdo China’s enormous and well-funded infrastructure plan. They lack China’s capital, human resources and moral flexibility. For participating countries, the long-term benefits of Chinese investment and infrastructure construction in many ways outweigh the risks. So, while investors should be aware that China will continue to experience setbacks in its Belt and Road projects, the initiative is still moving along relatively successfully, as are Beijing’s expansionary aspirations.
Economic scramble for North Korea picks up pace
Pyongyang appears to favour state-guided Chinese model over unfettered capitalism
Bryan Harris in Seoul, Lucy Hornby in Beijing and Demetri Sevastopulo in Washington JUNE 19, 2018
When Donald Trump outlined his vision for the economic development of North Korea, he played on western ideals of luxurious apartments with sea views.
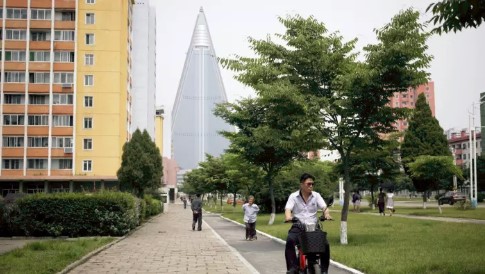
But just days after a landmark summit with the US president, North Korean leader Kim Jong Un has made clear he has a different model in mind: China.
The 34-old-year dictator was set to depart Beijing on Wednesday after a two-day tour aimed at winning China’s financial backing for what Pyongyang says will be a new era of reduced international tensions and domestic economic development.
Scepticism persists about North Korea’s true ambitions, but the renewed optimism has investors salivating over the country’s untapped markets, including its substantial mineral deposits and inordinately cheap workforce.
As the scramble for North Korea picks up pace, however, it is becoming clear that Pyongyang is veering not towards unfettered capitalism but rather a state-guided model along the lines of its huge neighbour.
Beijing — with its long history of friendship and political affinity with Pyongyang as well as its geographical proximity — appears poised to reap its dividend.
 © AP
© AP
“China is eager to encourage the North Koreans to take up the Chinese model because it will bind Pyongyang closer to Beijing and therefore lower the chances of Pyongyang either falling into the US orbit or experiencing a democratic uprising against the Kim regime,” said Dennis Wilder, a former top China analyst at the CIA.
China is holding out the promise of economic development to Mr. Kim if he lowers tensions with the US, Mr. Wilder added.
Long viewed as the last bastion of Stalinist economics, North Korea has undergone a period of quiet but transformative change since Mr. Kim took power in 2011.
The regime introduced agricultural reforms in 2012, legal revisions in 2014 and an overhaul of enterprise laws in 2015 — all of which loosened state control over the market and have contributed to an uptick in wages and the quality of life.
But most of the changes have been spearheaded by ordinary North Koreans, who have found themselves free to eke out a living through private enterprise within the shadows of the state’s hulking institutions.

Unlike his father and predecessor Kim Jong Il, Mr. Kim has allowed marketisation to flourish and has vowed to pursue economic development. These changes, however, have not been accompanied by political liberalisation.
“He is copying China without admitting it. These are reforms without openness,” said Andrei Lankov, a North Korea expert at Kookmin University in Seoul.
“North Korea wants foreign direct investment. The problem for them now is they don’t know how to get it,” added Prof Lankov, who regularly travels to the reclusive nation.
In this regard, Beijing appears to be willing to offer assistance. Last month, the Chinese Communist party escorted a group of North Korean officials around Beijing to study “reform, opening up and economic development”, according to the Global Times, a Chinese newspaper.
Their trip followed a visit by the Chinese ambassador to Sinuiju, North Korea’s special economic zone near the Chinese border, as part of a broader push by Beijing to promote its model of controlled economic opening.

Mr. Kim’s interest in the Chinese model was further highlighted by his inclusion of Pak Pong Ju, a key official spearheading North Korea’s economic reform, in this week’s delegation to Beijing.
“This visit to China was primarily aimed at winning economic support,” said Lee Seong-hyon, researcher at Sejong Institute in Seoul. “China’s economic model is the most viable, realistic option for North Korea and [Chinese President Xi Jinping] must have assured Kim about how North Korea can achieve economic development without risking political stability.”
One part of the model that North Korea has already sought to replicate are the special economic zones (SEZs), which China used effectively in southern cities Shenzhen and Zhuhai.
North Korea operates more than 20 SEZs, mostly in its border regions, although few have attracted foreign investment.
Even before the implementation of international sanctions, the attractiveness of the zones was undercut by entrenched North Korean bureaucracy, a lack of infrastructure — including electricity and roads — and the fear that assets could be expropriated.

“Sometimes they even put these SEZs in the middle of nowhere, so they could not cause a political disturbance,” said Prof Lankov.
“North Korea always wanted investment but on its own conditions. China used to be annoyed by these conditions. But now that Beijing is in a trade war with the US, it may accept.”
Lee Sung-yoon, a Korea expert at Tufts University, cast doubt on the scope of economic reform in North Korea, saying that Mr. Kim only sought “controlled SEZs which are more like enclaves for generating foreign currency”.
“Genuine reform and opening would entail liberalising banking and the private sector [and increasing] transparency in finance and trade — all anathema to long-term regime preservation,” he added.
South Korea is also anticipating economic liberalisation and the lifting of sanctions.
Recommended
North Korea nuclear tensions

Kim Jong Un visits Beijing after Trump summit
The Moon Jae-in administration has already outlined to Mr. Kim its plans to develop rail routes along North Korea’s east and west coasts, which could integrate the reclusive nation into the wider region.
The country’s dominant conglomerates, meanwhile, have established task forces to probe opportunities in the North amid concerns about the longer-term economic outlook in South Korea.
According to a survey of 167 businesses earlier this month, almost 75 per cent would be prepared to invest in the North if sanctions were lifted. Companies that stand to benefit, such as steel and cement groups, have seen their stock prices soar in recent weeks.
Shares in Hyundai Cement rose more than 500 per cent between March and June as detente unfolded on the Korean peninsula. US-North Korea summit: a win for Kim Jong Un
“There is a lot of enthusiasm. Maybe too much,” said Chung Yeon-wook, a private banker with NH Investment and Securities.
https://next-media-api.ft.com/renditions/15288169683760/1920×1080.mp4
However, many in Seoul feel that South Korea’s historically adversarial relationship with the North may undermine its prospects.
“The rivalry between China and South Korea [for access to North Korea] has already been there for 10 years. China is now taking advantage of the situation because the North Koreans feel more comfortable dealing with them,” Mr. Chung added. Additional reporting by Song Jung-a

Stratfor Worldview June 7 2018
Overview
China Remains in the U.S. Cross-hairs. The United States will impose tariffs, sanctions and blocks on investment and research in a bid to frustrate China’s development of strategic technologies. China not only has the tools to manage the economic blow, but will also accelerate efforts to lessen its reliance on Foreign-sourced technological components.
Trade Battles Fall Short of a Full-Fledged War. Trade frictions will remain high this quarter as the White House continues on an economic warpath in the name of national security. U.S. tariffs will invite countermeasures from trading partners targeting U.S. agricultural and industrial goods. As Congress attempts to reclaim trade authority, the White House will refrain from escalating these trade battles into an all-out trade war.
Taking the First Big Step with North Korea. Drama will inevitably surround the negotiation, but the United States and North Korea have a decent shot at making progress toward a political agreement this quarter, something that will set the stage for much thornier and lengthier technical discussions on denuclearization. Even if talks appear to break down in the coming months, Pyongyang will avoid more aggressive measures in the near term while working to maintain diplomatic and economic momentum with China and South Korea.
Tremors in Europe. The new Eurosceptic government in Rome will hold off on threats to leave the Eurozone for now, but will be seeking allies in southern Europe to battle Brussels on fiscal deficit and debt rules. Divisions within the British government will meanwhile raise the potential for Parliament to take more control of the Brexit process to keep the UK in the customs union.
All Eyes on Riyadh. As Iran’s major European and Asian clients negotiate waivers with the U.S. in return for reducing oil exports from Iran, the United States will be looking to Saudi Arabia to coordinate with major oil producers to make up the supply gap. Riyadh will nonetheless be cautious in planning a market intervention as it aims for a higher price band in anticipation of the Saudi Aramco IPO.
Moscow Tries to Break a Stalemate with Washington. Poland and other borderland states will make appeals for stronger security guarantees from Washington while they still have the United States’ attention. Moscow will try to break a negotiating stalemate with the U.S. to talk sanctions, military build-ups and arms control by promoting its mediation in the Syrian conflict and its potential utility in North Korean denuclearization. Don’t hold your breath for a breakthrough, though.
Polarizing Allies. In harnessing the power of tariffs and extraterritoriality in sanctions, the United States will polarize many of its security allies in Europe and Asia — strategic partners that Washington needs to counterbalance the emerging threat from China and Russia. Attempts to target Russia’s strategic relationships will call into question the long-term reliability of the U.S. as a defense partner and invite heavy push back from Turkey, Vietnam, Germany and India, in particular.
Iran’s Return to the ‘Resistance Economy.’ As the limits of EU economic safeguards are exposed, Tehran will cautiously walk back its commitments to the JCPOA while seeking out willing partners to circumvent sanctions. Russia will take advantage of Iran’s rising vulnerability to deepen its military ties with Tehran while mediating between Iran and Israel in Syria.
The Big Turkish Gamble. Turkey will be a big feature of the third quarter following a precarious electoral gamble by Turkish President Recep Tayyip Erdogan. Erdogan has the tools to eke out a win and whip up a nationalist reaction to any outside questioning of the vote, but the highly polarized country will remain on shaky economic ground amid worsening relations with the West.
Votes against the Status Quo. Mexico’s populist candidate stands a chance of winning big in July elections, which could pose a threat energy and education reforms while further complicating NAFTA talks. A strong anti-establishment current will also be on display in Colombia, where the FARC peace deal is under threat, and in Brazil and Argentina, where the appetite for economic reform will plummet.
Key Trends
The Constant Battle Against Unpredictability
As the United States enters the long summer stretch before midterm congressional elections in the fall, the midpoint of Donald Trump’s presidency will also come into sight this quarter. And after a particularly suspenseful spring of sanctions, tariffs, Cabinet changes and summit surprises, the U.S. president has only reaffirmed to the world his reputation for bending constraints toward a particular policy end — even if the means to that end cause considerable collateral damage at home and abroad.
And so, with several negotiations still pending — including discussions over the fate of the Korean Peninsula and high-stakes trade talks — a world weary from grappling with the fitful superpower is bracing itself for another quarter of whiplash from White House maneuvers.
The world is muddling through a blurry transition from the post-Cold War world to an emerging era of great power competition.
But while Trump thrives on unpredictability as his chief negotiating tactic, many of his moves fit quite neatly— Even predictably — in the context of the United States’ great power rivalry with China and Russia. The United States’ intensifying economic pressure on China, its harder-hitting sanctions on Russia and its growing support for critical borderland states, such as Taiwan, Ukraine and Poland, are all a part of this budding competition. Even the U.S. search for a way to reunify and denuclearize the Korean Peninsula is a piece of a broader long-term strategy to balance against China.
Yet the United States is creating bigger distractions for itself in the Middle East with Iran while putting stress on the very alliances it needs in its global competition with China and Russia. Although the contradictions in U.S. policy are taxing much of the world, this prolonged state of confusion is par for the course as the world muddles through a blurry transition from the post-Cold War world to an emerging era of great power competition.
U.S.-China Competition Builds
Narratives casting China as an economic imitator, as opposed to an innovator, are out of date. As the country grows more economically advanced, focusing its attention on game-changing technologies, the United States will heighten its economic scrutiny on China — and squeeze numerous companies along U.S.-Asian supply chains in the process. This dynamic will endure well beyond the quarter and the Trump presidency. In the name of national security, the executive and legislative branches of the U.S. government will continue to target China’s Made in China 2025 strategic development program through various means, including tariffs, sanctions and restrictions on investment and research. U.S. companies, particularly those involved in sensitive technology sectors, will face growing risk and uncertainty over the potential for export controls and for closer monitoring of foreign investments.
Specific measures to watch for in the third quarter include a special investment regime for Chinese companies designed to block investment into sensitive areas like robotics, telecommunications, semiconductors, artificial intelligence (AI), virtual and augmented reality, and new energy. The White House already has announced its intention to impose tariffs on up to $50 billion worth of Chinese industrial technology goods under a Section 301 investigation into Chinese intellectual property and technology theft. (More details are expected June 15.) The United States will apply tight scrutiny to outbound investment to or informal collaboration with Chinese companies, especially in high-tech sectors. Telecommunications firms Huawei and ZTE are already feeling the pressure; the U.S. Commerce Department has slapped hefty penalties on ZTE, while Huawei is under investigation by the Justice Department. In addition to those companies, the United States could expand its net to ensnare tech giants like Baidu, Alibaba and Tencent, launching investigations into web services they provide. Washington is also likely to impose visa restrictions on Chinese researchers and students in the United States.
U.S. pressure will only make China more determined to accelerate its drive to forge its own supply chains for sensitive technologies.
Deepening U.S.-China economic competition, however, does not guarantee a trade war, in which tit-for-tat trade measures escalate with no clear end in sight. China, along with the European Union,
Japan and other major U.S. trade partners, is trying to avoid destabilizing the global economy more severely. The United States, meanwhile, despite an apparent penchant for picking trade spats, will run into political constraints that will avert a worst-case scenario. Washington and Beijing alike will eventually make concessions to justify dialing back their more extreme tariff threats. Still, the negotiations will be bumpy.
There are hard limits to what each side can concede, and Chinese compliance is not assured, leaving the door open for some tariffs, and retaliatory measures, to shake out this quarter.
Internal White House dynamics will also be key to watch in tracking the progress (or lack thereof) in trade negotiations. Treasury Secretary Steven Munchkin and White House economic adviser Larry Kudlow will push for a compromise that minimizes collateral damage, while economic adviser Peter Navarro and U.S. Trade Representative Robert Lighthizer drive a much harder, and perhaps impossible, bargain with China. In the lead-up to U.S. midterm elections, the White House will probably be more sensitive to retaliatory tariffs targeting the U.S. farm belt, where support for Trump was strong during the 2016 presidential race. Tariffs on smaller crops such as cranberries and ginseng, for example, could hit a political nerve in Wisconsin, a state in which the farming vote could make a big difference.
Even as the negotiation inches ahead, the United States won’t prevent China from providing heavy, focused support to Made in China 2025 sectors. The U.S. pressure will only make China more determined to accelerate its drive to forge its own supply chains for sensitive technologies. China will, however, be willing to negotiate ways to increase U.S. imports, including of energy, semiconductors, vehicles and agricultural products; to partially liberalize certain sectors, such as the financial sector; to reduce some trade barriers for imported vehicles; to enhance intellectual property protection rights; and to restructure state-owned enterprises as part of its reform drive. Even if the United States hits it with tariffs this quarter, China has the political and economic means to withstand the blow at home [10]. A growing number of maturing corporate bonds will add to the financial strain on local state-owned and private enterprises, but Beijing will inject liquidity selectively to ease the pain, particularly in central and northeastern China, and to manage any fallout.
A Framework for North Korean Denuclearization
Trump and North Korean leader Kim Jong UN will meet face-to-face June 12 for a much-anticipated summit in Singapore]. While there will be moments throughout the process where it appears as if the whole dialogue is collapsing, there is reason to believe that the negotiation will still have legs by the end of the quarter. Our focus will not be so much on the drama to come — the typical walk-outs,
Name-calling and muscle-flexing — as Trump and Kim battle to prove who can play the unpredictability card most effectively in the talks. Setting aside the theater of the negotiation, the fundamental question for the quarter is whether both sides will muster enough political will to develop a framework for denuclearization. If a dialogue advances, it will likely start with freezing nuclear development, leaving room to tighten the screws on denuclearization over time. Just as the United States is unwilling to offer North Korea instant regime security, North Korea will negotiate denuclearization only over a long period of time.
Compared with previous efforts at negotiation, the stakes are much higher this time around. North Korea is closer than ever to its nuclear deterrent, and if the talks fail, the United States will have invalidated the diplomatic route. The United States would find it difficult to build international consensus to reinstate crippling sanctions on North Korea, much less a consensus to pursue a military option.
If the United States can manage to avoid a military conflict with North Korea, it will be able to apply more resources and attention to reinforcing countries in China’s borderlands.
But a breakdown in talks with the United States would not necessarily lead North Korea to resume its nuclear testing immediately. Even if the United States walks away, China and South Korea would keep up the diplomatic momentum with North Korea, giving Pyongyang an opportunity to press its neighbors to ease up on their own economic sanctions.
Japan will remain largely on the sidelines of the negotiation], given its frosty ties with South Korea and even frostier ties with North Korea. As trade tensions mount between the United States and Japan over the threat of auto tariffs, Tokyo will do its best to keep them separate from its security partnership with the United States. Japan’s biggest concerns lie in North Korea’s short- and medium-range ballistic missile threats and any short-term shifts to the U.S. force presence on the Korean Peninsula that could also lead to a draw down in Okinawa before it is politically and militarily ready to compete with China. Japanese Prime Minister Shinzo Abe will try to keep a high diplomatic profile this quarter both to try to insert Japan’s security interests into the U.S.-North Korea dialogue and to distract his own constituency from a scandal that threatens his six-year tenure. Should Abe lose the critical contest for the ruling party’s leadership in September, Japan could enter another period in which prime ministers come and go more frequently, creating more uncertainty as the great power competition in the Pacific heats up.
If the United States can manage to avoid a military conflict with North Korea, it will be able to apply more resources and attention to reinforcing countries in China’s borderlands [19]. Though China has managed to ease tensions with the states in its periphery, its continued militarization in the South China Sea will draw the United States into a more active military role in the region to balance it. The United States will increase naval deployments and patrols in the South and East China seas this quarter while working to expand military exercises with members of the Association of Southeast Asian Nations (ASEAN). An increase in U.S. deployments will lead to a period of heightened tension between Chinese and U.S. forces in these waters, and instances of harassment could become more frequent as the rate of close encounters and interceptions increases.
Friction Points in the U.S.-Russia Relationship
Russia’s influence over North Korea will remain limited so long as Washington sustains its diplomatic engagement with Pyongyang through the quarter. If the talks make progress, Russia will try to secure a role in the denuclearization process to make sure it has a seat at the table. And should the talks collapse, Russia will align itself closely with China to resist the United States in the U.N. Security Council on sanctions and military action.
The push and pull between the U.S. Congress and the president on Russia policy [20] can be messy and contradictory at times, but the result tends to be a harder U.S. line on the country. Congress will lean on the Treasury Department to sharpen its aim in targeting Russian elites with an eye toward sowing divisions in the Kremlin without creating the kind of significant global economic blowback that sanctions against Russian aluminum producer Rusal caused in the second quarter [21]. At the same time, U.S. lawmakers will be working to implement the Russia-related provisions of the Countering America’s Adversaries through Sanctions Act [22] (CAATSA) to coerce other countries to reduce their defense, intelligence and energy ties with Russia.
Though the White House has been more reluctant in the past to confront Moscow, secondary sanctions targeting Russia’s defense and energy sales appeal to its business sense by creating more export opportunities for U.S. liquefied natural gas producers. They will also appeal to the United States’ business sense by potentially creating more export opportunities for U.S. defense firms and for U.S. liquefied natural gas producers. Commercial interests, along with a growing U.S. strategic focus on Central and Eastern Europe in its competition with Russia and China, will give Poland, Ukraine and the Baltic states an opportunity to appeal to the White House for stronger security commitments. Warsaw, in particular, will try to advance talks with Washington over a permanent U.S. military presence in Poland, which will in turn cause Russia to up the pressure on Belarus to host a Russian airbase in its borders.
A potential military buildup in Russia’s periphery is one of several factors that could prompt a high-level dialogue, or at least preparations for one, between Washington and Moscow this quarter. Russian President Vladimir Putin has a long list of items ready for when he sits down with Trump, including sanctions, military buildups and stymied arms control talks. Russia will try to use its mediation in the Syrian conflict and offers to help with North Korea’s prospective denuclearization to present itself as a more constructive force. But the White House will engage with Moscow at a high level only if it feels that it has made enough progress on North Korea that it can deflect negative attention from the Russia-related investigations underway. Even if Trump and Putin manage to set up a meeting, the geopolitical environment will not be conducive to a grand bargain.
It will be important to watch how Putin handles the various challenges facing him this coming quarter.
Having made it to a fourth term in office in elections in March, Putin will have to maneuver carefully among the government, his inner circle and Russia’s powerful oligarchs as the United States dangles the threat of heavy sanctions over them. Efforts to consolidate the assets of Russia’s elite will continue in the third quarter, as the Kremlin works to maintain economic stability and political loyalty. Higher oil prices will help ease some of the strain that honoring social pledges made during the campaign season, increasing security spending and hosting the World Cup have put on the Kremlin’s finances. Competition among the security services remains a key area to watch as Putin balances among rival factions. We’ll also be watching carefully for further signs that the longtime president is elevating younger members of the elite in search of a successor.
The more immediate priority in the quarter will be for Putin to try to take more steam out of opposition protests. In the second quarter, a wave of opposition protests in Armenia that swept longtime leader Serzh Sargsyan from power was another wake-up call for the Russian government and the heads of other former Soviet states: Once a protest movement has gathered enough momentum, not even brute force tactics can quell it. Determined to avoid a similar fate, the Kremlin will work on co-opting opposition leaders into government positions. Opposition leaders like Alexei Navalny are unlikely to fall for this strategy. But figures from other prominent dissident parties — especially those that stand to do well in September’s regional elections, including Yabloko and the Communist Party — may yield to the Kremlin.
Doubling Down on Iran
A big element of the U.S.-Russia competition will also play out in the Middle East. In walking away from the Iran nuclear deal and reinstating hard-hitting sanctions, the White House is hoping against all odds to foment enough economic frustration in Iran to set regime change in motion. Israel, meanwhile, is seizing a rare opportunity to escalate its military campaign against Iranian and Hezbollah assets in Syria, knowing that it has firmer security guarantees from the United States to manage the fallout of a cycle of attacks and retaliatory attacks that risks drawing in Russia. Moscow will plan its next steps carefully with the aim of avoiding a direct collision with the United States while exploiting U.S. and Israeli needs to disengage on the Syrian battlefield. Despite its attempts to mediate between Israel and Iran — in hopes of bargaining on a more strategic level with the United States — Russia’s limited influence on the Syrian battlefield will prevent a lasting truce. Russia also will try to take advantage of Iran’s vulnerability with the United States to deepen its own military footprint in the region. Watch for discussions between Iran and Russia over boosting Iranian air defenses and appeals from Moscow for access to Iranian bases.
Tehran’s focus for the third quarter will be to buy itself as much room to maneuver as possible with those trading partners willing to risk U.S. secondary sanctions. In the immediate term, Iran will take care to avoid aggressive actions that could push the European position closer to that of the United States. But as the limits of the European Union’s economic guarantees become more evident in the coming months, Iran’s internal debate over how to proceed will intensify. Iran will probably still confine retaliatory attacks against Israeli strikes in Syria to the Golan and potentially the Palestinian territories as it tries to avoid a bigger conflagration. It will also test the limits of the nuclear deal and its cooperation with Europe, for instance by threatening to increase enrichment, to limit access to International Atomic Energy Agency inspectors or to withdraw from the Nuclear Non-Proliferation Treaty.

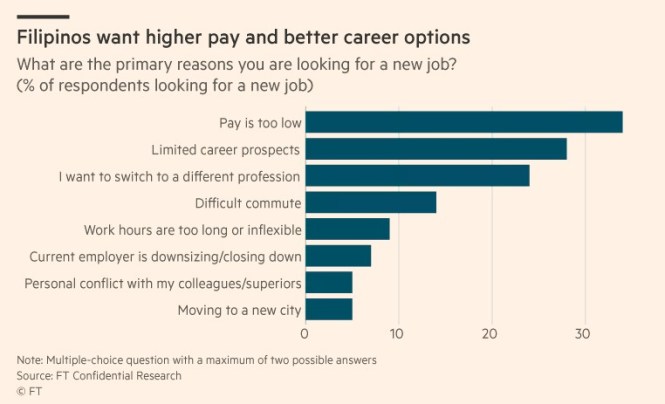
Philippine infrastructure push is unlikely to boost wages as lack of high-paying jobs hinders government’s poverty reduction plan FT Confidential Research JUNE 18, 2018
As living costs in the Philippines rise, neither the government nor the private sector can provide Filipinos with higher-paying jobs. Dissatisfied workers demanding more work, more money and better career options threaten President Rodrigo Duterte’s poverty reduction agenda. In our first-quarter survey of 1,000 urban Filipinos, 55 per cent of respondents said they had a “secure” or “very secure” job. The figure is in line with the average for the other ASEAN-5 economies included in the Economist survey. Although the majority enjoy job security, people looking for a new job are having a hard time. Forty per cent of our respondents said they found it difficult to get hired, while only 11 per cent said it was easy. Among job seekers, 34 per cent said they wanted a higher salary, while 28 per cent wanted career growth.
The survey corroborates government data showing that while unemployment is down, underemployment is high. The underemployment rate — defined as those wanting to work longer hours or get an additional job to earn more — rose to 17 per cent in April, from 16.1 per cent the year before.
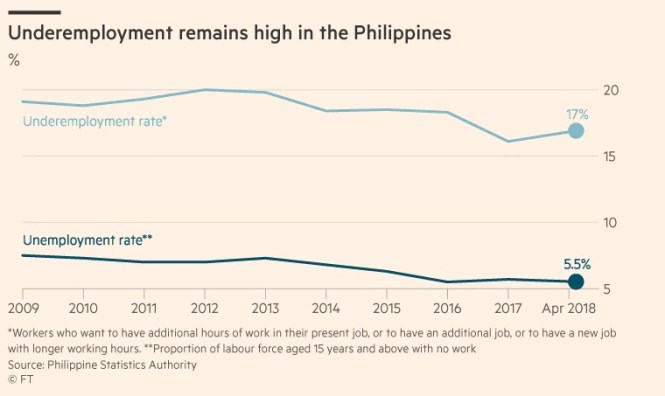
The Economist sees underemployment as a more formidable challenge than unemployment. In the public sector, Mr. Duterte’s promise to spend up to 8.44tn pesos ($158bn) to fix the country’s dilapidated infrastructure is producing low-paid, temporary construction jobs, incapable of sustaining a typical Filipino family. Private companies, meanwhile, are bracing for wage rises this year that could increase labour costs. This, in turn, is making the Philippines unattractive to private investors, who are critical to the creation of competitive jobs.
Low pay, temporary work
The government’s ambitious “Build, Build, Build” programme aims to generate 6.4m jobs by 2022, mostly by employing low-skilled workers in construction. We think the programme is a good way to absorb poor rural agricultural workers into higher-paying jobs, especially since some of the projects are in regions outside Metro Manila.

This is all part of Mr. Duterte’s plan to spread wealth beyond Manila. But while the infrastructure push will indeed reduce unemployment, it is unlikely to offer the competitive salaries and permanent positions available in the private sector, or overseas. In fact, government data show that 96 per cent of current vacancies would pay only a minimum wage, below the amount needed for a decent living. In Manila, the minimum wage amounts to 15,360 pesos a month, but wages in poorer areas tend to be lower and fall near the 2015 poverty line of 9,064 pesos. Although there is no official definition, Ernesto Pernia, the socio-economic planning secretary, recently said that a “decent income” for a family of five would be at least 42,000 pesos a month. This is achievable if two family members are earning 21,000 pesos each, near the average entry-level salary in the booming business process outsourcing industry. Construction jobs are also temporary. Since none of the 75 big-ticket infrastructure projects are under way yet, government contractors concentrate on smaller projects that require fewer workers and are completed in a shorter time. Some bigger projects funded by China are also likely to employ Chinese workers, leaving fewer opportunities for Filipinos. The lack of job security and decent pay make local construction jobs unattractive compared with employment overseas. There is no incentive for skilled Filipino engineers and architects currently working abroad to heed Mr. Duterte’s call to come home and contribute to his nation-building project. This could partly explain why construction jobs remain open, and state projects delayed.
Tough times all round
Poverty also affects households with permanent jobs. The World Bank, in a recent report on the Philippines, found that 54 per cent of poor households are headed by wage earners (as opposed to those who are self-employed). These include university graduates who work for private companies that typically pay more than the government.
Businesses are also operating in a more difficult environment. Accelerating consumer prices and a weaker peso, which hit a 12-year-low against the dollar this month, are increasing operational costs. Central bank data show fewer companies are planning to hire workers in the next quarter and we believe this will only get worse in succeeding months, especially as the government is pushing for a higher minimum wage. The minimum wage level in the Philippines in certain regions is already higher than in more developed Malaysia.
The private sector picture is not encouraging. Infrastructure projects have been delayed and the government plans to reduce tax incentives for investors under its proposed tax reform. As a result, foreign investment in the economic zones where these incentives are offered has fallen to its lowest level since 2010. Never mind tackling underemployment; even sustaining the recent drop in unemployment could be challenging. — Prinz Magtulis, Philippines Researcher,

Economic Snapshot for ASEAN
June 21, 2018
Economic momentum remains solid in Q2 after a positive Q1
The latest indicators suggest that ASEAN’s economy continues to perform well in the second quarter despite swirling global trade tensions, with growth forecast to come in at 5.2% year-on-year. With the exception of Malaysia, manufacturing PMIs for April and May were firmly in expansionary territory across the region, supported by strong domestic demand. In May, Indonesia’s PMI reached a near two-year high, while readings also improved in the Philippines and Vietnam. In Singapore, the indicator has moderated slightly so far in Q2 despite remaining firm, while in April Myanmar’s PMI reached its highest level in the survey’s history before a correction in May.
Other signs corroborate the ongoing momentum, with internal dynamics buttressed by strong labor markets and wage gains. In April, Indonesia saw healthy retail sales growth, while industrial production grew at a robust pace throughout the region. In contrast, the external sector appears to be softening. Import growth is outpacing export growth in many countries, on strong private consumption, higher international oil prices and tough prior-year comparisons for export growth.
The latest GDP readings for the first quarter confirmed regional growth at 5.4%. Comprehensive data for Singapore saw GDP growth revised up, on the back of an expansion in the services sector that was stronger than previously estimated. In addition, the figures point to a broadening of economic momentum towards more domestic-oriented sectors, as well as an incipient recovery in the construction sector. In Thailand, growth was clocked at 4.8% year-on-year in Q1, marking a five-year high and in line with FocusEconomics panelists’ forecasts. The reading was underpinned by higher farming and non-farming incomes, and a recovery in public investment.
On the political front, Malaysia reduced the Goods and Services Tax (GST)—an important source of revenue for the government—to 0% effective 1 June. This should give private consumption a shot in the arm in the short term, at least until a substitute Sales and Services Tax (SST) takes effect from September. However, the move creates fiscal uncertainty. Until the SST is introduced there will likely be a fiscal shortfall, despite the breathing space provided by higher oil prices. In addition, it is unclear whether, once introduced, the SST will raise as much revenue as the GST. To convince investors that it is serious about fiscal discipline, the new administration has moved to reduce infrastructure spending—including scrapping a planned high-speed rail link to Singapore—and trim ministries’ spending and the public sector wage bill.
Thailand is also trying to present a fiscally responsible image; the Junta recently presented a draft budget for FY 2019 aimed at reigning in the budget deficit. Proposed spending is slightly below the FY 2018 budget, although defense spending will receive a notable boost. In contrast, several areas important for future economic development will see spending cuts, including education, agriculture and social development.
See the full FocusEconomics Consensus Forecast ASEAN report
Economic outlook looks rosy, but trade concerns are rising
Economic growth should remain solid going forward, as the region continues to benefit from resilient domestic demand. Public infrastructure investment in key economies such as Indonesia and Philippines will support growth, while strong labor markets bode well for private consumption. On the downside, external sectors will likely continue to weaken, as export growth eases after a stellar performance in 2017 and higher crude prices raise the import bill. In addition, tighter financial conditions could weigh on activity, while a further escalation of trade tensions between the U.S. and China would hit the generally open economies of ASEAN hard, particularly given the importance of both countries as key export markets. GDP growth for the region is expected to come in at 5.2% this year, which is up 0.1 percentage points from last month’s estimate and matches last year’s expansion.
This month’s upgrade comes on the back of higher 2018 growth projections for Thailand—following a strong Q1 outturn—and the Philippines. In contrast, growth forecasts for the rest of the economies surveyed in the ASEAN region—including heavyweights Indonesia, Malaysia and Singapore—were unchanged from the prior month. For 2019, our panel sees growth at 5.1%.
Our panel projects that Myanmar will be the fastest-growing economy in the region, with a 7.1% increase expected in 2018. Conversely, Brunei is foreseen logging the weakest expansion this year, at 1.4%. Among the major economies in the region, the Philippines will record the fastest increase, followed by Indonesia and Malaysia.
INDONESIA | Economic growth appears firm in the second quarter
The most recent indicators from Q2 suggest that economic activity is picking up from Q1’s muted performance. Retail sales growth accelerated to a ten-month high in April and should remain elevated, as consumer confidence in May improved markedly. The manufacturing PMI increased in May to the best print in almost two years, underscoring the improving health of the sector. Against this positive backdrop in the domestic economy, S&P Global Ratings affirmed the country’s BBB- rating and stable outlook on 31 May. The ratings agency applauded the government’s prudent handling of fiscal accounts and the recent reform that has increased tax collection. Nevertheless, it warned that increasing external financing costs because of faster-than-expected monetary tightening in the United States and modest increases in the prices of Indonesian key exports could cause external buffers to deteriorate and expose the country to economic shocks.
The economy is expected to accelerate slightly compared to last year on faster growth in government consumption and fixed investment. Higher crude oil prices and a modest price outlook for Indonesian commodities, however, are weighing down growth prospects. FocusEconomics panelists see GDP growth of 5.3% in 2018, which is unchanged from last month’s forecast. In 2019, the economy is seen growing 5.4%.
THAILAND | Growth hits a multi-year high in Q1, data for Q2 suggests continuing momentum
National accounts data showed the economy continued to enjoy a strong run in the first quarter, growing at the quickest pace in five years. This was largely due to strong activity in the domestic economy as private consumption benefitted from an increase in non-farming income. In addition, the external sector remained solid despite a moderation in export growth and a pick-up in import growth on the back of a strong domestic economy. Data for Q2 continues to suggest that the domestic economy is gaining traction, while the external sector is softening slightly. In April, manufacturing growth accelerated, while the country recorded its second trade deficit of the year, owing to strong import growth outpacing double-digit export growth.
Although growth is expected to moderate in the coming quarters, economic growth should remain robust this year due to healthy domestic demand. Export growth is, however, likely to ease due to a large base effect. Looking to 2019, a tight fiscal stance as outlined in the recent draft budget could drag on growth. Risks to the outlook stem from rising trade tensions, mostly coming out of the United States. Furthermore, high household indebtedness and political uncertainty in the lead up to elections to be held no later than February 2019 could drag on economic prospects. FocusEconomics panelists expect the economy to grow 4.2% in 2018, which is up 0.3 percentage points from last month’s forecast. The panel projects growth of 3.8% in 2019.
See the full FocusEconomics Consensus Forecast ASEAN report
MALAYSIA | Economic signs are positive, although fiscal concerns emerge following tax change
Following a robust Q1, the economy appears to have gotten off to a solid start to Q2: Exports jumped and industrial production growth accelerated in April. On the downside, the manufacturing PMI moved further south of the neutral 50-point threshold in May due to weakening domestic demand. The new government reduced the Goods and Services Tax (GST) to 0% effective 1 June. This should provide a boost to private consumption in the short term until the Sales and Services Tax (SST) is introduced on 1 September. However, slashing the GST creates a sizable gap in the budget, raising questions about the government’s finances and whether it will be able to stick to the 2.8% deficit target for 2018. To rein in spending, Prime Minister Mahathir Bin Mohamad has cancelled big infrastructure projects and told ministers to implement austerity measures.
GDP should remain resilient this year on the back of strong private consumption growth, although government consumption is likely to suffer in the near term from the cancellation of previously approved projects and expenditure cuts. Risks are, however, titled to the downside: High household debt servicing costs could drag on private consumption, while uncertainty over government policy and the fiscal situation could dent private sector activity and investment. FocusEconomics Consensus Forecast panelists expect the economy to grow 5.3% this year, unchanged from last month’s forecast, and 5.0% in 2019.
MONETARY SECTOR | Inflation picks up marginally in May
A preliminary estimate by FocusEconomics shows regional inflation accelerated to 2.6% in May from 2.5% in April, on the back of stronger inflation in Laos, the Philippines, Thailand and Vietnam. Price pressures dipped in Indonesia and are still outstanding for the remaining countries in the region. In an unscheduled meeting on 30 May, Indonesia’s Central Bank raised its policy rate from 4.50% to 4.75%, mere weeks after a similar rate hike to 4.50%. The move was designed to support the depreciating currency, particularly given the prospect of the Federal Reserve raising interest rates in mid-June.
Inflation will be supported this year by higher global oil prices and solid domestic activity, although price pressures will remain relatively muted. Our panelists expect inflation to average 2.9% this year, which is unchanged from last month’s estimate and marginally above the 2.8% inflation figure recorded for 2017. Our panel foresees inflation ticking up and averaging 3.1% in 2019.
For more information -please visit this website https://www.focus-economics.com/regions/asean . Reports available for purchase…
Oliver Reynolds
Economist


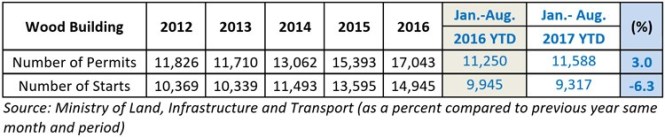


 Determined to counter the U.S. military buildup on its doorstep, China will work to amass its own forces along the North Korean border. Pyongyang will also keep shoring up its defenses as it continues to test devices in accordance with its technical needs and in response to U.S. actions. Such tests may include firing ICBMs (perhaps even several at a time) to prove North Korea’s ability to overwhelm nearby missile defense systems.
 Beijing, however, will have to hedge against the significant risks associated with the reforms. They include threats to corporate solvency and a slowdown in the all-important real estate market on which China’s heavy industries and construction sector depend. Underpinning these problems are the long-term risks that the country’s considerable debt presents to the Chinese economy, which will only become more fragile over time if it is not paid off. And though Beijing has the resources and fiscal tools with which to contain the danger of widespread default, relying on them will only exacerbate the government’s debt problems in 2018 and beyond.
 All the while, the United States will continue to hassle Asian exporters — particularly South Korea and China — to change their trade policies. Though Washington will not take any concrete steps to revamp the United States-Korea Free Trade Agreement in the coming quarter, Seoul suspects that it will eventually, regardless of how much South Korea cooperates with U.S. attempts to rein in North Korea. Seoul will likely try to preempt any punitive measures against the South Korean electronics and automotive industries by agreeing to some concessions in its trade arrangement with Washington.
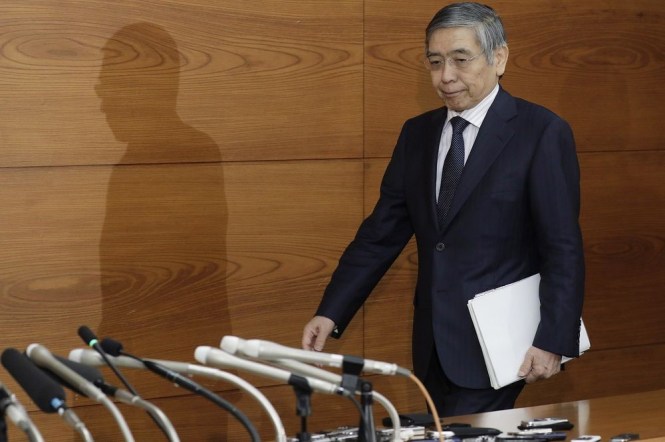 Haruhiko KurodaPhotographer: Kiyoshi Ota/Bloomberg
 Heizo Takenaka

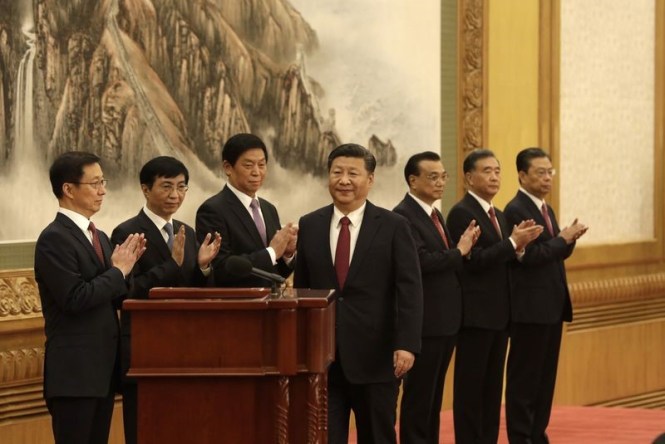 Photographer: Qilai Shen/Bloomberg
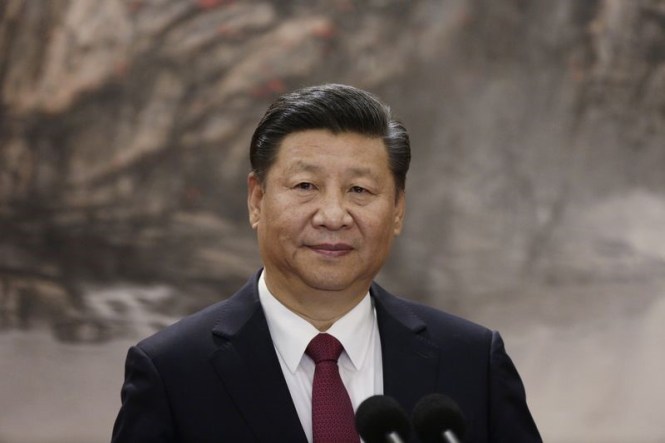 Photographer: Qilai Shen/Bloomberg
 Photographer: Qilai Shen/Bloomberg
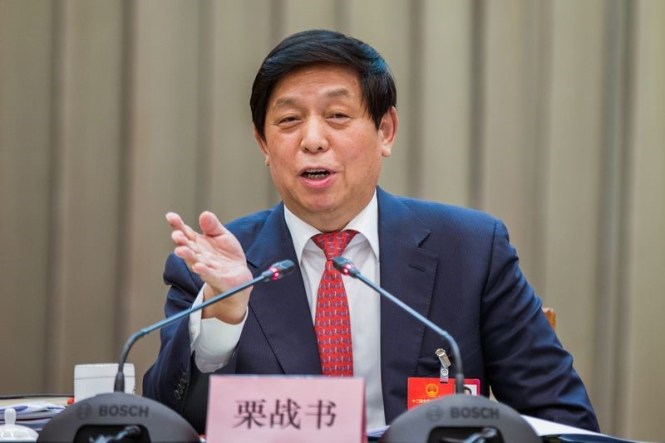 Source: Imaginechina
 Photographer: Andrew Harrer/Bloomberg
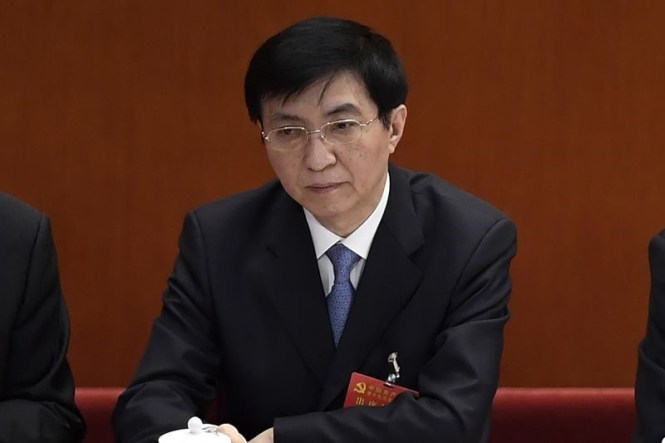 Photographer: Andrew Harrer/Bloomberg
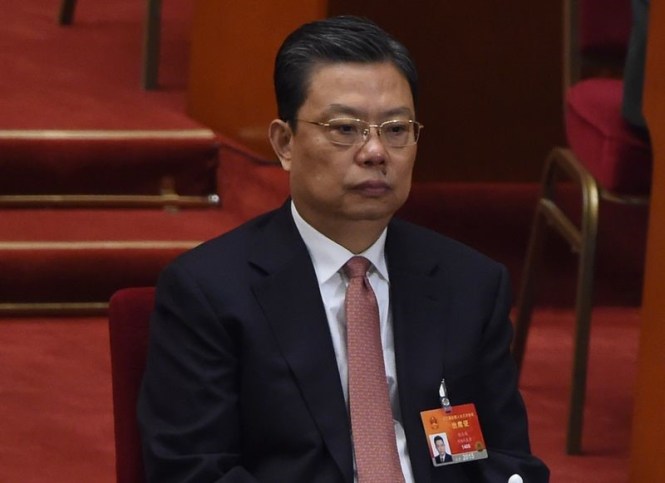 Photographer: Wang Zhao/AFP via Getty Images
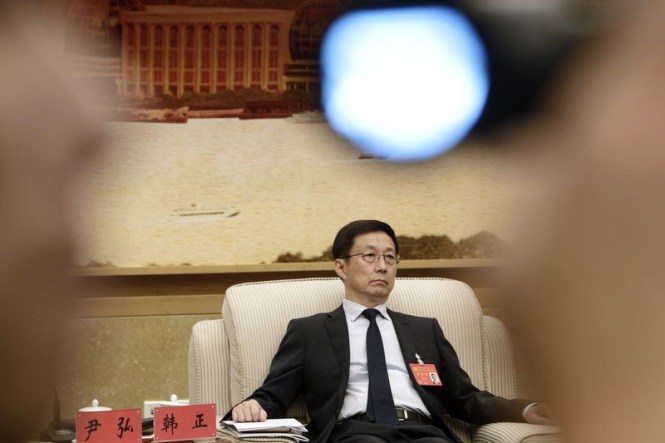 Photographer: Qilai Shen/BloombergHan Zheng’s ascension from Shanghai to the Standing Committee is all the more remarkable after the shocking 2006


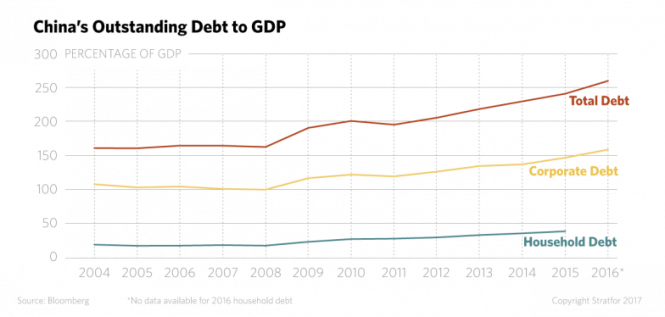

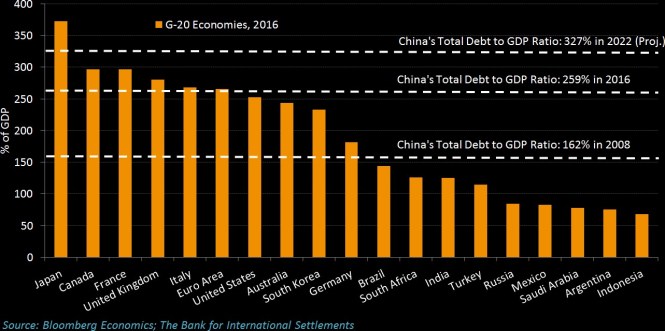


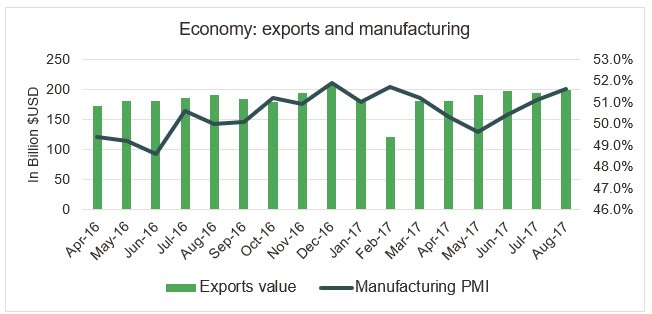


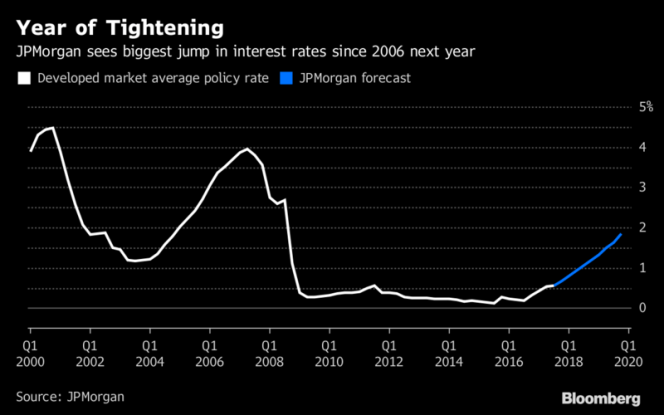
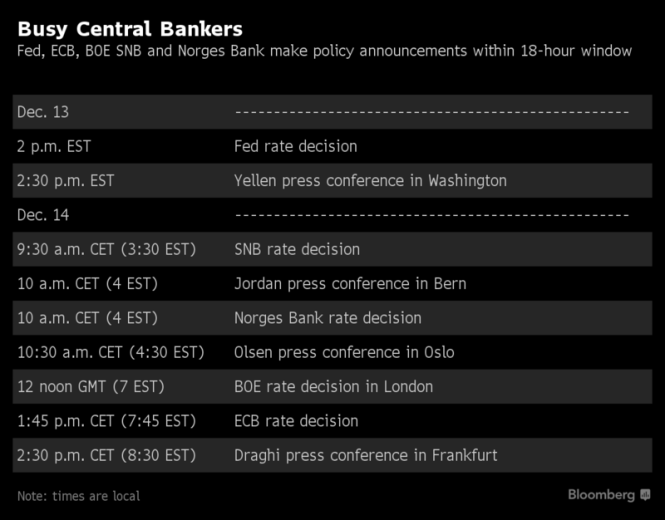


/arc-anglerfish-tgam-prod-tgam.s3.amazonaws.com/public/FNRH7HTXZBHOBH5TT7Z2IJOT6E.jpg)
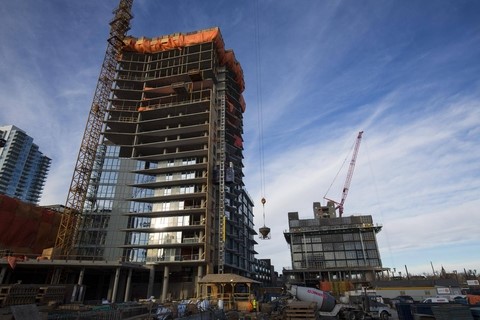


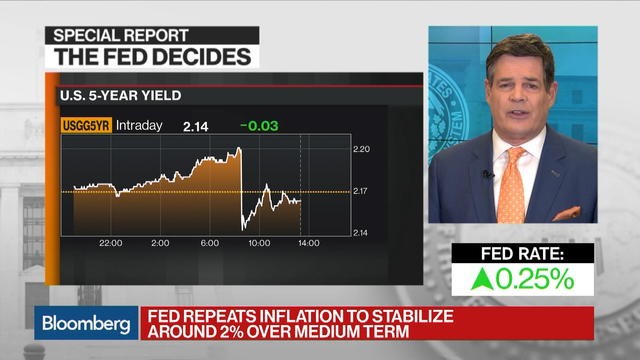


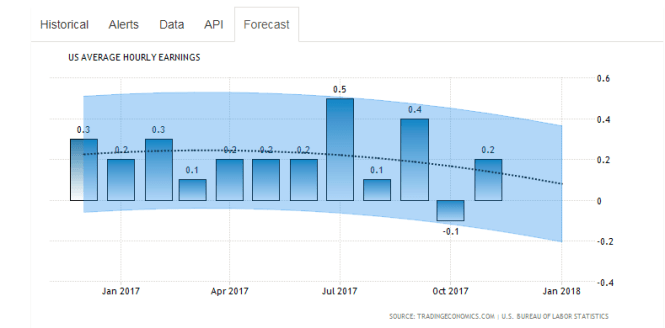


 Svenja Gudell , Contributor


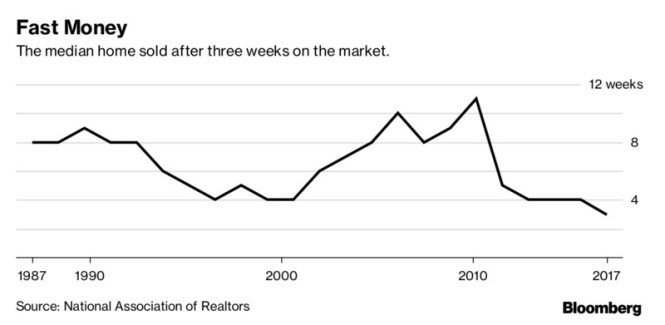
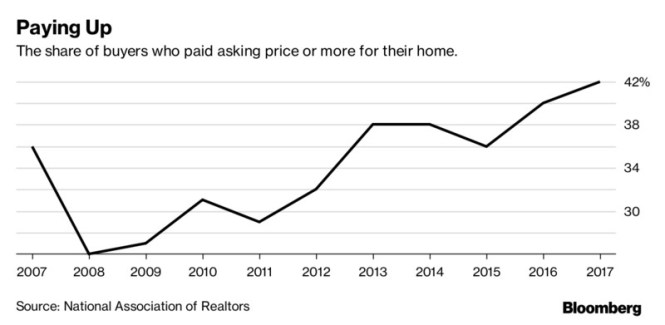
 Sep 2, 2017 | 12:57 GMT


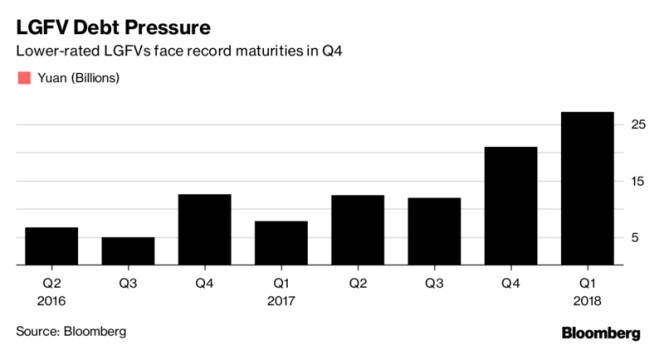


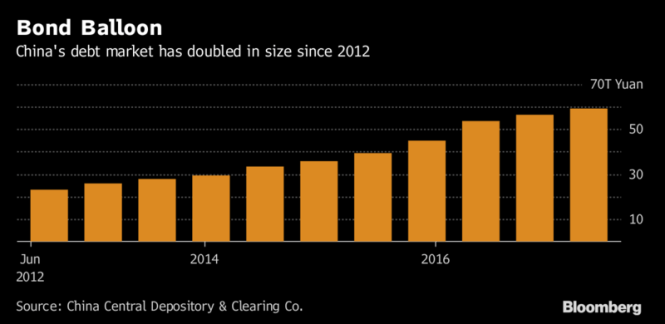


 On August 25th 2017, Canada Wood China (CW China) signed a strategic cooperation MOU with Sichuan Guodong Construction Holding Co., Ltd (Sichuan Guodong) on “jointly promote the applications of Canadian qualified lumber on furniture markets in China” in Chengdu. Eric Wong, managing director of CW China and Mr. Xie Suming, general manager of Sichuan Guodong signed the MOU on behalf of each side.
 There are five furniture industry bases generated in China, after years of development in furniture industry. They are:
 We visited a CLT plant in Ningbo, Zhejiang Province on August 31st. This plant is the company’s first pilot plant – Ningbo Sino-Canada Low-Carbon Technology Research Institute Co., Ltd. whose CTO used to be a senior scientist at FPInnovations – Dr. Brad J. Wang.
 Canada Wood China participated in 23rd China International Furniture Expo, the most leading furniture tradeshow in China, from September 12th to 15th. The 4-day tradeshow was held in Shanghai New International Expo Centre, covering furniture industry chains ranging from materials, design to manufacturing.
 On September 22nd Canada Wood visited the new Selco Home non-residential demonstration office project in Sendai with Catriona Armstrong of NRCan and Joyce Wagenaar of FII. Selco Home opened The “City Forest” 3 storey demonstration office in August to show prospective clients the beauty and performance of wood in commercial, non-residential uses.
 Elder care service provider Esprit, continues to expand with 2×4. They are now constructing their fourth 2×4 senior’s facility in Kyushu region of Japan, this time in Arai City in Kagoshima Prefecture, slated for completion later in the year. When finished, the new private nursing home will house 64 seniors as well as one large room, which will be used to provide day-service care for local seniors living nearby. As with its three previous senior’s homes, Esprit chose again to build this one with platform frame construction for several reasons; lower initial building cost, quicker construction time, superior thermal insulation – allowing building to use less heating and cooling energy to achieve and maintain a comfortable temperature for occupants, as well as a better depreciation rate for the building (compared to non-wood construction methods). The facility, a combined one and two-storey quasi-fireproof 2×4 building will have a total floor area of 2,425 m² and just about all the structural wood products used for its construction, Douglas Fir dimension lumber and OSB panels, were supplied by Canadian companies.
  The National Institute of Forest Science performed a seismic test on the Midply Shearwall System on July 28. For the test, a Midply Shearwall bearing wall was constructed and vibration was applied at a vertical load of 3.7 tons in order to examine and study the seismic performance of the structure. The outcomes of the studies on this test may help the revision of the seismic design criteria for wood frame construction in the future.
 The Advanced Technology Construction Training in Canada in its 13rd year was planned and delivered successfully from July 4 and July 14, 2017 in collaboration with the Super-E® Office/Energy Efficient Exporters Alliance (EEEA), the University of the Fraser Valley (UFV) and Canada Wood Korea at the UFV’s Chilliwack Campus.
 A joint public-private project is bringing in a new wind in the low-story housing market. While it is normal in the rural housing market to only develop the land and sell the land first, where the contractor would then construct the house as they wish after signing a contract for the land, this project made an exception and constructed single family houses first and sold them afterwards. Also, some houses are constructed as energy independent houses based on so-called “semi-passive” technology.
 On July 12, 2017, the Energy Efficient Exporters Alliance (EEEA) and Gyeonggi Urban Innovation Corporation (GICO) and Dreamsite Korea (DSK) signed an MOU for technical, training and marketing supports for construction of 13 Super-E® and Net-Zero Energy houses to be built as part of on-going 154 unit wood frame housing complex development in Korea, Bukhangang Dongyeonjae, the Canada Village project.