

CANADA
Metropolitan Resale Snapshot: November 2017
Another Month of Varied Results in October
by Robin Wiebe
Short-Term Year-Over-Year MLS Price Change Expectations
About the Metro Resale Snapshot
Sales remained mixed in October, with transactions falling in 13 of our 28 areas (Sudbury data remain unavailable). Most declines were small; only three markets posted a loss of 5 per cent or more. Southern Ontario markets are still well off their 2016 levels, thanks to the province’s Fair Housing Plan, but sales in Toronto and Hamilton edged up on the month. Volumes in Vancouver and the Fraser Valley are rebounding from B.C.’s foreign buyers tax. Saskatoon’s sales jumped, but sales in other Prairie cities were soft. Volumes rose in four of six Quebec areas.
Listings fell between September and October in 17 markets and hovered below year-earlier levels in 14 areas. London saw last month’s largest decline. Listings either declined or were flat in the Golden Horseshoe last month and were down in Vancouver, the Fraser Valley, Calgary, and Edmonton. Listings generally fell in Quebec and Atlantic cities.
The sales-to-listings ratio was on the rise in October, rising in 17 areas and exceeding year-earlier levels in 15 markets. Balance prevails in 20 markets, including Toronto, Vancouver, and Montréal. Oshawa is a buyers’ market (as are Regina and Saskatoon), but the rest of the Golden Horseshoe is balanced. All markets east of Ottawa are also balanced. The Fraser Valley, London, Windsor, and Kingston are enjoying sellers’ markets.
Monthly price changes were evenly divided between advancers and decliners in October. Saguenay and Thunder Bay saw healthy jumps, while Regina saw a significant loss. Values advanced in Montréal, Toronto, and Vancouver. Calgary’s price appears to have stabilized, but pricing in the Golden Horseshoe continues to be uneven. Saint John and Newfoundland and Labrador saw prices ease.
Short-Term Year-Over-Year Price Change Expectations
| +7% | Vancouver, Fraser Valley, St. Catharines, Kitchener, London, Windsor | |
| 5–6.9% | Victoria, Thunder Bay, Kingston, Ottawa, Montréal | |
| 3–4.9% | Edmonton, Winnipeg, Toronto, Oshawa, Hamilton, Gatineau | |
| 0–2.9% | Calgary, Regina, Sudbury, Québec City, Trois-Rivières, Sherbrooke, Saguenay, Saint John, Halifax, Newfoundland and Labrador | |
| Falling | Saskatoon |


1 For real estate board area (except Newfoundland, which is province-wide).
2 Italics indicate per cent change. The second row shows the percentage change from the previous month; the third row from the year earlier.
3 Within one standard deviation of long-term average sales-to-new-listings ratio.
4 Includes Abbotsford.
Note: All data are seasonally adjusted.
Sources: The Conference Board of Canada; Canadian Real Estate Association; Quebec Federation of Real Estate Boards.
About the Metro Resale Snapshot
The monthly Metro Resale Snapshot provides an overview of the existing home market for 28 areas and expectations for existing home price growth over the short term.
/arc-anglerfish-tgam-prod-tgam.s3.amazonaws.com/public/FNRH7HTXZBHOBH5TT7Z2IJOT6E.jpg)
Disclaimer: Forecasts and research often involve numerous assumptions and data sources, and are subject to inherent risks and uncertainties. This information is not intended as specific investment, accounting, legal, or tax advice.
During boom times, when there is plenty of business to go around, misconduct by real estate agents tends to be less serious, a RECO spokesman says.
MARK BLINCH/REUTERS
Janet McFarland
REAL ESTATE REPORTER
Tougher mortgage stress-testing rules could make it impossible for 40,000 to 50,000 Canadians to buy a home each year, driving down real estate sales and reducing the anticipated pace of new mortgage-lending growth, according to a new analysis.
A report by Mortgage Professionals Canada, a national mortgage-broker industry association, forecasts about 18 per cent of home buyers – or about 100,000 people a year – would not qualify for their preferred home purchase option under new rules announced in October by Canada’s banking regulator, the Office of the Superintendent of Financial Institutions.
Websites publishing Toronto home sales data quick to spring up after federal court ruling
Mortgage Professionals Canada chief economist Will Dunning, who wrote the report released Tuesday, estimates 50 per cent to 60 per cent of those not qualifying will be able to adjust their expectations and buy a cheaper home, but he anticipates the other 40 per cent to 50 per cent will likely not buy anything because the adjustments they have to make would price them out of the market.
It will leave about 40,000 to 50,000 potential buyers a year shut out of the market, which means a 6-per-cent to 7.5-per-cent drop next year in home sales, including sales of both new and resale homes, he said.
He added that rising interest rates are expected to have a similar level of impact on home buyers next year, on top of the stress-test rule impact.
“Between the two – the policy effect and the interest-rate effect – we’re looking at somewhere between 12-per-cent and 15-per-cent less sales next year than we saw in 2016,” Mr. Dunning said in an interview.
The stress-testing rules, which will take effect Jan. 1, will require borrowers who are making a down payment of more than 20 per cent of a home’s value to prove they could still afford their mortgage payments if interest rates were significantly higher. The OSFI rule change will require borrowers to qualify for mortgages at the greater of the Bank of Canada’s five-year benchmark rate or an interest rate two percentage points higher than they negotiated.
Mr. Dunning said federal regulators have introduced six prior policy changes since 2010 impacting mortgage eligibility in Canada, but until now, only the package of changes in 2012 – which reduced maximum amortizations to 25 years from 30 years – had a substantial impact on home sales.
“It appears that this new policy change is also likely to have substantive and prolonged consequences,” the study concludes.
While home sales are expected to fall, the report forecasts 5.5-per-cent growth in the amount of outstanding mortgage credit in 2018, which is a reduction from 5.9-per-cent growth in 2017 and the prior 12-year average growth rate of 7.3 per cent.
Mr. Dunning said mortgage borrowing is expected to grow despite his forecast of falling sales, largely because there are so many new homes under construction that have already been started and have buyers scheduled to take possession next year.
“There have been a lot of housing starts lately and those are going to be completed next year, so that’s going to require a lot of new mortgages on those newly completed dwellings,” he said. “That’s what’s holding it up. If you look further out, there’s going to be a further drop off in credit growth in 2019 and 2020.”
Many analysts have predicted buyers will have to reduce their target prices by 20 per cent under the new stress-testing rules, but the report said those estimates ignore the fact that most people borrow much less than the amount their banks qualify them to borrow, so have leeway to adjust.
Based on data from a survey the mortgage association conducted in the spring – asking potential home buyers their target purchase prices, their down payments and their borrowing rates – Mr. Dunning predicts average home buyers would need to reduce their target prices by just 6.8 per cent or by $31,000 under the new rules.
Follow Janet McFarland on Twitter @JMcFarlandGlobe
As Alberta rebounds, massive inventory of unsold condos raises concerns
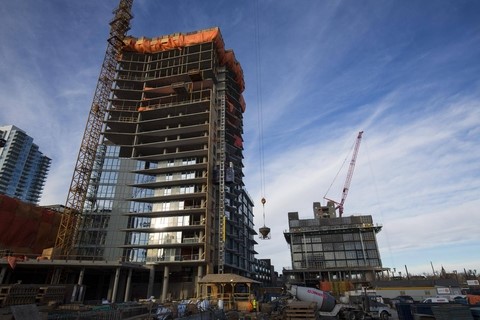
New condos under construction in Calgary on Nov. 30, 2017.
Todd Korol/The Globe and Mail
KELLY CRYDERMAN CALGARY
Published December 1, 2017 Updated December 4, 2017
Alberta’s economy is slowly emerging out of a deep hole, but there are lingering worries about a massive inventory of condominiums available for sale.
While it could be a buying opportunity for someone who wants to get into the market as the province’s fortunes improve, the sizable inventory could just as easily drive down prices. New condo projects and purpose-built rental apartments planned when oil was riding high are now hitting the market, even as the vacancy rates in both Edmonton and Calgary remain high, and employment and migration remain weak.
The number of new housing units sitting unsold in Alberta this year is striking. The figure soared above 4,000 in early 2017, and peaked at a record 4,447 in July. In October, it still sat at 4,161, according to Canada Mortgage and Housing Corp. That is about double the unsold units in British Columbia (2,105) and much higher than Ontario (2,580) – both provinces with much higher populations, but where there are more robust economies and hot housing markets.
Story continues below advertisement
Related: Critics paint ‘bleaker picture’ amid Alberta’s jobs optimism
Looking at it another way, nearly 30 per cent of Canada’s 14,204 built-but-unsold housing units are in Alberta.
“In a cyclical market like Alberta, if you are building that much inventory and you go through an economic cycle, you will end up with unsold inventory,” said Matthew Boukall, a senior director at Altus Group Ltd. real estate data group.
“That’s kind of where we’re at today.”
More than 45 per cent of the empty housing units in the province are apartment-style condos, mostly in Edmonton and Calgary. In Calgary, the province’s largest city, the new condo units for sale are being added to an increasingly large inventory of resale apartment condos – a number now sitting at more than 1,600.
Lurking in the background are the debt obligations carried by developers who could be pressured to sell for lower prices in the months ahead, and the possibility of more units coming on the market from individual condo owners who bought when prices were high and want to sell their properties as soon as there is a slight improvement in the market. Shamon Kureshi, chief executive of Hope Street Management Corp. – one of Calgary’s largest property management firms – describes the condo owners who are now renting when they would rather get their money out “accidental landlords.”
Economists and market watchers have been surprised at how resilient the overall housing market has stayed through the province’s economic downturn that began three years ago. The Teranet-National Bank National Composite House Price Index shows Calgary’s overall prices are down 2.85 per cent from a peak in October, 2014 – significant but not calamitous.
But the city’s condo prices have been harder hit. According to Ann-Marie Lurie, chief economist for the Calgary Real Estate Board (CREB), its benchmark apartment-style condo price is still well below the September, 2007, high of $297,600 – a time that saw the oil price trending upwards – and the October, 2014, high of $300,000 – when oil prices had started a multi-month decline. The benchmark Calgary condo price in October was $261,600, and CREB expects that figure will drop another 3 per cent by the end of 2017.
Alberta, like other provinces, is seeing a major shift from single-family to multi-family housing construction as land prices surge. While it takes two years or more to build a high-rise, economic fundamentals can shift drastically in that period. That time lag between deciding on a multi-family project, and completion, doesn’t always work with the cyclical nature of Alberta’s oil and gas-focused economy. Condo projects planned and started when oil was $100 (U.S.) per barrel have many units sitting empty today, as crude prices nudge up from the lows of 2015 and 2016 toward $60 per barrel.
Alberta’s economy is improving, with ATB Financial forecasting GDP growth of 3.9 per cent in 2017, to be followed by growth of about 2.7 per cent in 2018. However, employment remains a major issue. In the same way that many of Calgary’s downtown offices are sitting empty, many of the residential condos in the inner city are also unoccupied. “Continued high vacancy rates in the downtown core is an indication that near-term recovery of higher-paid energy sector jobs is not expected,” said a recent CREB report.
Mr. Boukall said many of the jobs that are coming back are not coming to downtown Calgary – and instead are service or industrial jobs further out from the core. For condos in Calgary, he expects flat pricing in the suburban market in 2018 and, in the inner city, a price decline of less than 5 per cent.
He notes two key risks to the condo market recovery: The tightening of mortgage stress-test rules to take effect across Canada on Jan. 1, and the high levels of inventory and slow sales making it difficult for developers to keep their businesses afloat or to service debt.
Already, well-known Alberta builder and property developer ReidBuilt Homes, which had been in business for more than 35 years, collapsed into insolvency this year. Receiver Alvarez & Marsal Canada Inc. this month pointed to sluggish sales, downward pressure on prices and “an unsustainable debt load and leverage” as reasons for the private firm’s downfall.
Some developers have taken to renting out completed but unsold units – Lamb Development Corp. is offering realtors a 50 per cent cut of a month’s rent if they find a tenant for its newly built 230-unit 6th and Tenth building in Calgary’s Belt line.
Lai Sing Louie, a regional economist for CMHC, said multi-family construction is going to slow down next year so some of the inventory can be absorbed. However, he believes “one shadow component of supply” in Calgary are the people who bought a condo during a boom period, at one of the price highs, and are still trying to recoup their investment.
“People who bought in that sort of frenzied period are still likely under water,” Mr. Louie said.
Mr. Louie’s assessment squares with the experience of Farhan Qureshi. A decade ago, when Calgary’s economy was booming, the engineer took possession of his two-bedroom, two-bathroom unit with a wrap-around balcony high above the Stampede grounds.
Mr. Qureshi believed the $350,000 preconstruction price – an amount paid in 2005, “when people were basically bidding against each other” – would be a solid investment, and eventually the condo would be good place for him and his wife to live when their children moved out.
Now, forced into a retirement earlier than he would have liked by Alberta’s economic slump, the condo doesn’t work as a home for Mr. Qureshi, 65, and his wife. The unit has occasionally sat empty for a couple of months, but he now has a tenant with a six-month lease. He still can’t charge a rent that covers all his monthly costs, and the $600 per month in condo fees feels like a weight. “I have chewed up all my savings.”
Mr. Qureshi listed the condo for sale about 18 months ago at $480,000, but he couldn’t get an offer he liked and took it off the market. This month, he listed the condo again, at just less than $400,000.
“I just want to get it over with so I can pay off the mortgage,” Mr. Qureshi said. “I don’t want to be a landlord.”

Highlights taken from https://www.cmhc-schl.gc.ca/odpub/esub/61500
After the boost in residential construction for 2017, housing starts are projected to decline by 2019. Sales of existing homes are expected to decline relative to the record level of above 535,000 MLS® sales registered in 2016. The average MLS® price should increase over the forecast horizon, but at a slower rate than in the past four years. The average price should lie between $493,900 and $511,300 in 2017 and between $499,400 and $524,500 by 2019. Trends Impacting the Housing Sector Before turning to the detailed forecast, this section reviews key assumptions of the housing market at the national level. These drivers are the central building blocks for CMHC’s framework to produce the Housing Market Outlook.


Growth in GDP to slow by 2019 after stronger-than-expected growth in 2017 Based on the average of private sector forecasts, our baseline forecast scenario assumes that Canada’s real GDP growth will range between 2.4% and 3.2% in 2017 and between 1.2% and 2.5% in 2018. The strong growth in 2017 was due to accommodative fiscal and monetary policies, households’ wealth and income gains. It is expected that growth in Canada’s economy will slow by 2019 due to an increase in interest rates, reduced contribution from households’ consumption and weaker boost from fiscal policy. However, the expected acceleration in business investment and foreign demand will mitigate some of these negative pressures on real GDP growth. In 2019, GDP growth is forecast to lie between 1.0% and 2.4% for Canada.
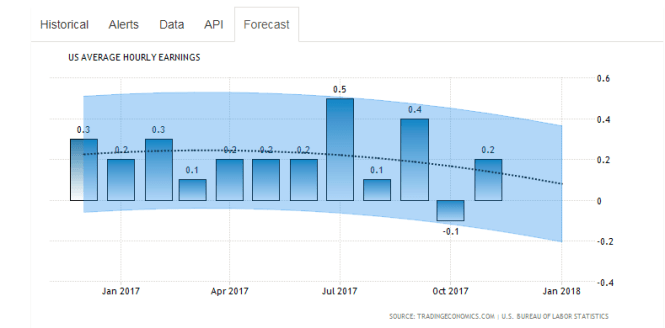
Trends in the labour market improving over the forecast horizon. In the past year and up to this summer, growth in employment has been positive for both full-time and part-time employment, but part-time employment growth was stronger than full-time employment growth. Part-time work is usually said to provide less support to housing markets. Even as the number of jobs increased, the number of actual hours worked declined, contributing to less support for housing markets. In terms of wages, the average real weekly earnings declined in 2017 compared to 2016 on a national level. For the forecast horizon however, labour market conditions are expected to improve. According to the private-sector forecasts, the overall Canadian unemployment rate is expected to decline to 6.5% in 2017 and 6.4% in 2018 (compared to 7.0% in 2016). In addition, hourly earnings are forecast to grow faster (at 2.7% and 3.5% year-over-year) than consumer prices (at 1.9% and 2.2% year-over-year) in 2017 and in 2018 respectively, increasing households’ purchasing power. Our projections for average weekly earnings are growth rates of 1.0% this year and 1.9% in 2018 and in 2019, providing more support for housing demand.
Strong net migration from 2016 will continue to support demand for new dwellings in 2017. The historically high growth in net migration in 2016 continues to support demand for new homes for all housing types. Net migration increased by roughly 60% from 2015 to 2016, setting a close-to record number of new immigrants to the country. This number will likely be closer to the average of the last ten years by the end of the forecast horizon.
Mortgage rates are expected to rise gradually over the forecast horizon Mortgage rates are expected to rise modestly over the period 2017-2019. This increase is consistent with the expected improvement in domestic economic conditions and the predicted increase in world interest rates. In our baseline scenario, the posted 5-year mortgage rate is expected to lie within the 4.9%-5.7% range in 2018 and within the 5.2%-6.2% range in 2019. Hence, the expected increase in this rate over 2017-2019 should be at most 160 basis points. Over our forecast horizon, mortgage rates are expected to stay below levels observed prior to the Great Recession.
Detailed National Housing Outlook Strong housing starts to level off by 2019 National housing starts will register more than 200,000 starts for 2017 – a boost compared to last year. The inner range for 2017 is estimated to be 206,300 – 214,900 units for the year. However, by the end of 2019, the total number of starts should decline compared to 2017. The inventory of completed and unsold units in Canada has been driven by the multi-unit segment since the early 2000s, and still represents about 60% of all the inventories of completed and unsold units. The inventory of total completed and unsold dwellings per 10,000 population was 4.2 units in the second quarter of 2017, its lowest level in 6 years. This trend suggests that inventory management is adjusting to market conditions, hence putting upward pressure on starts for the short-term.
The growth in population and near-record growth in immigration will continue to have a positive effect on housing starts over the forecast horizon. Employment growth should stay positive and provide support to new housing market activity, but this effect should even out by the end of 2019. We project starts to decline in 2018 and 2019 compared to 2017 as there will be less simulative economic conditions and gradually increasing mortgage rates. As a result, residential construction is projected to level off by the end of 2019, but still represents an upward revision compared to our previous forecast. Housing starts are to range from 192,200 to 203,000 units in 2018 and from 192,300 to 203,800 units in 2019. Single-detached starts are forecast to contract by 2019
Single-detached starts are forecast to contract by 2019 Single starts have been increasing since the first quarter of 2016. This was partly explained by stronger demand for those types of units, as there were continued low inventories of new and unsold single detached homes, especially in some of the major housing markets in Canada, encouraging single-detached starts in the short-term. Single starts are forecast to range between 75,900 units and 77,100 units, compared to 74,100 units in 2016.
As more supply becomes available from this year’s strong construction, and households continue to opt for lower-priced alternatives in the multi-unit sector, we expect this recent boost to be short-lived and single-detached starts to range between 66,200 units and 68,400 units in 2018 and between 66,100 and 68,900 units for 2019.
Multi-unit starts to remain strong over the forecast horizon Multi-unit starts are expected to increase this year and level off by 2019, but remain above the historical average over the forecast horizon. The pool of potential first-time home buyers, people aged 25-34 years old, is expected to slow, negatively impacting the demand for multi-unit homes, but the demand due to increasing aging population will partly offset that areas are experiencing historically low apartment vacancy rates and low inventories of new and unsold multiple units. Combined with relatively low ownership cost compared to single-detached homes, this will create upward pressure on multi-unit starts. Accordingly, multi-unit starts are expected to increase in 2017, ranging between 128,800 and 139,400 before leveling off to 124,400-136,200 units and 123,200-137,800 units in 2018 and 2019 respectively. These represent increases compared to the level of 123,800 registered in 2016.
MLS® sales are forecast to decline this year and stabilize by the end of 2019 MLS® sales were at a record high in 2016 and are projected to lose momentum in 2017, before settling in 2018 and 2019 at levels that are more in line with the projected economic conditions. While there is evidence of overheating in the resale markets of many major CMAs, this has subsided in recent months as the supply of resale homes (listings) has increased relative to the demand (sales). The strong boost in international migration has provided support to sales in 2017, but this factor is expected to dissipate by 2019. Moreover, the projected gradual rise in mortgage rates by the end of the forecast horizon could restrain sales for existing homes. Therefore, MLS® sales are expected to be between 493,900 units and 511,400 units in 2017, between 485,600 units and 504,400 units in 2018, and between 484,700 and 509,900 in 2019.

Resale prices are expected to keep increasing, but at a slower pace than in previous years. In 2016, most of the strong growth in average prices came from a compositional effect: proportionately more sales of expensive single detached homes were pushing up the average price. As the sales of apartments in 2017 are increasing in share of total sales, there is downward pressure on the MLS® average price since apartment condominiums are usually a less expensive option than single detached homes. However, as the demand grows for apartment condominiums, this in turn pushes apartment prices upwards. Figure 4 shows the rising Apartment MLS® HPI (Home Price Index)while the single-detached MLS® HPI declined relative to the recent peak. The average MLS® price declined from the recent monthly peak of $536,000, but the average price for the year is still expected to increase compared to 2016 and to range between $493,900 and $511,300. For 2018 and 2019, the MLS® price is expected to range between $491,900 and $512,100 and between $499,400 and $524,500, respectively.

Risks to the Outlook and Scenarios
While the outlook for the Canadian housing sector is one of general stability, there are global and domestic risks to consider. The evolution of risks since our last forecast has been stable.
Global effects -from an international perspective
· Sluggish business investment in Canada may mean that Canadian firms do not have the productive capacity to respond to demand for exports. This would mostly impact export-dependent provinces.
· There could be a positive risk for housing market variables if real GDP growth in the USA, triggered by higher business confidence, leads to stronger U.S. economic growth, increasing Canada’s net exports, employment and real GDP.
Household Debt
· Recent levels of strong consumer confidence point to robust consumption. Higher consumption would mean a higher boost to GDP and to housing markets, but it would also increase vulnerability related to already high levels of debt in Canada. High household debt remains a risk for the Canadian economy, making households more vulnerable to an economic or interest rate shock.
· If interest rates or unemployment were to increase sharply and significantly, more heavily indebted households may need to liquidate some assets. This could include their homes, which would put downward pressure on housing market activity.
Overvaluation in property markets
· Fundamentals such as income and population growth are not catching up to the strong growth in house prices observed in most major markets such as Vancouver, Toronto and surrounding markets. This adds considerable uncertainty over how the housing market will adjust to these imbalances.
· A sharper and quicker-than-expected unwinding of imbalances between observed house prices and those that would be supported by underlying fundamentals could impact forecasts negatively, and result in outcomes in the lower part of the forecast range presented in figures 1, 2 and 3 above.
· To reflect these upside and downside risks to the economy and housing markets,
o The outer range for housing starts on a national level is from 190,100 to 231,100 in 2017, compared to 176,000 to 219,200 in 2018, and 175,600 to 220,400 in 2019.
o MLS® sales could range from 465,500 to 539,700 in 2017 before moving to a range of 455,000- 535,000 in 2018, and 452,500- 542,000 in 2019.
o The average MLS® price could range from $478,900 to $526,300 in 2017, from $477,000 to $527,000 in 2018 and from $482,300 to $541,600 in 2019.
Canada – Economic Forecasts – 2018-2020 Outlook USDOC Economic Trading
These pages have economic forecasts for Canada including a long-term outlook for the next decades, plus medium-term expectations for the next four quarters and short-term market predictions for the next release affecting the Canada economy. https://tradingeconomics.com/


UNITED STATES

ERA Forest Products Research
December 6, 2017
RESEARCH NOTE
Caution On Housing, Negative For Building Products ERA FOREST PRODUCTS RESEARCH December 6, 2017
info@ERA-research.com – 2 – Tel: (604) 886-5741

As the chart above shows, the growth rate in non-farm employment has been declining steadily for the past two years. Previous large declines in non-farm employment have typically coincided with sizeable reductions in housing starts (see 1973–75, 2005–09). There have been some exceptions, however (e.g., in 2000–02, the change in non-farm employment fell from roughly 280,000 to a loss of 160,000, but housing-start growth was largely uninterrupted and eventually eclipsed the 2MM mark — although this ended in tears). We have seen non-farm employment dip slightly and then reverse course without severely impacting starts (e.g.,1998–1999), but with little by way of positive policy changes currently in the pipeline, weakness in employment trends is increasingly worrying for the economy as a whole, and for housing as well.
This trend should temper some of the optimism running rife in the market presently. The Trump administration’s recently proposed tax cuts have been well received by Wall Street (although there are concerns that a cut to the home mortgage interest deduction could end up weakening house prices), offering further support to a year-end rally that will no doubt raise many observers’ expectations for 2018. However, economic growth in the U.S. is typically reliant on the quality and quantity of its workforce, and today there is a growing shortage of both skilled and unskilled labour. Some companies in our coverage universe have cited housing as their biggest concern heading into 2018, stressing that the lack of available labour (rather than demand for new housing) is the root cause of their concern. Government initiatives, like first-time home buyer grants and mortgage tax credits, are ineffective if there are no homes available for would-be buyers to buy! For housing starts to continue on the same slow-and-steady trajectory we have seen over the past six years (we forecast an increase of 5% to 1.27MM in 2018 and a further 6% to 1.35MM in 2019), more needs to be done to address the current labour shortage. NAFTA battles and wall-building won’t help.
This problem is not unique to the construction industry. Agriculture, manufacturing and transportation are all facing an urgent shortage of workers. October’s unemployment rate edged down ten basis points to 4.1% and most economists agree that the U.S. is beyond “full employment”. In many industries, wage increases have been unsuccessful in attracting and retaining quality labour — U.S. workers are largely unwilling or unable to do the grueling, “low paid” work required to transport produce and fill refrigerators across the country. In the case of recent rebuilds after the hurricanes in Houston and South Florida, sizeable wage increases haven’t been enough to attract the required number of residential construction workers, and efforts to get displaced residents back in their homes have been delayed. Given President Trump’s hardline stance on immigration (the Department of Homeland Security this week announced that non-criminal arrests of illegal immigrants were up 42% ytd) this problem is likely to get a whole lot worse before it gets any better.
Solid wood names would be first impacted by a slowdown in housing start
A slowdown in housing would primarily slow demand growth for lumber and panels, and thus would have more immediate negative consequences for TSX:OSB and NYSE:LPX as well as TSX:WFT, CFP, and IFP. Longer-term, timberland names NYSE:WY, RYN and Nasdaq:PCH would feel the effects of lower lumber production and the resultant reduction in timber demand. Many of our names are looking more than full-value right now, and once this Christmas rally has run its course and the realities of seasonal slowdowns in consumption and current housing and labour trends return to focus, we expect to see downward corrections. Lumber names have already started to come off this quarter, and we expect they still have some downside runway. Panel names have been a mixed bag of late, but again we see more downside than upside as 2017 draws to a close. The OSB industry, in particular, is more at risk than others given the 11% growth in capacity coming to the market next year. There will be a time to buy again, but not now.
– John Cooney
Fed Raises Rates, Eyes Three 2018 Hikes as Yellen Era Nears End
By
Christopher Condon
@chrisjcondonMore stories by Christopher Condon
and
Craig Torres
@ctorresreporterMore stories by Craig Torres
December 13, 2017 12:00 PM Updated on December 13, 2017 1:57 PM
Central bank expects labor market to ‘remain strong’
Kashkari, Evans dissent, preferring to leave rates unchanged
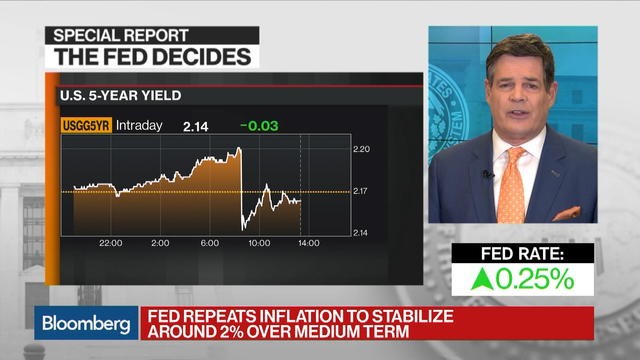
Bloomberg’s Mike McKee reports on the Fed’s rate hike.
Federal Reserve officials followed through on an expected interest-rate increase and raised their forecast for economic growth in 2018, even as they stuck with a projection for three hikes in the coming year.
“This change highlights that the committee expects the labor market to remain strong, with sustained job creation, ample opportunities for workers and rising wages,” Chair Janet Yellen told reporters Wednesday in Washington following the decision. In her final scheduled press conference, Yellen noted that her nominated successor, Jerome Powell, has been part of the consensus shaping the Fed’s gradual rate-hike strategy.
In a key change to its statement announcing the decision, the Federal Open Market Committee omitted prior language saying it expected the labor market would strengthen further. Instead, Wednesday’s missive said monetary policy would help the labor market “remain strong.” That suggests Fed officials expect improvement in the job market to slow.
The yield on 10-year U.S. Treasury notes fell after the Fed announcement, as did the Bloomberg Dollar Spot Index. Trading at record highs recently, stocks jumped after the Fed’s announcement before paring gains. Asked during a press conference about rising asset prices, Yellen said the high valuations don’t necessarily mean that they’re overvalued and that she’s not seeing a worrisome buildup of leverage or credit.
The 7-2 vote for the rate move, the Fed’s third this year, raises the benchmark lending rate by a quarter percentage point to a target range of 1.25 percent to 1.5 percent. In another move that could tighten monetary conditions, the Fed confirmed that it would step up the monthly pace of shrinking its balance sheet, as scheduled, to $20 billion beginning in January from $10 billion.
Through the policy adjustments and the statement, the Fed continued to seek a delicate balance between responding to positive news on growth and unemployment that encouraged gradual tightening, while signaling caution due to persistently weak inflation readings that have befuddled policy makers.
That puzzle continued earlier Wednesday when Labor Department data showed consumer inflation, excluding food and energy, was lower than expected at 1.7 percent in the 12 months through November.
Inflation Developments
“Hurricane-related disruptions and rebuilding have affected economic activity, employment and inflation in recent months but have not materially altered the outlook for the national economy,” the Fed said. Repeating language used since June, the FOMC said that “near-term risks to the economic outlook appear roughly balanced, but the committee is monitoring inflation developments closely.”
In the latest set of quarterly forecasts released Wednesday, the median estimate for economic growth next year jumped to 2.5 percent from 2.1 percent. It wasn’t immediately clear how much of the change reflected confidence that the tax-cut legislation moving through Congress will boost growth, or other factors such as pickups in business spending and global growth.

At the same time, the committee’s median forecast for long-run expansion was unchanged at 1.8 percent, suggesting officials aren’t yet convinced the tax package will significantly affect the economy’s capacity for growth.
Minneapolis Fed President Neel Kashkari and the Chicago Fed’s Charles Evans both dissented against the interest-rate decision, preferring to leave them unchanged. It was the first meeting with more than one dissent since November 2016; Kashkari’s dissent was his third this year. Evans dissented for the first time since 2011.
What FED Economists Say:
“The most important takeaway from the December FOMC meeting is that even though policy makers are becoming more bullish on economic prospects, they are not shifting to a more hawkish policy stance. An extended inflation soft patch is giving the Powell-Fed a free pass to continue along Janet Yellen’s gradualist path toward policy normalization.”
— Carl Riccadonna and Yelena Shulyatyeva, Bloomberg Economics.
That follows a solid rebound for the expansion since a disappointing start to 2017. Gross domestic product grew at more than a 3 percent annualized pace in both the second and third quarters, and is on track to expand in the fourth quarter by 2.9 percent, according to the Atlanta Fed’s GDPNow tracking estimate.
Rate Path
Despite the upgrade in near-term growth expectations, policy makers left the number of hikes projected for 2018 effectively unchanged. The median forecast pegged the federal funds rate at 2.1 percent at the end of next year.
That could, in part, reflect lingering concerns over sluggish wage and price gains. The Fed’s preferred gauge of inflation, based on consumer spending, gained just 1.6 percent in the year through October.
Weighed against unemployment, which has dropped to a 16-year low at 4.1 percent, that weakness has puzzled economists and made some policy makers declare the Fed should hold off on additional rate increases until prices respond more briskly.
The committee lowered its median estimate for the unemployment rate, expecting it to hit 3.9 percent by the end of 2018, compared with a September projection of 4.1 percent.
The committee left its median estimate for the lowest sustainable level of long-run unemployment at 4.6 percent, suggesting that officials still expect the drop in joblessness to eventually boost inflation. Forecasts showed little change in the inflation outlook over the next three years.
Yellen is expected to chair the committee’s next meeting on Jan. 30-31 for what will be her last FOMC gathering of her time on the committee spanning three decades as chair, vice chair, San Francisco Fed president and governor.
Other Details of Projections
Median estimate for 2019 federal funds rate held at 2.7 percent; 2020 projection rose to 3.1 percent from 2.9 percent, while long-run rate remained at 2.8 percent
Median inflation forecasts all unchanged except for 2017 headline PCE forecast, which rose to 1.7 percent from 1.6 percent
2019 median economic-growth forecast rose to 2.1 percent from 2 percent; 2020 projection moved to 2 percent from 1.8 percent
Median 2019 unemployment-rate projection fell to 3.9 percent from 4.1 percent; 2020 estimate declined to 4 percent from 4.2 percent
— With assistance by Matthew Boesler, Jeanna Smialek, and Steve Matthews


United States – Economic Forecasts – 2017-2020 Outlook USDOC Trade Economics
After growing the most since 2015 in the second quarter of 2017, we expect the US economy to slow down in Q3 due to effects of Hurricanes Harvey, Irma and Maria. The expansion is likely to gain speed in Q4, as rebuilding activity takes place, and continue throughout 2018. Consumer spending will continue to benefit from employment gains, stronger wage growth and expected personal tax cuts. Also, corporate income taxes are likely to bring further improvement in investment activity and growing external demand and abetting effects of dollar appreciation should boost exports. Lastly, as inflation remains close to its 2 percent target and labour situation continues to improve, the Fed funds rate is projected to rise gradually. This page has economic forecasts for the United States including a long-term outlook for the next decades, plus medium-term expectations for the next four quarters and short-term market predictions for the next release affecting the United States economy.


