Overview
Please Note: This is an abbreviated version of the Stratfor forecast that focuses on regions of interest for wood product trade implications. Please follow this link if you wish to see forecasts for Europe, Africa and South America. https://worldview.stratfor.com/article/2019-third-quarter-forecast-geopolitics-global-business-risk-q3
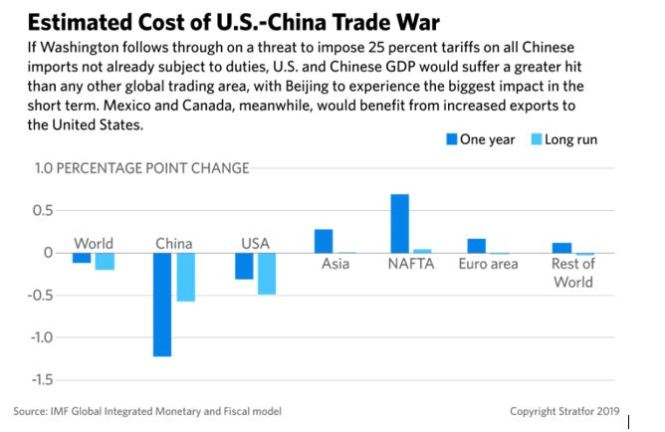
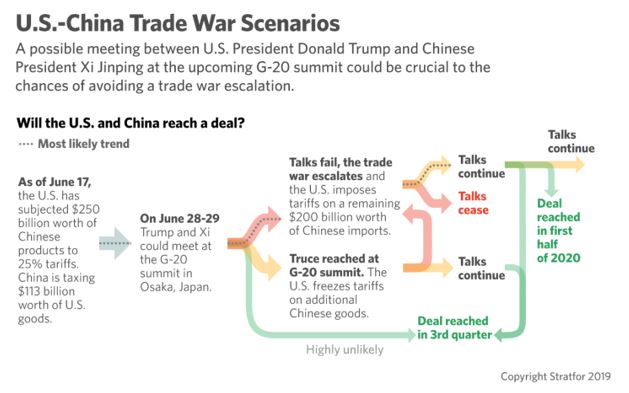
The U.S.-China Trade War Will Drag On. While there is a small window for a truce between U.S. President Donald Trump and Chinese President Xi Jinping, there is a stronger likelihood that the White House will follow through on its threat to impose tariffs on remaining Chinese imports. Nearly every move China makes to push back and cope with tariff pressure, including ramping up state backing for strategic industries and retaliating against U.S. businesses, will drive the two economic giants further apart as the trade war continues to damage the global economy.
Iranian Retaliation Will Raise the Risk of a Military Confrontation. Iranian retaliatory moves against the United States, including the resumption of nuclear activities and threats to shipping in the Strait of Hormuz, will raise the threat of U.S. punitive strikes on Iran. Even though the White House intent will be to limit offensive action and avoid bogging itself down in another politically unpopular war in the Middle East, the potential exists for a more serious escalation. Short of the negotiation Trump envisioned for Iran, progress could be made toward establishing a deconfliction channel via third-party mediators.
A High Stakes Tech Battle Will Drive Fragmentation in the Global Tech Sector. Far-reaching U.S. export restrictions against Chinese telecom giant Huawei Technologies Co. will nearly paralyze the company in the near term, and it could strengthen the White House’s ongoing campaign to deter other countries from working with Huawei on 5G roll outs. Even if the United States agrees to a partial relaxation of its ban against Huawei, China will move full steam ahead to accelerate indigenous semiconductor development and software alternatives to its Western competitors. At the same time, U.S. regulators will ramp up their investigations of U.S. tech giants over antitrust, privacy and data protection concerns.
Mexico Faces an Uphill Battle to Appease Trump and Avert Tariffs. Though Mexico narrowly averted U.S. tariffs by pledging to do more on border security, it is not out of the danger zone yet. Mexico will fall short of meeting Trump’s demand that it chokes off migrant flows, and Trump will likely rely on tariffs, or at least the threat of tariffs, as his preferred enforcement tool.

Global economic growth estimates are headed for another downgrade in the third quarter. Intensifying U.S. trade conflicts with China, along with the lingering threat of a major disruption to North American trade, will continue to sap investor confidence and drive a U.S. Federal Reserve decision to ease interest rates. The Chinese yuan is likely to depreciate past 7 to the dollar, though China’s Central Bank will intervene to avoid a much steeper devaluation that would accelerate capital flight and apply stress on a number of emerging markets. Between slowing consumer demand and a higher risk of supply disruptions from a potential Iran conflict, oil markets will remain in flux.
Brexit Chaos and Italy Will Weigh on Europe. The United Kingdom will get a new hardline prime minister, who will inevitably hit a wall with Brussels when negotiating the terms of the United Kingdom’s future relationship with the European Union. The risk of a no-deal Brexit will rise through the quarter, but the likely result will be more delays and possibly a path to early elections. And even as Rome manages to dodge EU sanctions over its ballooning deficit, Italy’s fiscal policies, weakening banking sector and fragile government coalition will continue to stress the European Union.
Great Power Competition Will Create Opportunity But Mostly Risk for Middle Powers. As U.S. competition with Russia persists, Poland will be able to take advantage of the White House’s strategic focus on Eastern Europe, advancing plans to rotate more U.S. troops through Poland and pushing for targeted U.S. sanctions against Nord Stream 2. Turkey and India, meanwhile, will remain in the White House’s crosshairs over their energy relationships with Iran and defense ties to Russia, with New Delhi facing the additional threat of tariffs this quarter.
Military-Backed Transitions in North Africa Face Major Hurdles. The fall of legacy dictators in Sudan and Algeria have emboldened opposition groups hungry for political change. The military s of each country trying to manage the tumultuous transition will struggle to satisfy opposition demands while navigating elite power spats behind the scenes. Sudan will rely more on brute force to quell unrest, while Algeria’s more diverse set of power brokers will likely become mired in political negotiation as unrest persists.

Section Highlights
- There is a small window for a trade truce, but the White House is more likely to escalate its trade war and broader strategic competition with China.
- Iranian retaliation against the White House’s maximum pressure campaign will raise the risk of U.S. punitive strikes against Iran.
- Mexico will continue to live in fear of tariffs as the country falls short of Trump’s demands for choking off migrant flows.
- Rising trade frictions, the potential for military conflict in the energy-vital Persian Gulf and growing political uncertainty will create major geopolitical headwinds for the already-slowing global economy.
The U.S. “Tariff Man” Strikes Again
More Information
U.S. President Donald Trump, the self-proclaimed “Tariff Man,” is likely to be the single most important source of geopolitical risk to the global economy in the third quarter of 2019. A deepening standoff with China increases the probability that Trump will follow through with threats to impose 25 percent tariffs on all remaining Chinese imports. Tariff threats against Mexico over auto imports will continue to linger at a time during which global trade risk creates headwinds for global economic growth. Trump nonetheless appears to be operating under the assumption that the U.S. economy is on solid enough footing to justify tariffs, both as a wide-ranging negotiating tactic and to drive down the U.S. trade deficit.

Of all its trade battles, the United States will maintain a particularly hard line on China as Washington’s strategic competition with Beijing deepens on nearly all fronts. A deliberate attempt by the White House to cripple Chinese tech giant Huawei Technologies Co. has narrowed what little middle ground there was last quarter for a trade compromise. And for every U.S. action designed to coerce Beijing into making greater concessions, there will be a Chinese reaction that pushes the economic giants further apart in the negotiation. For example, U.S. trade assaults on China will prompt Beijing to increase financial support for strategic sectors, such as the semiconductor industry, directly violating a U.S. demand to reduce state support and level the playing field for foreign businesses. Chinese tariff retaliation and possible boycotts of U.S. goods will counteract Washington’s demand for China to buy more American products to reduce the U.S. trade deficit. Chinese attempts to push back against the United States by selectively blacklisting and fining American firms only feeds into a familiar White House complaint: that China actively discriminates against foreign businesses.
Washington will not ease up on Beijing over the quarter, but every U.S. action will have a Chinese reaction.
A potential Chinese restriction of rare earth exports will amplify threats to U.S. commerce that the White House is citing to legally justify Section 301 tariffs in the first place. And the unavoidable depreciation of the yuan from the stress of the trade war will be used by the White House to name and shame China as a currency “manipulator” bent on disadvantaging U.S. exporters. This burning economic dispute is meanwhile unfolding against a backdrop of rising security tensions in the South China Sea and growing pushback against Beijing in China’s periphery, where the United States has the potential to apply sanctions against the Chinese government and its affiliates in the name of protecting human rights and democracy.
This geopolitical climate does not bode well for Trump and Chinese President Xi Jinping to reach a breakthrough in negotiations when they meet at the G-20 summit in Japan in late June. Beijing will keep the door open for future dialogue, and Trump still has the option of buying more time in the negotiation before resorting to all-encompassing tariffs. But the window for a truce is closing fast, and Xi and Trump will have enough political backing to prolong their economic war well beyond the quarter.
While Mexico has been among the main beneficiaries of the U.S.-China trade war, it has now found itself squarely in Trump’s trade cross hairs. Having narrowly averted tariffs this time around, Mexico’s government is facing a tight timeline and an uphill battle to appease the U.S. president. Given the Mexican national guard’s questionable ability to crack down on migrant traffic coming across its southern border — coupled with escalating unrest in parts of Central America and the reluctance of countries in the region to overhaul their asylum laws — the best Mexico City may be able to hope for is a temporary lull in migrant flows as smugglers adapt to expanded border controls. Moreover, Mexico’s already robust trade relationship with the United States and lack of market-based purchasing does not leave much room for the current administration to make a showy concession to Trump by increasing agricultural imports.
Fearing a descent into recession, Mexico will carefully avoid a confrontation with the United States this quarter as it tries to steer clear of costly tariffs.
Trump’s tariff threats against Mexico could resurface around July 22 and again on Sept. 5, when the Mexican government is supposed to deliver to the White House its progress report on curbing illegal border crossings. Already on the edge of recession, Mexico will be careful to avoid a confrontation with the White House to steer clear of costly tariffs. After more than a quarter of a century of tariff-free trade on the U.S.-Mexico border, the economic impact of just 5 percent tariffs on Mexican imports, as Trump earlier threatened, would be tantamount to ripping up the North American Free Trade Agreement and returning to average World Trade Organization-level tariffs for most sectors. Supply chain disruptions would reverberate across the auto, electronic, industrial and food sectors. Furthermore, U.S. agricultural producers would be singled out for retaliatory tariffs, and Congress could even regain momentum to challenge the president’s trade authority — though a veto-proof majority on such a measure would be far from assured. Even if Trump avoids the heavy economic and political toll that comes with disrupting North American trade through tariffs, the uncertainty that comes with merely keeping the threat alive will continue to erode investor confidence.
The threat of auto tariffs will meanwhile continue to loom large as Trump waits for U.S. trading partners to come to him with a “solution” by November, in the form of voluntary export restraints and/or acceptance of U.S. quotas. While Japan has a better chance of negotiating a trade compromise with the White House that includes agriculture and autos, EU leaders, too divided and consumed with horse-trading over political positions in the European Union for most of the quarter, will resist the White House’s ultimatum on restricting auto exports to the United States. As a result, there won’t be much movement in Continental trade negotiations with the Trump administration.
The psychological impact of Trump’s tariff weaponization strategy will linger well beyond the quarter.
The White House has already raised the WTO’s hackles by stretching the definition of national security to justify a variety of tariffs, all while discrediting the global trade body’s authority to arbitrate trade disputes. With a Dec. 10 deadline pending for the United States to lift its siege on the WTO Appellate Body or else drive it into paralysis, European leaders will prepare for the worst and work on convincing other WTO members to sign onto an ad hoc solution that would have former WTO appeals judges settle trade disputes under WTO arbitration rules until a compromise — likely with the next White House — can be found.
The European Union’s creative workaround at the WTO points to a growing assumption among U.S. allies and adversaries alike that negotiation with the current White House may be futile. Erratic U.S. negotiating tactics and the elusiveness of a final, negotiated settlement will bruise business confidence and investor sentiment globally. Ham-fisted diplomacy will also convince a number of powers, including China, Europe and Iran, that seeing out the result of the 2020 U.S. election makes more strategic sense than entertaining heavy concessions in a negotiation with the Trump White House over a deal that may or may not last.
Geopolitical Risk Bludgeons the Global Economy
More Information
In the face of yet another major tariff escalation, China will erect stronger capital controls and draw on its reserves to defend its currency, the yuan. China’s Central Bank will intervene to avoid a steep and sudden devaluation because a depreciation beyond 7 yuan to the dollar will exacerbate China’s economic slowdown and place greater stress on emerging market currencies. Heavy downside risk from the White House’s trade wars will drive the U.S. Federal Reserve to ease interest rates this quarter.
A variety of competing factors will slow but not quite stall the global economy in the third quarter.
The European Central Bank has already abandoned plans to tighten monetary policy this year as crises of the European Union’s own making roil the bloc. We do not think this quarter will end in a no-deal Brexit, but an escalation of political chaos in the United Kingdom, along with a drawn-out confrontation between Rome and Brussels over Italy’s expansive fiscal policies, will continue to sap at European growth amid rising global trade frictions.
For energy markets, between the opposing forces of slowing consumer demand and the threat of military conflict in the Persian Gulf creating a sharp supply disruption, oil prices will remain in flux. When the Organization of Petroleum Exporting Countries meets early in the quarter (with its expanded retinue of crude-producing partners, a collective known as OPEC+), Saudi Arabia and Russia will drive an agreement to extend production cuts into the second half of the year as the world’s biggest oil producers try to contend with rising U.S. inventories and weaker global demand.
Great Power Competition Drives Global Tech Fragmentation
More Information
An aggressive U.S. move in the second quarter to ban Huawei from selling and operating in the United States and, more importantly, to proscribe U.S. tech suppliers from working with the company goes well beyond trade leverage and fits into a broader White House strategy to cripple China’s tech giants as a U.S.-China battle for technological dominance intensifies. If Xi and Trump agree to de-escalate the trade war this quarter, the White House could offer a selective and partial relaxation of export controls on goods and/or licenses that fall outside of highly strategic applications — specifically, dual-use technologies that could be used for security, surveillance or defense purposes. Pressure from affected U.S. businesses and ongoing court challenges could also have the effect of weakening U.S. restrictions against Huawei.
Regardless of their country of origin, global tech companies will find themselves on the firing line as the U.S.-China trade dispute heats up.
Uncertainty surrounding the U.S.-China trade negotiation and the viral nature of U.S. export law, in which even a minimal amount of U.S. components, software and technology could subject a company to sanctions, will accelerate Chinese efforts to shore up indigenous semiconductor development. Huawei will further seek to roll out an independent operating system for smartphones to maintain the company’s global market share. China will struggle to reduce its reliance on major international chip providers — such as Intel Corp., Samsung Electronics and the Taiwan Semiconductor Manufacturing Company (TSMC) — that are now liable for U.S. sanctions. But over time, the rise of Chinese competitors in the chip manufacturing sector and the roll out of Chinese software alternatives — such as Huawei’s mobile operating system challenger to iOS and Android — are likely to contribute further to the fragmentation of the global tech sector.
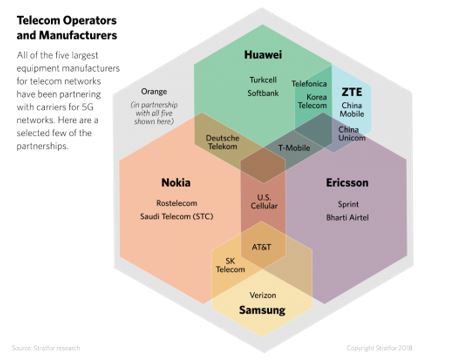
Ongoing U.S. diplomatic efforts to pressure countries in Europe, Latin America and Southeast Asia into imposing similar bans against Huawei equipment on national security grounds are already stalling. This is because most countries are unwilling to tolerate the much higher costs and implementation delays for 5G networks that would come with blacklisting Huawei. But the broad reach of U.S. export controls against Huawei will now give many of these governments and relevant telecommunications partners pause as they weigh a much bigger compliance risk in dealing with the Chinese firm.
Even as its efforts to defang Chinese tech leaders gain momentum, the U.S. government has also made a point of targeting the exact Silicon Valley tech giants that Washington relies on to outperform China in a global race for technological supremacy. In line with Stratfor’s 2019 Annual Forecast, bipartisan momentum is quickening behind U.S. efforts to scrutinize Big Tech over antitrust, privacy and free speech concerns. Google and Facebook are likely at the top of the list for the Federal Trade Commission and the Justice Department, which share oversight duties over the United States’ largest tech firms. U.S. tech companies will also remain a prominent target in the European Union, where Ireland has launched a probe into Google for violating the European Union’s General Data Protection Regulation on privacy protections.
The White House Struggles to Find Order in Its Cluttered Foreign Policy
More Information
As well as juggling trade wars, the White House will also have to balance competing foreign policy priorities. Iran remains at the top of that list. The Trump White House is operating under an assumption that its ability to choke off Iranian exports and inflict heavy economic pain on the Islamic Republic will drive Tehran to the negotiating table or, better yet, instigate a grassroots overthrow of the clerical regime. Neither is likely to happen, though — and certainly not this quarter. At most, Tehran could rely on third-party mediators to establish a “cooling off’ channel with the United States as military frictions rise. Trump appears well aware of the political flack he would receive by committing the United States to yet another massive military conflict in the Middle East and so is likely to exercise some restraint in trying to avoid a costly military scenario with Iran. But there are several triggers that will arise this quarter, such as Iran telegraphing threats to shipping in the Persian Gulf and restarting parts of its nuclear program, that will embolden White House hawks to argue for punitive strikes against Iran.


A lingering threat of military confrontation between the United States and Iran will detract from Washington’s focus on its burgeoning great power competition with both China and Russia. Beyond high-stakes economic battles, the potential for skirmishes between the United States and China in the South China Sea and in the Taiwan Strait will rise as the U.S. Navy and Coast Guard steadily expand their footprint in China’s near abroad. Russia, meanwhile, will oscillate between instigator and mediator in multiple theaters that have the potential to dominate the White House’s attention. While Russia already provides significant political and economic backing to Iran and Venezuela, it can always dial up military support should it see an opportunity to generate leverage against a highly distracted White House. U.S. attempts to coax Russia and China into a trilateral strategic arms control treaty are unlikely to gain much momentum this quarter as arms buildups continue on all sides.
The White House will have its hands full this quarter when it comes to foreign policy — Iran, Russia, China, Venezuela, North Korea and Afghanistan all require Washington’s attention in differing measures.
Unlike most countries dealing with the current White House, North Korea is trying to accelerate negotiations while Trump is still in office. Now that the United States has little choice but to plan for a military contingency around Iran, Pyongyang will have more room to push the line on missile testing while trying to break through a stalemate in negotiations. North Korean leader Kim Jong Un remains confident that Trump would rather keep North Korea in diplomatic limbo and call it a foreign policy win than return to a military confrontation with Pyongyang.
When compared to a prospective nuclear-equipped nation, Venezuela inevitably falls much lower on the list of U.S. foreign policy priorities. Even as the persistent threat of another coup attempt and the specter of greater Russian involvement in Venezuela will vie for Washington’s attention, the White House is unlikely to risk a messy military intervention at this stage to force regime change. A steady intensification of U.S. sanctions and ongoing back channel dialogue with military leaders to try and crack the rule of President Nicolas Maduro will be the White House’s preferred method of managing Venezuela as the country descends further into chaos.
Additional Forecasts
More Information
These Stratfor assessments provide additional insights for the Quarter
- At the same time that the United States is trying to cripple Chinese tech giants, growing domestic antitrust moves threaten to undercut its own tech prowess globally.
- Techno-nationalism, digital colonization fears and privacy concerns are accelerating the fragmentation of the internet.
- A deadline is approaching for the United States and Russia to agree to a New START agreement, but China will demur U.S. efforts to draw Beijing into a new framework to limit nuclear arms.
- The specter of a conflict between the United States and Iran in the Persian Gulf threatens to consume the United States at a time when great power competition is already demanding the White House’s full attention.
Key Dates to Watch
More Information
- June 25-26: OPEC+ members meet in Vienna, Austria.
- June 28-29: Chinese President Xi Jinping and U.S. President Donald Trump are expected to meet at the G-20 summit in Japan.
- Early July: The United States could follow through on threats to impose tariffs on $300 billion worth of Chinese goods.
- July: If the U.S. economy continues to grow, this month will mark the longest U.S. economic expansion in its history.
- July 7: The 60-day deadline Iran gave to the European Union expires, after which time Tehran vowed a partial nuclear restart.
- July 22: 45-day review of the U.S.-Mexico deal on border security.
- 5: 90-day review of the U.S.-Mexico deal on border security.
 Key Trends for the QuarterMore InformationChina Hunkers Down for an Economic StormTime is running out for the United States and China to call another trade cease-fire ahead of the G-20 summit in Japan in late June, and both sides appear to be digging their heels in for the long fight. In an extreme and very plausible scenario in which the United States follows through with threats to impose additional 25 percent duties on nearly all remaining Chinese imports, China could suffer a 1 percent hit to its gross domestic product (GDP) and millions of job losses over the next two years. If the White House and Beijing fail to reach a truce, China will stoke nationalist fervor to withstand the economic hardship — at the risk of inciting anti-U.S. boycotts and protests that could escalate beyond Beijing’s intent.If the U.S. follows through with threats to impose additional 25 percent duties on remaining Chinese imports, China could suffer a 1 percent hit to its GDP and millions of job losses in the next two years.
 China will also boost domestic infrastructure spending and even employ risky property stimulus measures in rural areas and lower-tier cities to avoid social disruptions from unemployment ahead of the 70th anniversary of the People’s Republic’s founding. Enacting such measures also means Beijing will struggle to contain debt risks in the coming months as fiscal burdens rise for local governments and bureaucracies. The extreme tariff scenario will most likely see China’s currency depreciate past 7 yuan to the dollar, creating more currency stress for emerging markets but also forcing the Chinese central bank to intervene to prevent sharp depreciation. Read more about why China will expand stimulus measures to ensure employment stability.U.S.-China Confrontation SpreadsIn the next quarter, the United States will maintain its strategic offensive against China in the Asia-Pacific through a more assertive security posture. It will also lobby support from allies and partners to counter Beijing’s claims over the South China Sea and Taiwan as well as commit to regional infrastructure development. The risk of U.S.-China collisions — both literal and figurative — will increase as Beijing feels pressured to respond to Washington’s intensifying maneuvers in the Taiwan Strait. Contentious activity in the South China Sea will also grow as the U.S. Navy increasingly challenges China’s coast guard and maritime militias and vice versa. Separately, unrest in Hong Kong over an extradition law could provide an opportunity for the United States to exert targeted trade or sanctions pressure.
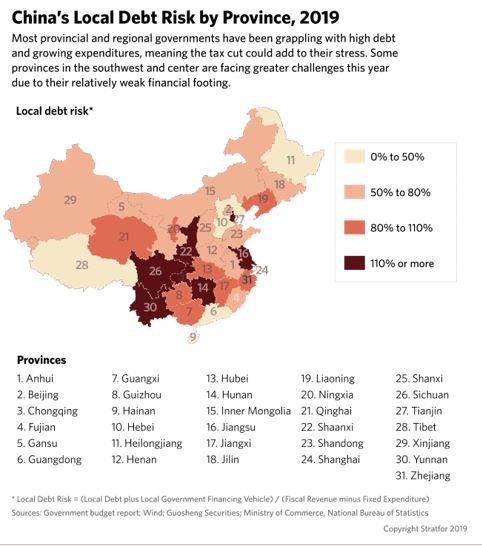
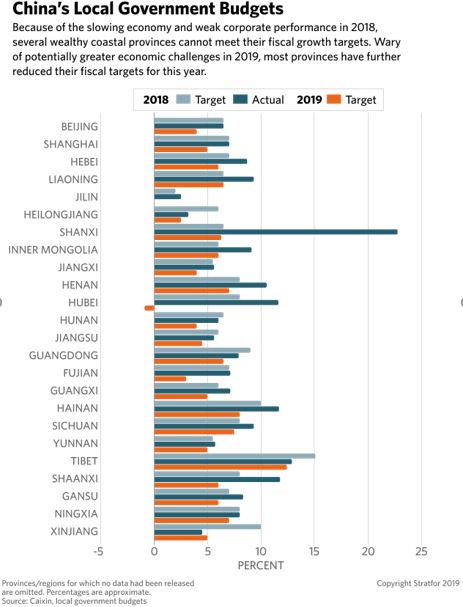
 Hoping to muster waning public support ahead of the Taiwanese 2020 presidential election, Taiwan’s ruling Democratic Progressive Party will lobby Washington for elevated security and diplomatic support while ramping up pro-independence narratives. Possible visits by senior U.S. Cabinet officials to Taiwan, completion of pending arms sales or a resumption of trade talks will draw Chinese military intimidation — including increased patrols and flyovers — risking escalation around the Taiwan Strait. Read more about Taiwan’s position in the U.S-China competition.Regional Powers Find Footing in the Middle
A number of countries in the Asia-Pacific region will be caught in the middle of the great power competition between the United States and China. Australia and Japan broadly align with the United States when it comes to restricting Chinese investments in each country’s tech sector, but they draw the line at engaging in maritime Freedom of Navigation operations and overt support for Taiwan (though enhanced security cooperation with regional states is a given). Tokyo may aid Washington’s efforts to counter Beijing’s Belt and Road Initiative by financing and providing technical expertise to participants to help scrutinize projects underway. But Tokyo will not limit its own infrastructure and technological cooperation with China, seeking instead to set up a security mechanism with Beijing to manage East China Sea tensions.
Many countries caught between the United States and China in the Asia-Pacific region are choosing to play both sides, with varying degrees of success.
With the United States embroiled in a trade confrontation with China, and having struck a tenuous deal with Mexico, U.S.-Japan trade talks will proceed slowly, allowing Tokyo to focus first on elections before having to deal with Washington. Meanwhile, U.S. lobbying to block Chinese tech giant Huawei’s 5G rollout and other infrastructure projects will face further constraints among smaller states in the Indo-Pacific region. Southeast Asian states — besides Vietnam — will avoid provoking Beijing out of necessity, despite cooperation with the United States. Read the latest Stratfor assessment on Japan’s rising role as a regional third power.
The U.S. Muddles Through on North Korea
The U.S.-North Korea dialogue will remain open throughout the quarter. Although no breakthrough toward a deal is expected, neither side is willing to fully derail the talks, thereby avoiding the risky escalatory cycle of previous years. Washington will deprioritize its outreach to Pyongyang to free resources to deal with Iran and Venezuela. To ensure that it remains on the U.S. radar, North Korea will continue missile testing only in a manner calculated to exert pressure but not run afoul of the Trump administration. However, a miscalculated weapons test could empower White House hard-liners. China and Russia will continue to support Pyongyang’s outreach to the United States in the interest of stability. Amid trade tensions, China will be more willing to slacken enforcement of sanctions on North Korea, prioritizing economic lifelines. However, U.S. President Donald Trump’s personal commitment to a North Korea deal leaves open the small possibility of the United States offering a compromise deal of incremental sanctions relief. To learn more about why the U.S.-North Korea outreach still has momentum, read Stratfor’s assessment on the matter.
Additional Forecasts
More Information
These Stratfor assessments provide additional insights for the Quarter
- Preparing for an enduring trade war amid important political anniversaries, China will expand stimulus measures this quarter, despite long-term financial risks.
- Japan will wait until after July upper house elections but will eventually make trade concessions to the United States.
- Washington will elevate its diplomatic and security support to Taipei in the lead-up up to Taiwan’s January 2020 presidential election, potentially stoking cross-strait tensions at a time when China will be increasingly assertive in its claims over Taiwan.
Key Dates to Watch
More Information
-
- June 28-29: Chinese President Xi Jinping and U.S. President Donald Trump are expected to meet at the G-20 summit in Japan.
- Early July: The United States could follow through on threats to impose tariffs on $300 billion worth of Chinese goods.
- July: The United States will decide on whether to sell 66 F-16V fighter jets to Taiwan.
- July or August 2019: Japan will hold upper house elections with the potential for lower house snap elections.
- July 27: North Korea’s Day of Victory in the Fatherland Liberation War holiday marks the signing of the Korean War armistice.
- September: Taiwan will conduct “Indo-Pacific Democratic Governance Consultations” with the United States.
 Key Trends for the QuarterMore InformationIndia Grapples With Its Economy and Foreign PolicyArmed with a renewed electoral mandate, Indian Prime Minister Narendra Modi faces daunting domestic and foreign policy challenges this quarter, including a cooling economy and rising trade frictions with the United States. With quarterly GDP growth falling to a four-year low, India’s government will focus on reviving consumption by stimulating demand in the country’s vast rural hinterland and jump-starting private investment. To reassure concerned investors, Modi will take baby steps toward reforming India’s restrictive land and labor laws, though implementing these politically sensitive measures — which are aimed at creating tens of millions of jobs — is a task that will stretch far beyond the quarter.
 Key Trends for the QuarterMore InformationIndia Grapples With Its Economy and Foreign PolicyArmed with a renewed electoral mandate, Indian Prime Minister Narendra Modi faces daunting domestic and foreign policy challenges this quarter, including a cooling economy and rising trade frictions with the United States. With quarterly GDP growth falling to a four-year low, India’s government will focus on reviving consumption by stimulating demand in the country’s vast rural hinterland and jump-starting private investment. To reassure concerned investors, Modi will take baby steps toward reforming India’s restrictive land and labor laws, though implementing these politically sensitive measures — which are aimed at creating tens of millions of jobs — is a task that will stretch far beyond the quarter.
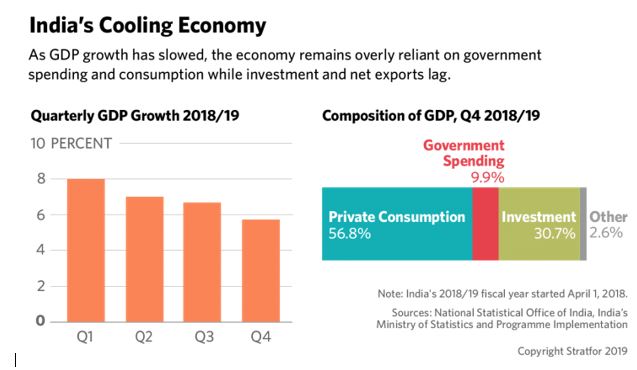 India’s relationship with the United States presents a major foreign policy challenge for New Delhi. When it comes to dealing with Washington’s trade demands — specifically, lower tariffs to grant better access to U.S. firms exporting to India — New Delhi has limited retaliatory options. It will, therefore, avoid escalating the ongoing trade dispute beyond tit-for-tat measures — such as imposing $235 million in retaliatory tariffs — against the United States, which is India’s largest export market. The fate of the dispute will ultimately depend on the White House and whether it chooses to launch a Section 301 investigation into Indian tariffs that it complains are too high. For India, trade tensions with the United States heighten the importance of entering regional trade blocs such as the Regional Comprehensive Economic Partnership (RCEP), a grouping of 16 countries, including China (though disagreements over market access between New Delhi and Beijing persist).
The United States wants to ensure its allies align with its objectives, especially when it comes to managing China, Russia and Iran. India imports Iranian oil — albeit in small quantities — and Russian arms, which puts New Delhi in the cross hairs of Washington’s Countering America’s Adversaries Through Sanctions Act (CAATSA). While India will reduce its oil purchases from Iran (potentially to nothing) and pay in rupees as opposed to dollars, New Delhi is highly dependent on Russian military equipment. Though it will not curtail its arms purchases from Russia, India is actively seeking to procure U.S.-made equipment, which will likely be enough to avoid CAATSA sanctions in the third quarter. And though India still counts China as its main strategic rival, the two will maintain calm on their disputed frontier as each country wrestles with other issues abroad. Even so, New Delhi’s strategic and economic competition with Beijing will advance across South Asia as India cultivates deeper ties with Sri Lanka, the Maldives, Bangladesh and Nepal through a mix of foreign aid, diplomacy and security cooperation — in keeping with Modi’s “Neighborhood First” policy. Pakistan, of course, will remain the outlier: talks, at least publicly, are unlikely this quarter since Modi rode to power on an anti-Pakistan platform.
Washington Wants an Afghan Deal by September
Though the war in Afghanistan rages on, the Taliban will remain in negotiations with the United States because dialogue offers the surest path to clinching the insurgency’s paramount objective: the withdrawal of foreign forces. For its part, Washington will remain committed to talks in the hopes it can seal a peace deal ahead of Afghanistan’s presidential elections in September.
The sticking point for negotiations has always been the sequencing of demands: The Taliban insist that U.S. forces leave Afghanistan first, whereas Washington wants a Taliban cease-fire, counter terrorism pledge and dialogue with the Afghan government first.
 If, however, a deal eludes both parties this quarter, it will be because of the fundamental disagreement over the sequencing of their respective demands: The Taliban will insist that the United States first announce a withdrawal of forces, whereas Washington will demand a Taliban cease-fire, counterterrorism pledge and commitment to hold talks with the Afghan government. Iran could choose to spoil any peace deal, too, if it anticipates a U.S. military strike against it. The country could ramp up its support for the Taliban, emboldening the insurgency on the western fringes of Afghanistan. Iran would, however, seek to balance such a move with its need to maintain good relations with Kabul. Beyond Iran, regional actors including Russia, China and Pakistan — the Taliban’s key external sponsor — will support efforts to enable a durable resolution to the long-running conflict.
Pakistan Endures Rising Opposition to Austerity Measures
Though Pakistan’s government will face a social and political backlash arising from the government’s austerity measures — which are tied to the International Monetary Fund’s $6 billion loan — its survival won’t be at stake. Prime Minister Imran Khan recognizes the importance of maintaining military support for his political survival, so he will accommodate the army’s demands, principally delegating control over foreign and defense policy with respect to India and Afghanistan. A key constraint against protests over high inflation will be the sidelining of leaders from Pakistan’s two main opposition parties — the Pakistan People’s Party (PPP) and the Pakistan Muslim League-Nawaz (PML-N).
Unpopular austerity measures will create social and political fallout, but thanks to the support of the armed forces, the government will hold strong through the quarter.
But even if protests grow, the army not only has the ability to control public disorder but can silence dissent in the media as well. Khan and the army want to avoid anything that could hurt business confidence in Pakistan, especially as the country’s $300 billion economy prepares for an abrupt slowdown. For Pakistan, projecting an image of stability abroad is paramount.

- Additional ForecastsMore InformationThese Stratfor assessments provide additional insights for the Quarter
- Defusing India’s shadow banking crisis will be a major objective of the Reserve Bank of India as New Delhi seeks to stave off a liquidity crunch.
- As a key middle power, India will seek to strike a careful balance between the United States and Iran, sustaining its involvement in the latter’s Chabahar port project.
Key Dates to Watch
More Information
- June 16-21: The Financial Action Task Force (FATF) will meet in the United States.
- July 1: The fiscal year will begin in India, Pakistan and Bangladesh.
- July 5: India’s government will present its federal budget.
- Sept. 28: Afghanistan will hold presidential elections.
- Unknown: Kashmir will stage state elections (unscheduled but due this year).
- Unknown: The next round(s) of U.S.-Taliban talks will be announced.
Apr 17, 2019 | 15:50 GMT

China: Urban Worker Pension Fund Will Be Empty by 2035, Study Finds
What Happened: China’s urban worker pension fund will be empty by the year 2035 due to a shrinking workforce and insufficient contributions, according to findings by the World Social Security Center at the Chinese Academy of Social Sciences, Caixin reported April 15.
Why It Matters: China is facing a demographic cliff in the coming years similar to other Asian countries, which is aggravated by the legacy of its one-child rule as well as lax enforcement, local mismanagement and various exemptions to promote employment. The ongoing economic slowdown has only compounded efforts to get the system back on track.
Background: The urban worker fund was established in 1997 and is designed to replace roughly 59 percent of an employee’s salary on retirement through individual and employer contributions.
Read More:
- In China, an Unprecedented Demographic Problem Takes Shape (Jan. 4, 2019)
- China Abandons the One Child Policy (Oct. 29, 2015)
- Urbanization and Demographics Could Skew China’s Economic Rebalancing (Sept. 3, 2014)

China turns again to infrastructure to support growt
Reliance on old economic driver reflects failed efforts to boost private companies
FT Confidential Research June 12, 2019
The Chinese government has turned again to infrastructure to support a slowing economy facing a barrage of threats, not least a worsening bilateral relationship with the US.
By itself, a tentative loosening of infrastructure project funding rules might not be enough to stabilize an economy that may be growing near the lower bound of the 6 to 6.5 per cent range the government is targeting for this year.
But a joint party-state announcement published on June 10 suggests that the leadership is prepared to do more to shore up the economy, even if this means giving more ground on its “critical battle” to tackle financial system risk.
The announcement also suggests recognition by policymakers that attempts to boost the economy by cutting taxes and encouraging sectors such as private companies, while closing off critical funding channels, have had limited success. Tougher action may be necessary and may be forthcoming, as pressure on the economy builds into the second half of the year.
Local governments have been given more scope to use debt to capitalize infrastructure projects that meet official investment criteria. Specifically, funds raised through the sale of special local government bonds may be used to help meet capital requirements, usually set at 20 to 25 per cent of financing. The government this year earmarked Rmb 2.15 trillion ($310 billion) in sales of such bonds, which pay out from project cash flows rather than from fiscal resources.
Although this year’s quota was increased from Rmb 1.35 trillion, strained local government finances — worsened by the collapse of land sales — and constraints on shadow finance have hurt their ability to finance infrastructure spending, just as the government needed this to support the economy.
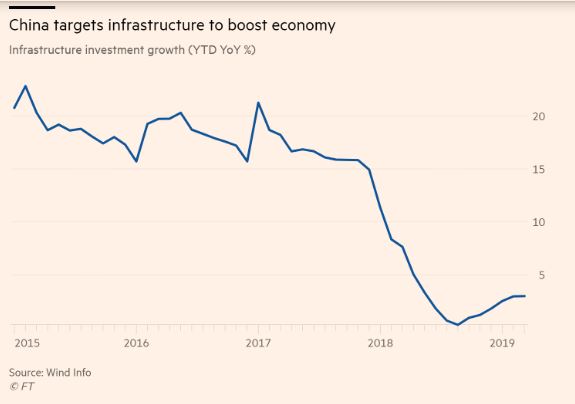 Along with the real-estate industry, government-led investment in areas such as transport and utilities has been a key driver of growth in the modern Chinese economy, accounting for more than a quarter of total investment activity this year.
Looser project financing rules will help, but probably not by much. Just over Rmb 1 trillion in local government bonds have been sold so far this year, and only 6 per cent of the funds raised have gone to the kinds of projects, including transport and electricity investments, targeted in this latest announcement (most goes towards preparing land for auction and the redevelopment of slum areas).
If the proportion of funding going to qualified infrastructure projects were to rise to 10 per cent of the total for the remainder of this year, it would imply an extra Rmb 456.4 billion in additional infrastructure investment, once additional leverage is calculated in. This suggests that investment growth would rise to just 5.6 per cent, compared with the 3 per cent growth recorded in January-April.
The announcement did not spell out how much of the funding would go to meeting project capital requirements. However, a more aggressive, if less likely, scenario is that all funding from special bond sales is permitted to go towards such projects, excluding that going towards land preparation and slum area renovation. This would imply an extra Rmb 1trillion in infrastructure investment this year, enough to lift investment growth to nearly 9 per cent, and nominal GDP growth by 0.7 percentage points.
This is the fourth time since 2004 that rules have been tweaked to increase the ability of local governments to invest in infrastructure. Not coincidentally, this includes adjustments in 2009 and 2015, when China’s economy faced the threat of a hard landing.
Allowing more special bond funds to flow to infrastructure would have a more meaningful impact on economic growth in the short term, whereas incremental steps to give back more money to households and business through tax cuts have not.
 The danger of such a policy is that local governments would be emboldened to borrow more. Although the joint announcement was explicit in its warning to keep debt levels under control, local governments will be forced to tread a very fine line.
On the other hand, the balance of economic risks is continuing to shift — US president Donald Trump has threatened to raise tariffs on all Chinese imports into the US if Xi Jinping does not meet him at the G20 leaders’ meeting in Osaka at the end of this month.
Our latest survey of small, private companies shows weak appetites to invest because of prevailing economic conditions, while People’s Bank of China data released on Wednesday showed that total social finance, a broad measure of funding conditions, grew just 10.5 per cent in the first five months of this year, in line with the average of the previous 12 months.
A recovery in infrastructure investment growth would at least help cushion the blow of a deepening trade war and might also deliver the confidence boost necessary to convince private companies to invest more.
The risk of storing up yet more problems for the future has again taken a back seat.
He Wei, Finance Researcher, FT Confidential Research
FT Confidential Research is an independent research service from the Financial Times, providing in-depth analysis of and statistical insight into China and south-east Asia. Our team of researchers in these key markets combine findings from our proprietary surveys with on-the-ground research to provide predictive analysis for investors.
China: Transformation of the Nanxun wood industry
 June 20, 2019
Source: ITTO/Fordaq
Major changes have taken place in the Nanxun timber industry over the past few years. Naxun leads a significant trend in China manufacturing to reduce their environmental footprint and gain huge gains in productivity. The main change has been the shift from family workshops to modern factories, from single product lines (plywood and veneers) to diversified solid wood flooring, home furnishing and the adoption of ‘clean green’ manufacturing.
Nanxun District of Huzhou City in Zhejiang Province has become one of the most important flooring production bases in China. More than 300 flooring manufacturers are located there.
The old-style manufacturing created pollution. In particular, the use of volatile organic compounds (VOCs) was not well managed. To address this a ‘Special Action Plan for Environmental Pollution Control in Wood Industry’ was formulated in Nanxun District in 2017.
This says no production shall be allowed if the production processes do not meet the requirements of environmental protection standards. Nanxun District government has acted to close or relocate many industries. Of the 3,922 wood enterprises listed in the City, over 80% have been forced to close, the balance have undertaken renovation measures.
The changes have promoted the development of industrial clusters and the surviving enterprises have become bigger and stronger and the environment continues to improve.
Data show that the emission of volatile organic compounds (VOCs) from wood product enterprises in Nanxun districts has been reduced by more than 2,000 tonnes and the tax revenue has increased by more than Rmb 600 million.
China recognizes WFC technology in new Green Building Standard
 By Eric Wong
Managing Director, Canada Wood China
June 5, 2019
Posted in: China
 Wood Frame Construction Technology (WFC) has officially been recognized for the first time by China’s Green Building Evaluation Standard as a viable solution for the country’s green building credit rating. This is another milestone for WFC in China on the government regulations front after a series of prefabrication policies favourable to wood has been published in the past few years.
The newly revised standard, printed in May and scheduled to be implemented in August 2019, includes WFC as one of the three building solutions along with concrete and steel systems. It also awards credits to wood frame solutions for being an innovative construction technology. The new standard also introduces the entry Certified Level, making it aligned with the LEED certification system and offering more accessible eligibility. This also means that green building standard is likely to be implemented as de-facto compulsory measures in the future.
In 2006, the Chinese Ministry of Housing and Urban-Rural Development (MOHURD) released its first Evaluation Standard for Green Building, otherwise known as the Three Star System. Different from LEED’s total points rating system, the Chinese system requires that a building must obtain a certain number of points in all rating categories to qualify for a star rating.
Based on the 2006 Evaluation Standard for Green Building, MOHURD further revised the document the standard in 2015, vowing that 30% of all newly constructed buildings will be green by 2020. However, the 2015 revision still did not specify whether WFC was considered a green building solution.
In recent years, unremitting lobbying efforts by Canada Wood China contributed to the official recognition of WFC in a series of policies and industrialized construction standards. MOHURD realized that WFC should also be a part of green building policies and standards, and started working on revising the Three Star System again in 2018, merely three years after its second iteration.
The standard is expected to be revised again in 2020. Canada Wood China will maintain close communications with MOHURD to ensure the inclusion of WFC content in the revised standard.
China Economic Update
By Eric WongManaging Director, Canada Wood China
May 6, 2019
Posted in: China
China’s economy continued to slow in 2019, with Q1 GDP growth at 6.4%, compared to 6.6% in 2018. However, the growth is slightly higher than market expectations. This is attributed to higher factory production, which has benefited from additional tax cuts, infrastructure spending, and other government fiscal stimulus.
The Caixin China General Manufacturing PMI rose to 50.8 in March 2019 from 49.9 the previous month, beating market expectations of 50.1. The latest reading was the first increase in manufacturing activity in four months and the strongest since July 2018.
2019 Economic Outlook
Many organizations raised their economic forecast for China in April. OECD forecasted in its recent report that China’s economic growth will be above 6% percent this year and next. The IMF raised its forecast to 6.3% from the previous 6.2%.
Yet, analysts warned it was too early to put a timetable on when there will be sustainable turnaround, adding further policy support was needed to maintain momentum in the world’s second-largest economy. Many had expected a recovery only in the second half of 2019, according to a recent Reuters report. Beijing set a 2019 economic growth target of between 6 and 6.5 percent in March.
Looking ahead, China’s economy continues to be under pressure this year. The trade conflict with the United States and related uncertainties ranked as the top risk to China’s economy, according to the Economist Intelligence Unit.
The Construction Sector
In March, on average home prices in 70 major Chinese cities increased, indicating a recovery in the property sector amid government controls to curb speculation and prevent an overheated market.
Total investment in real estate increased 9.5 percent year-on-year in 2018, and continued the strong momentum in March 2019, with growth of 11.8 percent year-on-year.
 However, total floor area completed in 2018 was flat (4,135 million sq. m, down 1.3% from 2017), of which 2,784 million sq. m (-0.7%) was residential.
CAD/CNY was on a downward trend in Q1 2019, compared to Q4 2018. The currency hit below five briefly on March 7th and 8th but bounced back to the level of 5 afterward.
China Wood Imports (cited from China Bulletin)
According to information released by Mucairen, there were 117,183 wagons of log and lumber imported from Russia to the Manzhouli port (border with Russia) in 2018, a decline of 13% over 2017.
Furthermore, there were an estimated 7,300 wagons in total for both log and lumber that arrived in Manzhouli in January 2019, a decline of 20% compared with January 2018, the lowest volume in five years.
Softwood lumber inventories at Taicang port and the surrounding area were 1.48 million cubic meters in late February 2019, up 370,000 cubic meters or 33% compared to last month. It was the second consecutive monthly increase. The inventory level of SPF was 500,000 cubic metres, a surge of 200,000 cubic metre, or 67% from last month.
MLIT Streamlining Fire Regulations for Wooden Buildings
Deputy Director and Manager Technical Services, Canada Wood Japan
June 5, 2019
Posted in: Japan

- Full Scale 3-Storey Wooden School Building Fire Test on February 22, 2012 in TsukubaAs reported in this blog in August 2018, the Ministry of Land, Infrastructure, Transport and Tourism (MLIT) amended the Building Standard Law to streamline fire-related regulations for wooden buildings. One of the streamlined requirements was to allow mass timber to be visually exposed in midrise buildings. Another amendment was to allow the architects to design any wooden buildings as long as the building height is 16 m or less (Article 21 in BSL: Building Standard Law). The BSL used to require 1-hour quasi-fire resistive performance in case that the building height and the eaves height exceed 13 m and 9 m, respectively. The BSL amendments were announced in June 2018 and are going to be enacted in June of this year, after the MLIT releases the relevant enforcement orders and the notifications. It is anticipated that the demand and supply of wooden large-scale buildings are accelerated by these amendments.TwitterLinkedInSummary 2018 Non-Residential Construction Market
 Canada Wood Today | The Canada Wood GroupSummary Review of 2018 Japan Housing Starts
 By Shawn LawlorManaging Director, Canada Wood JapanApril 5, 2019
Posted in: Japan
In 2018 total housing starts declined 2.2% to 942,370 units. Wooden housing fell 1.1% to 539,394 units. As a percentage of overall housing, wooden homes increased to 57.2%, the strongest showing in over three decades. Of all housing, post and beam starts were the most resilient: falling 0.5% to 409,873 units. Non-wood others starts fell 3.0% to 284,103 units. Platform frame starts declined 2.6% to 116,988 units. Wooden prefab fell 5.8% to 12,533 units and total prefab fell 5.5% to 131,406 units. In terms of relative market share prefab housing fell half a percentage point and 2×4 housing was essentially stagnant at twelve and a half percent.
In recent months, we’ve been seeing some strength in single family custom ordered and speculative housing starts as we lead up to the implementation of the consumption tax hike of 8% to 10% coming in October of this year. Market feedback is indicating that construction activity should pick up over spring and summer. The strength in single family housing is also leading to a recent slight increase in overall average wooden floor area. On the downside, the environment for wooden multi-family apartments has been challenging. One of the key things we are hearing is that in 2018 the Ministry of Finance implemented some tightening measures for regional lenders which is resulting in significantly higher mortgage down payments for property developers. These credit restrictions appear to be restraining multi-family starts and the issue could be with us for some time.
Urban Regeneration, Led by Wood Frame Construction. – Completion of Korea’s Tallest Hybrid Wood Building
 By Tai JeongCountry Director, Canada Wood KoreaJune 5, 2019Posted in: Korea
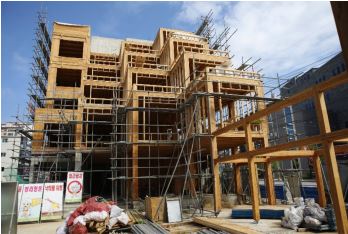
- Urban regeneration is quickly becoming the most important core value and the best urban management method in Korea’s urban policies. In response to the rising demand for more urban buildings, the National Institute of Forest Science (NIFoS) introduces the wood frame construction to the city in order to set an example of how tall wood hybrid building can be part of the urban regeneration project for the improvement of declined or underdeveloped areas in the city.

This recent completed 5-story project in Youngju-si Gyeongsangbuk-do, which is the tallest wood hybrid building in Korea was celebrated by NIFoS on March 23, 2019. The case for this project is driven by the significant environmental benefits that wood building can provide to create safe and livable space for urban residents.
- The wood structure of this building reaches 18 meters high with a 19.12 meters concrete core. The Korean Building Structure Code limits the maximum height of wooden buildings to eighteen meters at the ridge and fifteen meters at the eave. The rest of the above ground structural system of this building consists of reinforced concrete for core and CLT panels, Glulam posts and beam and I-joists for floor and non-load bearing wood frame infill walls. Under the current fire code, buildings between five and twelve stories are required to reach two-hour fire ratings for most of the main structural components of buildings. For the construction of this building, NIFoS successfully tested and achieved two-hour fire resistance rating for CLT wall and floor panels and glulam posts and beams.In a KBS broadcasting video, Dr. Kim Se-Jong from Institute of Forest Science said, “The building was exposed to 1,000 degrees of heat for 2 hours and the structure endured the environment.”“A special engineering technique was used to tackle the weight issue as the higher a building gets, the heavier it is. The new building is also found to be more earthquake resistant than steel-framed or reinforced concrete structures. Lumber’s elasticity disperses the force of impact, making wooden buildings more resistant to quakes.” Dr. Kim added.Another example includes the four-story research building constructed in Suwon, Gyeonggi-do. This research building was constructed for NIFoS’ use and it is Korea’s first modern and large scaled building entirely built with wood.

- NIFoS has already announced a plan for building a ten-storey wood multi-unit dwelling by the year 2022, which will require amending the structural code to allow higher wooden buildings in Korea. The experience and knowledge gained and accumulated from this project will be instrumental for future wood building projects.TwitterLinkedInPrevious article Next articleKorea Economy Update
- By Tai JeongCountry Director, Canada Wood KoreaApril 5, 2019Posted in: KoreaSouth Korea’s economy grew 2.7% in 2018, marking a six-year low amid sluggish investments, but its gross national income per capita, a gauge of the population’s purchasing power, exceeded the $30,000 mark for the first time – be more specific, $31,349, up 5.4% on-year.The latest figures are considered crucial for the South Korea economy amid the prolonged slow economic growth, as the $30,000 mark is generally considered an entry line for top-tier economies.
South Korea ranked 9th in per capita GNI among countries with 20 million or more people, standing next to the US, Japan, Britain, France, Germany, Canada, Austria, and Italy.On GDP growth, facility investment fell to a nine-year low of 1.6% in 2018 as cooling global demand for semiconductors discouraged companies from expanding their factory lines.
Construction investment tumbled 4% as the Seoul government has been making efforts to calm down the overheated housing market. The 4% drop marked the sharpest contraction since 1998 when the sector plunged 13.3% amid the Asian financial crisis.
The construction sector retreated 4.2%, marking the first negative growth since 2012, while services rose 2.8% in 2018.
Private spending rose 2.8%, the highest in seven years, while government spending jumped by an 11-year high of 5.6% in 2018 on its efforts to prop up the economy.
Exports, which account for around 50% of the GDP, rose 4.2%, up from a 1.9% increase in 2017, while growth in imports slowed down to 1.7% from 7%.
The exchange rate for Canadian Dollar averaged at 848.98 won in February 2019, down by 1.17% from 859.00 in February 2018 and slightly up by 0.76% from 842.59 in the previous month.
Summary of Korean Housing Start
By Tai JeongCountry Director, Canada Wood Korea
May 6, 2019
Posted in: Korea
Due to declining construction investment amid the ongoing government intervention to curb rising house prices and cool down the overheated housing market, South Korea’s housing starts for 2018 decreased 16% to 81,300 buildings and decreased 13.5% to 470,706 units.
Housing permits in a number of buildings and units for 2018 also decreased by 15.3% and 15.2% respectively from a year earlier.
 In 2018, the number of wood building starts and permits decreased by 15.1% and 26% respectively. This was due to the overall slowdown of the housing market together with the more stringent requirements for seismic design on small scale buildings and soundproof floor requirement in Dagagu house.
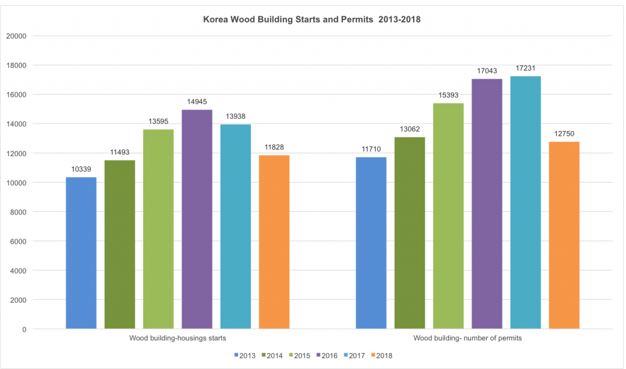
- Reflecting the market response to the government’s real estate regulations, the home purchase sentiment has dwindled to the lowest level in nearly six years. The Seoul’s Weekly Apartment Supply-demand Index stood at 73.2 as of Feb. 11.Note:
Measured on a scale of 0 to 200, with 100 indicating neutral status, the index refers to the ratio of apartments available for transactionsTwitterLinkedInFor latest Canada Wood market summaries in Asia see this link https://canadawood.org/newsletter/june-2019/ Vietnam, a rising star in wood exports
 - Friday, 2019-06-21 11:33:16
- NDO – With its abundant potential in wood processing, Vietnam is emerging as a major exporter of finished wood products in the global wood market. However, the local wood industry is being challenged by shortages of imported materials which may affect its future exports. Thu Ha reports.Since early this year, Hoang Vinh Wood Processing JSC in the southern province of Binh Duong, which is Vietnam’s wood export hub, has been mobilising all its 500 employees to work at full speed to meet the company’s contracts signed with a partner from France, worth US$20 million. The contracts must be fulfilled by early next month.Last year, the firm reaped total export turnover of US$50 million, up 20% year-on-year, from some European and Asian markets.In its business strategy, this firm will likely establish a joint venture with a partner from the Republic of Korea (RoK). “If the joint venture is established, we will be able to boost our exports significantly,” the company’s director Nguyen Hoang Vinh told VIR. “Currently, both sides are in negotiations and we hope a deal will be reached by the third quarter of this year.”Nguyen Ton Quyen, vice chairman of the Timber and Forest Product Association of Vietnam (VIFORES), told VIR that many foreign firms are seeking to co-operate with Vietnamese firms, like the potential Korean partner of Hoang Vinh, to boost exports to their nations.
“The wood industry’s export turnover has been rising strongly over the past few years, with US$7 billion in 2016, US$7.66 billion in 2017, and US$8.48 billion last year. Moreover, when Vietnam and the EU approve their shared Forest Law Enforcement, Governance and Trade Voluntary Partnership Agreement (FLEGT-VPA), Vietnam’s exports to the EU, one of its key export markets, will likely soar,” Quyen said.
The FLEGT-VPA is aimed to help improve forest governance, address illegal logging and promote trade in verified legal timber products from Vietnam to the EU and other markets.
Signed in October 2018, Vietnam and the EU are now working with each other towards taking the deal into effect this year.
Rising star
IMM Mission, funded by the EU and managed by the International Tropical Timber Organisation, stated, “Vietnam is emerging rapidly as a major player in international wood markets, both as an importer of wood materials and as a large exporter of finished wood products”
Vietnam signed FLEGT-VPA early this year and this presents unique opportunities, IMM said.
The IMM’s role is to use trade flow analysis and market research to independently assess trade and market impacts of VPAs in the EU and partner countries.
EU imports from Vietnam consist almost entirely of wooden furniture, with trade in this commodity strengthening this year after a dip in 2017. The twelve-month rolling total for EU furniture imports from Vietnam increased from 220,000 metric tonnes at the end of 2017 to 232,000 metric tonnes in November 2018, according to the IMM.
“Another potentially significant trend is that Denmark started to import larger volumes (up to 2,500 metric tonnes per month) of waste wood (for biomass energy) from Vietnam this year,” the IMM stated.
During her recent working visit to Vietnam, Heidi Hautala, Vice President of the European Parliament, told VIR that after the VPA takes effect, it will turn Vietnam into a more attractive investment spot for European wood investment, which remains humbly now.
“The VPA process and implementation will add to the confidence of European businesses in Vietnam’s business environment,” she said. “This will help Vietnam attract more investment from the EU, which is tending to increase now.”
“Currently the European consumers and businesses have growing demand for imported wood products with fairly transparent production and origins,” she said. “This will further prompt European investors to come to Vietnam to both implement projects directly and co-operate with local partners in exports. I am seeing many European businesses making plans to expand business and investment into Vietnam.”
Under the Comprehensive and Progressive Agreement for Trans-Pacific Partnership, which took effect for Vietnam on January 14, 2019, and the Vietnam-EU Free Trade Agreement, which is expected to be signed soon, almost all import tariffs will be eliminated, offering great potential for Vietnam’s wood exports, and for foreign firms to come to Vietnam to invest in the wood industry.
In 2018, Vietnam has about 3,200 enterprises engaging in exporting wood and wood products, including 529 foreign-invested enterprises which earned a total export turnover of nearly US$4 billion.
“Not only foreign firms, but many local ones have also been performing very well, and have secured export orders until the end of the second quarter of this year,” Quyen said. “While enterprise production is improving, the global demand for Vietnam’s wooden products are strongly rising, focusing on key markets including the US, China, Japan and the RoK.”
Last year, Vietnam’s wood exports turnover strongly increased from many markets, such as France (25.5%), Japan (16%), Malaysia (100%), the RoK (48%), and the US (17.5%).
The US, Japan, China, and the RoK purchased over around 80% of Vietnam’s total wood exports.
Nguyen Viet Vinh, Director of Vinh Hanh Furniture JSC in the south-central province of Binh Dinh, told VIR that this firm’s export turnover hit US$17 million last year – up about 18% over 2017. The figure is expected to be about US$10 million in the first half of 2019, up 20% year-on-year.
“We expect the figure will be about US$20-22 million in this year. We will continue seeking more export markets, in addition to our existing markets of Japan and the US, so that we can reach our target of US$25-27 million by 2020,” Vinh said.
VIFORES’s Quyen said many other firms are also performing very well in exports. For example, the export turnover of Nam Dinh Export Foodstuff and Agricultural Products Processing is expected to rise from US$50 million last year to nearly US$55 million this year. Meanwhile, many other firms like Tien Dat, Dai Thanh, Cancia Pacific, Hiep Long, Minh Phat and Phu Tai are also expected to reap export turnovers of US$30-50 million this year, up 10-15% year-on-year.
Early this year, Prime Minister Nguyen Xuan Phuc said the wood industry has grown by over 800% over the past 10 years. He ordered it to reach an export turnover of over US$11 billion worth of wood and forestry products in 2019.
Shortages of materials
However, one of the biggest challenges facing Vietnam’s wood industry is the upcoming shortages of imported material supplies, which will affect the country’s future wooden exports.
Currently, Vietnam must largely depend on foreign supplies to ensure its local production. Annually, it spends US$1.7-1.8 billion importing timber materials, which are largely from Laos (60% of round and sawn timber – the main timber for production), Cambodia (70% of precious timber), Papua New Guinea, and Africa.
According to a wood industry report from VIFORES, Handicraft and Wood Industry Association of Ho Chi Minh City, and Forest Products Association of Binh Dinh, Vietnam will face major shortages of timber materials from these markets.
For example, Laos, which used to export nearly one million cubic metres (m3) of round timber to Vietnam annually, has stopped exporting timber materials since May 2017.
The policy has almost curbed all timber supplies from Laos for Vietnam. The volume of round timber has reduced from 322,000 m3 in 2015 to 36,000 m3 in 2016, and 6,000 m3 in the first half of 2017.
In another case, Cambodia’s government is planning to more strictly control the country’s timber exports.
According to the report, timber supplies from Papua New Guinea and Africa are facing issues regarding timber quality and legality, which are also affecting Vietnam’s wood processing and exports.
Hoang Vinh Wood Processing JSC is also suffering from wood materials. “We are trying to find new sources from EU. Though if the new sources offer at higher prices, we will have to accept, meaning that we may have to increase product prices,” said this firm’s director Vinh.
VIFORES’s Quyen said his association and businesses have been working with many partners in the US, France, Finland, some other EU nations, Japan, and New Zealand about wood material supplies.
“These are Vietnam’s new wood material suppliers. They even come to Vietnam to seek supplying contracts. Despite higher prices, materials from these markets have higher quality and clearer origins,” Quyen said.
Price drops in China for logs, decrease less in India. Some export sawn timber products suffering big price drops. Local market remains very stable
 17th Jun 19, 9:16amby Scott Downs
- The CFR sale prices for New Zealand logs in China has dropped -US$4 to -US$6 over the last month, with A grade logs now selling at around US$130 per JASm3.The weakening of the NZD against the USD through May somewhat buffered the drop for the June At Wharf Gate (AWG) prices offered to log suppliers at NZ ports. The average drop in AWG prices was -US$5-6 per JASm3. The Chinese Yuan (CNY) has recently stabilised against the USD providing some relief to the Chinese log buyers. The NZD however has recently strengthened against the USD, and if this continues will have an adverse effect on July AWG prices.The markets for sawn timber produced by New Zealand mills has not changed from last month. The large Clear1 grade boards are selling well in Europe and parts of the US, but there is too much volume of the smaller Clear2 grade and knotty grades in Asia. Volume is still moving but at much lower prices.The domestic market for sawn timber remains very stable.
Due to the drop in the AWG log prices the PF Olsen Log Price Index for June decreased -$2 to $128. The index is currently $1 below the two-year average, $2 above the three-year average, and $10 higher than the five-year average.
Domestic Log Market
Log Supply and Pricing
Prices for domestic log sales in June are mostly unchanged from May as we move to the end of Quarter 2. Most mills anticipate some relief in log prices in Quarter 3 due to the lower export log prices. Most mills will start to get more discerning over the quality of log they receive as the economic returns between the sawn timber grades is widening. The larger pruned and structural grades are selling well but marketing the rest of the log is a struggle.
The domestic market for sawn timber has remained stable with settled weather through May. The start of the winter season will see demand drop in some sectors. We are seeing more finger joint, mouldings and other remanufactured products being imported from China and this will place pressure on supply.
Export Log Markets
China
Total softwood log stocks across China have reduced slightly from last month to around 3.8 million m3. Daily uplift from the ports is averaging about 78,000 m3 per day so demand is still reasonably healthy. Construction activity in China has started to slow with the start of the hottest months of June and July. Most industry commentators expect the China government to introduce some stimulation spend into the construction market, but it will take a few months before the effect is felt in the log market.

- The CFR sale prices for pine logs in China dropped a further -US$4-6 through May and the A grade sale price is now around US$130 per JASm3.Supply of softwood logs from other countries continues to reduce. Logs from the US have been hit with further tariffs of up to 25% introduced by China’s Ministry of Finance on June 1st within the Harmonized Tariff Schedule (HMS). The Southern Yellow Pine (SYP) from the South East of the US had already significantly reduced and is now just a trickle of container volume. There has been more volume from the Pacific North West, but this is now expected to slow considerably.Many harvesting operations in South America have stopped and this will also reduce softwood supply into China. Current stocks in China are being heavily discounted in an effort to move this stock before the hot sticky season in China. The smaller sized South American softwood logs are more perishable than the New Zealand pine logs.India
The Indian market for New Zealand pine logs has held up better and not completely followed the China CFR trend. The CFR price for ‘A grade’ New Zealand pine logs is US$147 to US$150 per JAS m3. The INR has traded consistently between Rs 69.4 to RS 70.0 for 1 USD. Domestic prices for sawn New Zealand pine are Rs 511/CFT in Kandla and Rs 511/CFT in Tuticorin. Demand is lower in Tuticorin.
Low inventories due to low volume of shipment from New Zealand to India has kept the market price relatively firm. In March, April and May only three break bulk vessels per month were shipped. The arrival of a vessel with Uruguay pine is expected around mid-June, and there is a bit of anxiety around penalty on fumigation on arrival and the quality of the cargo.
South African pine is consistently supplied at 10,000 m3 per month in containers between Kandla, Tuticorin and Calcutta. It is priced at US$135 per tonne for P40 (pruned with a 40 cm small end diameter) and US$135 per tonne for A Grade. Due to problems of fungus and log quality it does not have a significant impact on the New Zealand pine log market.
SYP from the US is holding at US$123 for 12” minimum and US$118 for 10” minimum.
The previous government was re-elected with a resounding majority and that significantly reduced any potential for market volatility. It should augur well for the construction sector as many of the projects and initiatives of the government can continue unabated. The Indian Government is also expected to announce initiatives to lure Foreign Institutional Investors (FIIs) into real estate and the construction sector to boost the economy.
The only macroeconomic negative is that the recent Indian GDP growth figures of 5.8% are much lower than the expected 6.5%. The banking industry corrections with tougher rules around availability of bank funding for business has had an impact. One of the major log exporters of New Zealand pine to India, Aubade New Zealand Ltd, believe that the correction phase is almost completed, and the coming year should see better business prospects. The Indian Reserve Bank is reducing the key policy rate to spur domestic growth and private investment and the results will be visible in the second half of this year. They predict public sector banks will adopt a more conservative less helpful approach whereas private banks will step-up to lend to businesses.
Exchange rates
The New Zealand Dollar (NZD) weakened against the United States Dollar (USD) through May and this partially buffered New Zealand forest owners from the falling CFR log prices in China. The NZD has recently strengthened against the USD. As stated last month and worth reiterating, how the NZD and the CNY fare against the USD over the next couple of months will have a significant impact on AWG prices at New Zealand ports.
 Ocean FreightOcean freight rates from New Zealand to China have increased +US$2-3 for vessels on shorter term charter. Congestion at New Zealand ports is adding costs of up to +US$2-3 per JAS m3 at times. There is often 6-8 log vessels waiting at Tauranga Port for a berth. Freight rates to India have been relatively stable with rates holding at US$34-36 per JAS m3.
- Source: Investing.comThe bunker prices have also peaked and show a downward trend, with a slight recent increase.Singapore Bunker Price (IFO380) (red line) versus Brent Oil Price (grey line)
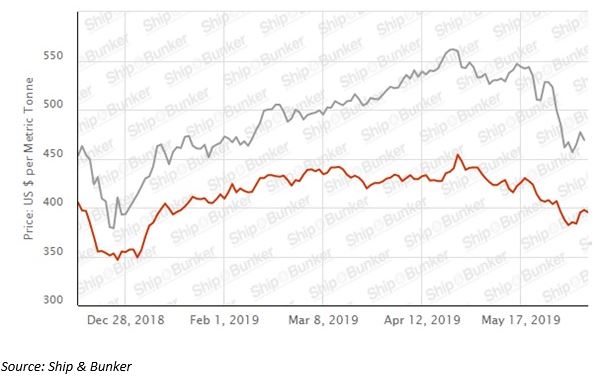
- The Baltic Dry Index (BDI) is a composite of three sub-indices, each covering a different carrier size: Capesize (40%), Panamax (30%), and Supramax (30%). It displays an index of the daily USD hire rates across 20 ocean shipping routes. Whilst most of the NZ log trade is shipped in handy size vessels, this segment is strongly influenced by the BDI.The graph of the BDI over the last year below shows the recent increase in the BDI. (The handysize is about 35% of the global shipping fleet). As mentioned in Wood Matters last month this increase in the BDI is an indication that raw materials are growing in demand around the world, but not in the handysize vessels that are predominantly used to cart logs.
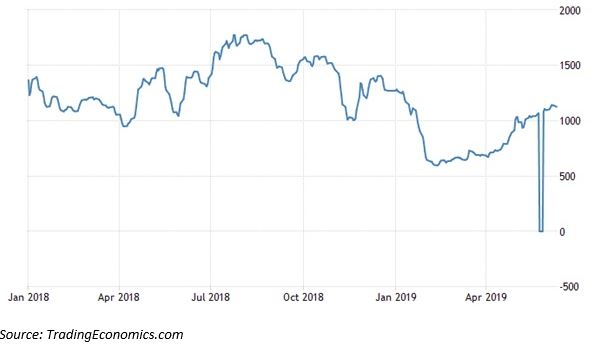 Due to the drop in the AWG log prices the PF Olsen Log Price Index for June decreased $2 to $128. The index is currently $1 below the two-year average, $2 above the three-year average, and $10 higher than the five-year average.
- Basis of Index: This Index is based on prices in the table below weighted in proportions that represent a broad average of log grades produced from a typical pruned forest with an approximate mix of 40% domestic and 60% export supply.
- Taiwan Economic OutlookJune 18, 2019
Growth decelerated slightly in Q1, following Q4 2018’s already feeble showing. Weaker domestic demand was behind the print, as private consumption growth ticked down while government consumption contracted. On the flipside, investment growth picked up thanks to a solid rebound in private investment. Meanwhile, though export growth slowed, imports decelerated faster, leading to an improved contribution to headline growth. Looking at Q2, PMI data for April-May suggests the manufacturing sector remains weak amid low tech demand and the shadow of the trade war. This is confirmed by a further contraction of export orders in April and of exports in May, indicating external sector weakness will likely continue beyond Q2. Moreover, Taiwan is very vulnerable to potential U.S. tariffs on Chinese tech products, even though it could benefit somewhat from manufacturing firms repatriating production from mainland China. (Please note that I clipped the tables out of this article to reduce the length. If you want to see the tables, please refer to: https://www.interest.co.nz/rural-news/100233/price-drops-china-logs-decrease-less-india-some-export-sawn-timber-products
Taiwan Economic Growth
Growth will likely slow this year due to trade uncertainty and lower tech demand. The possible imposition of U.S. tariffs on Chinese tech imports is a key downside risk as Taiwan is heavily involved in the Chinese electronics supply chain. Nevertheless, public infrastructure investment, coupled with low unemployment and inflation, should support domestic dynamics. Focus Economics panelists forecast GDP growth of 2.0% in 2019, which is down 0.1 percentage points from last month’s forecast, and 2.0% again in 2020.

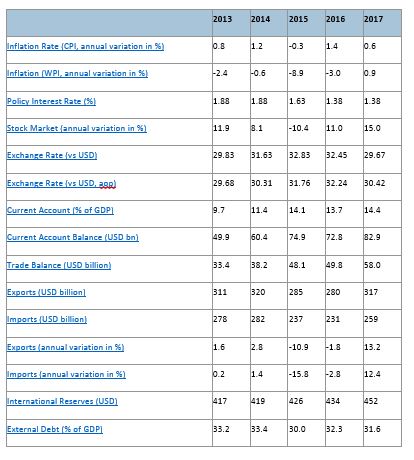
- FDI flows into emerging markets fall to lowest levels since 1990sSlowing globalization and weaker economic growth blamed for pullback

- Foreign direct investment in emerging markets has plunged to its lowest level this century as mounting trade tensions build on weakening economic growth in the developing world.FDI, which involves buying companies and building new facilities, fell to just 2 per cent of gross domestic product across emerging and frontier markets last year, according to the Institute of International Finance, which tracks cross-border capital flows. This compares with a peak of 4.4 per cent in 2007, immediately prior to the global financial crisis, as the first chart shows.

- The trend, which could further sap weakening economic growth in emerging markets, plays into a narrative of declining globalization at a time when growth in global trade is also juddering to a halt.“FDI fell particularly strongly last year as trade policy uncertainty escalated, but also as part of a broader retrenchment of all types of capital flows in the context of the spike of risk aversion, especially in the fourth quarter,” said Guillermo Tolosa, economic adviser at Oxford Economics, a consultancy.
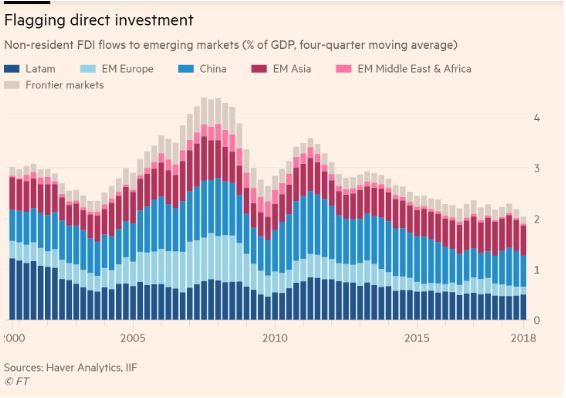
- Murat Ulgen, global head of emerging market research at HSBC, who forecast FDI flows would tumble to just 1.5 per cent of EM GDP this year, added: “Given the lingering concerns about global economic activity on the back of rising trade tensions, FDI flows are likely to remain weak in 2019.”Sergi Lanau, deputy chief economist at the IIF, believed a series of factors had conspired to cause a “secular decline” in FDI in emerging markets since the financial crisis, whether measured in traditional terms or in “true” terms — stripping out reinvested earnings to focus on “new” investment flows — a metric the IIF prefers, illustrated in the second chart.
First, rising commodity prices boosted investment in mining FDI, “which in some countries accounts for a very large share of total FDI,” in the immediate aftermath of the crisis. However, this has fallen back, in line with commodity prices.
Second, Mr Lanau said the 2000s “were a period of strong growth for developed market banks, which invested heavily in subsidiaries in EM”. However, “the world looks very different now for banks,” he added.
Third, significant house price increases in emerging markets between 2003 and 2007 led to a rise in real estate based FDI, “a major category in many countries”.

- All three factors “have a lot to do with a period of exuberant asset prices across the board in the run-up to the global financial crisis,” Mr Lanau said, while “years of quantitative easing and low interest rates have encouraged hot money flows to EM,” giving an advantage to portfolio investment over FDI.“It is not clear to me that these factors are set to reverse any time soon. If anything, growing trade tensions and nationalist political forces around the world will make a turnaround in FDI to EM more difficult,” he added.
Mr Tolosa argued there was a strong correlation between FDI inflows into emerging markets and the degree to which EM economic growth outstrips that of the developed world, a differential that has tumbled from 6.1 percentage points in 2009 to just 2.3 points last year, shown in the third chart.
- Well thanks for wading through this quarterly news blog sampling The Donald Parallel Universe-Happy Summer Everyone!
 By
By