Canada Housing News
Canada’s housing market ‘inching towards instability,’ U.S. bank warns
Michael Babad
The Globe and Mail
Published Monday, May 02, 2016 6:24AM EDT
Last updated Monday, May 02, 2016 9:50AM EDT
Briefing highlights
- Housing market overheating, bank warns
- Global markets on the rise
- Australian says he’s Bitcoin founder
- Video: How to say no to more work
Risks mount, bank warns
A big U.S. bank is warning that Canada’s housing market is “inching towards instability” amid low interest rates and a lack of listings.
The recent report by Emanuella Enenajor, the North America economist at Bank of America Merrill Lynch, is yet more evidence of the frothy nature of some markets, though she’s not warning of a crash.
Ms. Enenajor also said she expects further action by the federal government to cool things down.
An independent panel investigating misconduct by B.C. real estate agents is calling for stiffer fines to a maximum of $250,000 for individuals and $500,000 for brokerages. The current maximums are $10,000 and $20,000, respectively.
“These will be applied for when individual agents or firms do not treat a consumer fairly,” Carolyn Rogers, B.C.’s superintendent of real estate and panel leader, told a Tuesday morning news briefing that released a long-awaited report.
Critics, however, zeroed in on the problem of continuing to allow the Real Estate Council of B.C., which oversees the industry, to be self-regulated, which it has been since 2005.
NDP housing critic David Eby said the council already had the necessary tools to fine and pull the licences of unscrupulous agents.
To date, fines and suspensions have been rare. Most disputes are settled through consent orders, where an agent admits misconduct and proposes a settlement. In 2014-15, the council received 536 complaints and issued 88 consent orders.
There was only one disciplinary hearing, which happens when agents don’t admit misconduct, and just two qualification hearings. The numbers going back to 2012 are about the same with actual hearings in the single-digits.
“There is a culture of protecting realtors instead of protecting the public that needs to change,” Eby said.
Tuesday’s announcement follows widespread outcry over unsavoury practices — including so-called shadow flipping and double-ended deals — that take advantage of buyers and sellers in an “unprecedented” hot market for an agent’s own gain.
“The current regime was set for transactions of homes, not investments,” said Rogers. “Houses are no longer just homes. They are investments and this has put pressure on a regime that has not changed.”
Fines for administrative infractions such as late filing or breaches in record-keeping will be raised from $1,000 to $50,000.
In addition, the report calls for the “disgorging” of any gains fraudulently obtained by an agent to be returned to a client in a process that would involve the courts, said Rogers.
Critics and experts, mindful of the immense commissions and bonuses made by agents in a single deal, have been pushing for agents found guilty of fraud to pay back any money instead of merely facing a maximum fine.
The 64-page report — months in the making — contains 28 main recommendations. Of these, 21 were directed to the Real Estate council, a self-regulating organization, and seven to the government.
Currently, there is a blurring of responsibilities and reporting lines that has hampered whistle-blowing. Public complaints about agents often get taken to B.C.’s private real estate boards because they run and control access to the proprietary Multiple Listing Service, a database that holds information essential for any agent conducting business.
Some of these, including the Greater Vancouver real estate board, have, in recent months, increased their maximum fines. But their investigations or disciplinary decisions remain private so it has not been possible to see how they have been handled, if at all, in some cases.
The report calls for the council to be the single regulator of licensed and unlicensed real estate services.
Rogers said the panel’s focus was “on improving the regulatory regime … We did not spend many hours debating if self-regulation should exist … We focused on how to make it better.”
To this end, it says the council should increase the number of its publicly-appointed members who are not members of the real estate industry from three out of 17 to 50 per cent.
The report also calls for an end to the practice of dual agency, whereby an agent acts for both a buyer and a seller in the same transaction.
In general, Rogers said that rules on such practices exist, but they are “too abstract” and “spread all over the place,” making it difficult for the public and agents to understand what is to be expected. “Conflicts of interest are not always clearly disclosed or in a way that is easily understood by consumers.”
Key to this, she said, is that important consumer information is currently being developed by the industry instead of the council. As well, “more needs to be done by the council to deter aggressive marketing on vulnerable consumers,” said Rogers. “Seniors or new immigrants with limited language facilities need to be protected against being targeted.”
The report also calls for purchase offers to be retained at brokerages in order for consumers in multiple-offer situations to have confidence that prices are not being falsely bid up by real estate agents.
It also recommends that new rules on the assigning of sales contracts be extended beyond just requiring a seller’s consent to covering “all forms of contract for trades in real estate.”
The panel “is concerned that (if these new) contract assignment requirements only apply to transactions facilitated” by agents, there may be “the unintended consequence of driving the practice of ‘shadow flipping’ to an unregulated part of the market, for example, ‘for sale by owner’ business enterprises.
Eby said: “It is an incredibly damning report into a failed regulator. … The recommendations themselves are just that. And no member of the public should take confidence from the fact that recommendations have been made.”
Port Coquitlam Coun. Brad West, who has voiced concerns, in particular about brokerages who have been placed under strict conditions by the council and yet continue to aggressively market their services in his community, said: “The attention now turns to the provincial government. They have some important decisions to make and I hope they are listening to the voices of British Columbians who are clearly calling for significant change, not tinkering around the edges.”
In the meantime, the Real Estate council’s first step has been to appoint one of its members, David Peerless, a senior owner of Vancouver-based Dexter Associates Realty since 1989, to take the panel’s recommendations and begin implementing them. He will form his own task force in the next weeks and is accountable to the council.
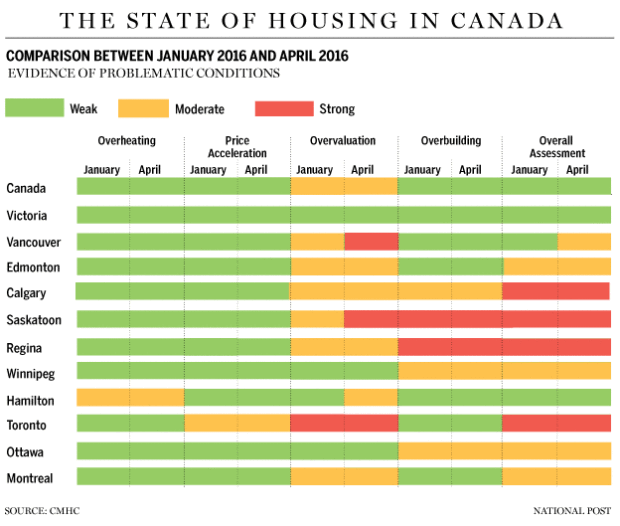
Housing markets differ across the country, of course. But, as The Globe and Mail’s Tamsin McMahon reports, the national housing agency threw up cautionary flags for several in a quarterly report last week.
“Canada’s housing market is overheating,” Ms. Enenajor said.
“House prices have reaccelerated along with mortgage credit outstanding. This is the result of a low-rate policy both domestically and abroad and a lack of adquate supply to satiate demand.”
Ms. Enenajor’s report is in-depth, tracking everything from foreign buyers in the hot Vancouver and Toronto markets to job losses in the hard-hit resource provinces.
Of note, she said that, while the market may be overheating, there’s not a construction boom, as others have suggested.
And, perhaps more importantly, she noted that “it’s different this time” because the Federal Reserve is in the midst of gradually raising interest rates.
“Economists and investors have become numb to signs of housing excess, as the sector has defied gravity for years,” Ms. Enenajor said.
“However, as the Fed gradually exits its accommodative policy, medium-term rates in Canada could also rise.”
This, she warned, heightens the threat of a correction in Canada’s housing market.
“Thus, the Bank of Canada is unlikely to raise rates over the next few years as this could exacerbate housing market weakness,” she said.
“We expect a regulatory response via tighter mortgage lending rules, but only once the economy has stabilized from the oil shock. In the meantime, house prices will likely continue to accelerate.”

“Foreclosure tours” became a thing in many U.S. housing markets following the housing bust. Here, a sign for a tour can be seen outside a home for sale in Las Vegas, Nevada, U.S., on Thursday, Aug. 6, 2009. (Photo: Ronda Churchill/Bloomberg via Getty Images)
Canadian Housing Crash Would Cost Banks Billions: Moody’s
The Huffington Post Canada | By Daniel Tencer
Posted: 06/20/2016 12:53 pm EDT Updated: 06/20/2016 2:59 pm EDT
The situation in Canada looks similar to that in the U.S. before its housing bubble burst in 2008, says Moody’s Investor Service — but Canada’s banks would be better able to withstand the shock of a price downturn.
The report from the ratings agency is the latest sign the financial elites are growing seriously worried that a housing bubble and a consumer debt crisis is brewing in Canada, and are now willing to entertain the notion openly.
Moody’s tested a scenario in which house prices fell by 35 per cent in Ontario and British Columbia, and by 25 per cent elsewhere. It found that the direct losses to banks would be nearly $18 billion.

The headquarters of Royal Bank of Canada, Bank of Montreal, CIBC and Scotiabank can be seen in the Toronto skyline. (Photo: Victor Korchenko via Getty Images)
“While Royal Bank of Canada would suffer the largest absolute loss under Moody’s severe stress scenario, CIBC’s capital is most at risk owing to its operational focus on Canadian retail lending,” the ratings agency said.
Though market analysts consider a 35-per-cent house-price decline to be disastrous, it’s worth noting that if one happened today it would only bring back Vancouver house prices to last year’s levels, and Toronto prices roughly to where they were two to three years ago. House prices are up some 30 per cent in Vancouver and roughly 15 per cent in Toronto over the past year alone.
That rapid growth has strained homebuyers in Ontario and British Columbia, Moody’s noted.
“Over the past decade, Canada’s mortgage debt outstanding has more than doubled, with the index of house prices to disposable income increasing 25 per cent in the same period; faster than comparable [developed] countries. The country’s household debt levels have tracked closely with this increase, raising concerns of overvaluation and over-extended borrowers.”
Still, even a “significant structural differences” between U.S. and Canadian banking.
For one, there is less subprime lending (or lending to riskier borrowers) going on in Canada, although the practice is on the rise here.
Additionally, the CMHC directly guarantees $700 billion of Canadians’ mortgage debt, Moody’s noted. Statistics Canada’s latest numbers show there is nearly $2 trillion in mortgage debt in Canada today.
Finally, Moody’s noted, lenders here don’t lend specifically to sell off the mortgages as securities, a practice that was blamed in part for the U.S. housing crash.
Consumer debt crisis warnings
Moody’s is not the only financial institution that’s taking the possibility of a major housing correction in Canada seriously.
Scotiabank CEO Brian Porter earlier this month said he was “worried” about the rapid house price growth in Toronto and Vancouver, and noted his bank has pulled back on lending in those cities.

On household debt, Canada has gone from being middle of the pack to leading the G7. (Chart: PBO)
Earlier this year, the Parliamentary Budget Office warned that Canadians could face a debt crisis by 2020 if interest rates were to begin rising.
“Among G7 countries, Canada has experienced the largest increase in household debt relative to income since 2000,” the PBO said in a report issued in January.
“Households in Canada have become more indebted than any other G7 country over recent history.”
Experts say rising interest are inevitable in the coming years, given they have been plumbing record lows recently. The Bank of America estimates that rates worldwide are at their lowest in at least 5,000 years.

Shoppers carry bags on Bloor St. in Toronto. (Fred Lum/The Globe and Mail)
Canada’s household debt holds near record; growth moderates
David Parkinson – ECONOMICS REPORTER
The Globe and Mail
Published Tuesday, Jun. 14, 2016 8:59AM EDT
Last updated Tuesday, Jun. 14, 2016 11:01AM EDT
Canadian households’ debt burden remained near record levels in the first quarter of this year, as debt growth moderated from the brisk pace of 2015, Statistics Canada reported.
The statistical agency said the household credit market debt-to-disposable-income ratio, the benchmark measure for the average household’s debt burden, was 165.3 per cent in the first three months of 2016, down slightly from the record 165.4 per cent in the final quarter of 2015.
Three signs you have a debt problem (The Globe and Mail)
Total credit market debt (mortgages, consumer credit and non-mortgage loans) rose to a record $1.93-trillion, but was up just 0.5 per cent from the prior quarter, the smallest increase in a year, and much slower than the average quarterly rise of 1.6 per cent over the previous three quarters. However, household disposable income also grew at only a modest pace in the quarter, keeping the debt-to-income ratio near its record high.
The first quarter is typically slow for household debt growth, as consumers recover from their holiday-season spending. Statscan said mortgage debt grew 0.7 per cent in the quarter, its slowest in a year, while consumer credit (such as credit cards, car loans and lines of credit) declined 0.3 per cent, its first drop in a year.
The household debt numbers come amid a recent rising tide of public concern about mortgage debt from many quarters, including recent comments from the International Monetary Fund, the Bank of Canada and Finance Minister Bill Morneau, as home prices continue to surge dramatically in the big Vancouver and Toronto markets. In a separate report Tuesday, the closely watched Teranet-National Bank home price index showed that nationally, home prices in Canada rose 1.8 per cent in May from April.
The report said Vancouver posted its 17th consecutive month with a new record high. On an annual basis, Vancouver prices are now up almost 22 per cent, with Hamilton, Victoria and Toronto ringing up gains of 13.8 per cent, 10.8 per cent and 10.6 per cent, respectively. But in most other major centres of the country, home prices are flat to lower year over year.
“The dichotomy continues on the Canadian home resale market,” said National Bank of Canada economist Marc Pinsonneault in a research note.
Statistics Canada said that mortgage liabilities, as a share of total household credit market debt, rose to 65.6 per cent in the first quarter – extending the streak of consecutive quarterly increases that began six years ago.
Statscan also noted that the household debt service ratio – which measures monthly principal and interest payment obligations relative to disposable income – rose to 14.8 per cent in the first quarter, from a reported 13.8 per cent in the previous quarter.
But thanks to rising home prices, total household net worth rose 1.2 per cent quarter over quarter, to a record 9.63-trillion, or $266,900 for every man, woman and child in the country. The ratio of household debt to net worth dipped slightly to 20.3 per cent from 20.5 per cent in the 2015 fourth quarter – a ratio that has been trending generally downward for the better part of five years.
“Debt accumulation is being underpinned by increasingly large mortgages in Vancouver and Toronto, where home prices are rising at a rapid pace against a backdrop of low interest rates and solid economic fundamentals,” said Royal Bank of Canada economist Laura Cooper in a report. “The risks emanating from household financial stress bear close watching, although there is little evidence of deterioration at this stage – stable debt service costs, low mortgage arrears and buoyant home valuations are supporting asset values.”
With a report from Michael Babad
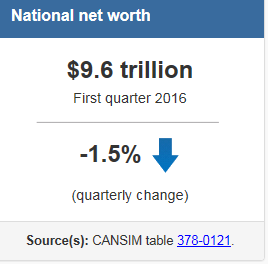
National balance sheet and financial flow accounts, first quarter 2016
Released: 2016-06-14
(quarterly change)
Source(s): CANSIM table 378-0121 |
(quarterly change)
Source(s): CANSIM table 378-0121. |
National net worth declines as Canada’s net foreign asset position weakens
National net worth declined 1.5%, or $144.7 billion, to $9,571 billion at the end of the first quarter. This was mainly due to a decrease in the market value of financial assets held abroad, as Canada’s net foreign asset position fell in the first quarter. On a per capita basis, national net worth was $265,200 compared with $269,500 in the fourth quarter.
National wealth, the total value of non-financial assets in the Canadian economy, rose $75.6 billion to $9,306 billion at the end of the first quarter. The main contributor to growth was a $105.2 billion increase in the value of real estate. This was partially offset by a $36.0 billion decline in the value of natural resource wealth, as energy prices continued to decrease.
Canada’s net foreign asset position fell $220.2 billion in the first quarter to $264.8 billion. This decline more than offset the $201.7 billion gain recorded in the fourth quarter. Canada’s international assets were down in the first quarter, while international liabilities edged up. The appreciation of the Canadian dollar, combined with the stronger performance of the Canadian stock market relative to foreign stock markets, mainly contributed to the drop in the net foreign asset position.
Chart 1 Changes in national net worth

Household sector net worth at market value rose 1.2% in the first quarter to $9,633 billion. On a per capita basis, household net worth was $266,900. Financial assets increased 0.7%, the weakest first quarter growth since 2009. Driven by gains in the value of real estate, the growth of non-financial assets (+1.5%) outpaced that of financial assets. As a result, the ratio of financial assets to non-financial assets decreased to 111.4%. Overall, the value of household assets rose $122.3 billion, while liabilities grew $9.0 billion; the ratio of household debt to total assets edged down to 16.9%.
Total household credit market debt (consumer credit, and mortgage and non-mortgage loans) reached $1,933 billion at the end of the first quarter. Consumer credit was $573.1 billion, while mortgage debt stood at $1,268 billion. The share of mortgage liabilities to total credit market debt reached 65.6% at quarter end, continuing an unbroken upward trend that began in the first quarter of 2010.
The ratio of household credit market debt to disposable income (excluding pension entitlements) was little changed in the first quarter, edging down to 165.3%. In other words, households held $1.65 in credit market debt for every dollar of disposable income. Disposable income and household credit market debt increased at nearly the same rate.
The household debt service ratio, measured as total obligated payments of principal and interest as a proportion of disposable income adjusted to include actual interest paid, increased to 14.8% in the first quarter. The interest-only debt service ratio, defined as household mortgage and non-mortgage interest paid as a proportion of disposable income, was 6.6% in the first quarter.
On a seasonally adjusted basis, households borrowed $24.4 billion in the first quarter, up $0.5 billion from the previous quarter. Mortgage borrowing represented $17.5 billion of total borrowing in the quarter, down from $20.7 billion in the previous quarter, while borrowing in the form of consumer credit and non-mortgage loans was $6.9 billion, up from $3.2 billion.
Chart 2 Household sector leverage indicators

Federal government net debt to gross domestic product edges up
The ratio of federal government net debt (book value) to gross domestic product edged up to 30.9% in the first quarter from 30.8% in the fourth quarter. The ratio for other levels of government was up slightly from the previous quarter to 29.0%, continuing an upward trend that began in late 2008.
The federal government recorded $9.1 billion in net retirements of Canadian short-term paper in financial markets in the quarter, which was offset by $9.6 billion in net issuances of bonds and debentures.
Other levels of government borrowed $7.9 billion on financial markets during the quarter. The bulk of borrowing was $13.3 billion in net issuances of Canadian bonds and debentures, but this was partly offset by $5.6 billion in net retirements of Canadian short-term paper.
Chart 3 Net debt (book value) as a percentage of gross domestic product

Non-financial private corporations’ borrowing slows from fourth quarter
Non-financial private corporations borrowed $3.9 billion worth of funds in financial markets in the first quarter, down sharply from $26.2 billion in the previous quarter and representing the lowest value since the fourth quarter of 2011.
On a book value basis, the credit market debt to equity ratio of non-financial private corporations was down in the first quarter, following four consecutive quarterly increases. There was 68 cents of credit market debt for every dollar of equity at quarter end.
Chart 4 Private non-financial corporate credit market debt-to-equity ratio (book value)

Foreign equities reduce the value of financial corporations’ assets
Overall, the financial sector provided $21.7 billion of funds to the economy through credit market instruments, down from $48.2 billion in the previous quarter. The funds provided in the first quarter were mainly in the form of non-mortgage loans ($15.7 billion), bonds and debentures ($14.8 billion), and mortgages ($11.5 billion). Financial corporations recorded net redemptions of Canadian short-term paper ($15.2 billion).
The value of financial assets of financial corporations decreased $45.8 billion at the end of the first quarter to $12,133 billion. The principal contributor to this decrease was a $73.3 billion decline in the value of foreign equities, as the Canadian dollar had appreciated by the end of the first quarter.

IMF housing heat map shows Canadian household debt scorching
Michael Babad
The Globe and Mail
Published Tuesday, Jun. 14, 2016 5:17AM EDT
Last updated Tuesday, Jun. 14, 2016 11:40AM EDT
Briefing highlights
- IMF warns on Canadian home prices
- Real estate driving up net worth
- Home prices in Vancouver, Victoria, Toronto, Hamilton surging
- German yield goes negative for first time
- Brexit fears roil markets again
- A James Bond movie poster I’d love to see
- Video: Why rudeness at work is contagious
IMF warns on housing
The International Monetary Fund is warning policy makers they may have to take action that would cool Canada’s hot housing markets and ease the consumer debt binge.
It’s not the first time that the IMF has issued such an alert. For that matter, such warnings have been pouring in from far and wide amid a surge in home prices in Vancouver and Toronto and their surrounding regions.
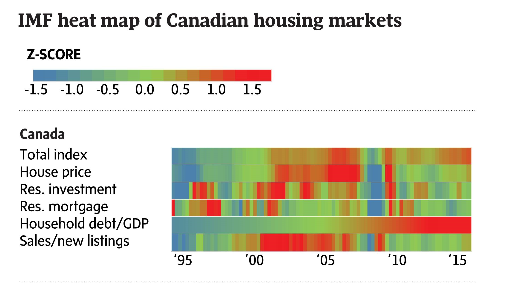
What’s different in the report released by the IMF this week is an interesting heat map that looks at housing markets across Canada, measuring everything from prices to listings.
Consistent across the country is the red – make that red hot – on the reading of household debt to gross domestic product.
Murat Yukselir/Globe and Mail
“The weaker economy has reignited concerns about the elevated level of household debt and divergent trends in house prices, which are rapidly rising in Vancouver and Toronto and falling in Alberta,” the IMF said in its look at Canada’s economy.
The challenge, it added, is to strike a “policy mix” that spurs economic growth while ensuring a housing bubble doesn’t pop.
This would suggest government intervention rather than ratcheting up interest rates, a move that could tame the mortgage binge but at the same time threaten an already fragile economy.
“Macro prudential policy can be further tightened if imbalances in the housing market threaten to intensify,” the IMF said.
There’s fresh evidence today on both the debt and housing fronts. And notable is how surging home prices are driving consumer wealth higher.
On a per-capita basis, according to Statistics Canada, household net worth stood at $266,900 in the first quarter, boosted by real estate.
Having said that, total household credit hit $1.9-trillion, largely because of swollen mortgage debt of $1.3-trillion.
The key measure of debt to disposable income, the agency said, inched down but still sat at an elevated 165.3 per cent, or $1.65 in debt for each dollar of disposable income.
Today’s numbers came at the same time as a separate report showed home prices in Canada rose 1.8 per cent in May from April, and in all of the markets measured.
And get this, according to the Teranet-National Bank home price index: “For Vancouver it was the 17th consecutive month without a decline, the index setting a record each time.”
On an annual basis, Vancouver prices are now up almost 22 per cent, with Hamilton, Victoria and Toronto ringing up gains of 13.8 per cent, 10.8 per cent and 10.6 per cent, respectively.
US HOUSING NEWS

Contractors secure a wall section on a home under construction at the Toll Brothers Inc. Cantera at Gale Ranch housing development in San Ramon, California
Homebuilder blues: Don’t blame labor shortage
Diana Olick | @DianaOlick
Tuesday, 19 Apr 2016 | 10:00 AM ET
Home construction weakened in March, and homebuilder sentiment hasn’t budged in three months — all this in the heart of the historically strong spring housing market. The common complaint from builders is that they are hamstrung by a lack of skilled labor, which is keeping production levels low.
That may have been a factor for the past several years, but today it is less and less a plausible excuse.
“Our analysis of payroll growth and wage inflation data suggests that labor shortages may not be to blame for the mediocre level of housing activity,” Goldman Sachs analysts wrote in a report this week. “We find that, on the one hand, the construction sector has experienced the largest job growth over the past year.”
Construction growth has led all other sectors at 5 percent, according to the Bureau of Labor Statistics, but average hourly earnings in construction gained only 2.2 percent over the past year, which is about the national average.
“Economics 101 would suggest that, if labor shortages did in fact exist, upward pressure on wages would be more pronounced and payroll growth would be anemic,” the report said. “Therefore, the evidence from the industry-level employment and wage data does not support the existence of labor shortages in the construction sector.”

David Paul Morris | Bloomberg | Getty Images
.
Instead they point to delays in permit issuing and land scarcity. A survey of 100 builders nationwide by John Burns Real Estate Consulting backs that thesis. They asked about costs that didn’t exist 10 years ago, and found high levels of builder frustration, not just from labor, but from cost overruns stemming from new regulations for house erosion control, energy codes and fire sprinklers. They also cited understaffed planning and permit offices as well as utility company delays.
“New regulations to protect the environment and to shore up local city finances have made it extremely difficult for home builders to build affordable homes,” the Burns analysts wrote. “Now, more than ever, the demand for affordable entry-level housing will need to be met by the resale market, since new homes have become permanently more expensive to build. We were overwhelmed by the reply as well as the builders’ level of frustration.”
Homebuilders take a ‘beating’ from lack of labor
Homeownership no longer a tax break
›Builders are also seeing a shortage of buildable lots, as demand persists for land closest to urban areas. Those lots come at a premium, which makes it harder for builders to see profit on them. Development of infrastructure for land also slowed dramatically during the recession and is only now starting to ramp up again.
“Right now I’m not having a labor problem,” said Stephen Paul, executive vice president of homebuilding operations at Maryland-based Mid-Atlantic Builders. “And we’re having our best year in 10 years. I’m busy, but I don’t want to hire because I’m afraid. We don’t know if the market is sustainable. It’s been 10 years and we’re still looking for a serious recovery.”
Paul said he is, however, suffering from a lot of plan changes. He said getting plans approved is a nightmare.
“When a builder has 25 changes or more, that’s a lot of work to get the plans up to the new code,” he said.
There is a labor crunch, though, in some parts of the country, more so in the West, as a considerable number of the construction workers who left during the recession still have yet to return.
The average age of a construction worker today is far higher than it was during the housing boom, Michelle Meyer, deputy head of U.S. economics at Bank of America Merrill Lynch Global Research, said Tuesday on CNBC’s “Squawk Box.” Builders need to attract younger workers, but they seem, so far at least, unwilling or unable to pay them more.
http://dwc.cnbc.com/48oOw/?fs=1

The US faces significant labour shortages in a wide range of sectors as unemployment falls towards 4 per cent and the working-age population stagnates, a leading business association has predicted.
With the time needed to fill a job already near the highest in at least 16 years and the number of people voluntarily leaving jobs at its strongest since the recession, difficulties finding skilled labour will intensify, pushing up wages and squeezing corporate profits, the Conference Board said in a report.
More
On this topic
IN US Economy
Barring a recession, joblessness should fall another point compared with its 5 per cent rate now, and wage growth will be running at 3-3.5 per cent in 2017, a percentage point higher, said the board.
A lengthy list of lines of work that will show significant shortages includes occupational therapists, nurses, plant operators and machinists, and the states with the tightest labour markets include Texas and Colorado.
“We are already very close to full employment, yet we have this trend of very slow growth of labour supply for the next 15 years, and there is very little that could be done about it barring major immigration reform,” said Gad Levanon, chief economist, North America at the Conference Board. “The implication of that is it is harder to find workers, and there is more acceleration in labour costs.”
While demand for workers has been sufficient to lure some Americans off the sidelines and into work, the steady exit of ageing baby boomers from the workforce is likely to weigh on the labour force participation rate over the longer term. From the perspective of employees the trends are good news, Mr Levanon added, because they should mean pay increases faster.
The US jobs market has tightened steadily even as growth in gross domestic product remains lacklustre, presenting a conundrum to Federal Reserve policymakers as they consider the next move in interest rates. One question Janet Yellen, the Fed chair, and her colleagues are trying to answer is how much hidden slack there is in the workforce — for example, people working part-time because they cannot find a full-time job.
Slow wage growth suggests that considerable slack remains, but some measures of wage growth are starting to stir. The Fed’s so-called Beige Book survey last week reported that the firming labour market was starting to deliver higher wages in nearly every region of the US.
Some employers are lifting entry level wages, and states including California and New York are aggressively boosting minimum wages to well above the federal minimum of $7.25 an hour.
Analysis from Goldman Sachs this week estimated that labour costs as a share of S&P 500 companies’ revenues rose to 9.8 per cent last year compared with 9.1 per cent in 2014, and were set to jump further.

The cost of college
Delayed gratification
Home-owning is falling among young adults, but don’t blame student debt
Apr 23rd 2016 | NEW YORK | From the print edition
A COLLEGE degree has never been more necessary: graduates earn, on average, 80% more than high-school graduates. Yet ever more Americans are taking on serious debt in exchange for that diploma. Between 2004 and 2014, student-loan balances more than tripled to nearly $1.2 trillion. The average debtor leaves college owing around $27,000.
Some of this mounting debt is good news. More Americans are going to college—undergraduate enrolment rose by nearly 40% between 2000 and 2010, according to the National Centre for Education Statistics. Many are also staying around for a second degree. But the cost of college has also risen sharply, as state spending on higher education has plummeted. Average tuition fees have surged 40% in the decade to 2015-16 for full-time students at public four-year colleges, and 26% at private ones. Those who take longer to graduate—as many increasingly do—simply rack up more loans.
Outstanding student loans are now second only to mortgages when it comes to household debt in America. This makes some economists worry about their macroeconomic effects. Though the housing market has been steadily recovering, the share of first-time buyers continues to decline, and is now at its lowest point in nearly three decades, according to the National Association of Realtors. The home-ownership rate among 30-year-olds has been tumbling, but the fall has been especially fast among those paying off student loans, according to the New York Fed.
So are the soaring costs of college keeping Millennials from starting households of their own? Not according to a new paper from Jason Houle of Dartmouth and Lawrence Berger of the University of Wisconsin-Madison. Using longitudinal data on college-going Americans who were aged between 12 and 17 in 1997, the authors found that student-loan debtors were in fact more likely than non-debtors to own a house by the age of 30. But this was mostly because debtors tended to be older, employed, married and with children, and the debt was largely irrelevant.
Others have found that student debt may delay home-ownership, but does not deter it entirely. In an analysis of data from the National Educational Longitudinal Survey, Daniel Cooper and J. Christina Wang of the Federal Reserve Bank of Boston noted that young debtors were less likely to own a home than their debt-free peers. Yet when the authors confined their analysis to college graduates, they found that debtors in their late-20s were more likely to own a home than non-debtors. So the reason for the delay in home-buying among those with student loans seems to have been that many had dropped out before earning their degree.
The decline in young home-owners seems to be part of a larger trend of deferring the conventional trappings of adulthood. The share of 18- to 34-year-olds who are married with children has fallen from 27% in 2000 to 20% in 2015. Several studies have asked whether student debt is nudging youngsters to put off marriage vows and stick to birth control, but the link seems tenuous. As for home-ownership, perhaps the biggest challenge facing young home-buyers is the fact that prices have outpaced income growth for 15 years.
The amount of debt a student has is often less important than the college or the degree. Students with the most debt often have the greatest earning power, as degrees in business, law and medicine tend to be especially costly. The young adults who tend to be most hobbled by their student debt are those who either dropped out or went somewhere non-selective.
There are even signs that taking on more student debt reduces the odds of bouncing back home to live with one’s parents, as long as it results in a degree. In an analysis of longitudinal data on college-going Americans born between 1980 and 1984, Mr. Houle and Cody Warner of Montana State University found that the young adults who returned home tended to be younger, underemployed, modestly indebted and from privileged homes. College drop-outs had a particularly high risk of returning to the nest. Every 10% rise in college debt reduced the odds of returning home by around 17%.
Millennials may be sluggish about starting their own households, but college graduates are more likely to do so than their less-educated peers, according to the Pew Research Centre. The earnings of young degree-holders are nearly double those of young high-school graduates. There is little question that the rising cost of college education is a problem, but the cost of not going—or, worse, dropping out—is higher still.
From the print edition: United States
Economic indicators
The April minutes said the Fed would raise rates in the summer on three conditions: higher growth, rising inflation and further improvement in the labour market. The first two have been met. The economy has looked stronger recently than in the first quarter of the year, when annualised growth was only 0.8%. Consumption surged by 7.4% at an annualised pace in April, driven by spending on durable goods—often a useful economic bellwether. The Atlanta Fed’s “GDPNow” model is predicting growth of 2.5% in the second quarter.
Inflation, too, is on track, having risen from 0.8% in March to 1.1% in April, according to the measure the Fed targets. Core inflation, which excludes volatile food and energy prices, stands at 1.6%, not all that far from the Fed’s 2% target. The dollar seems to have ended its two-year tear (notwithstanding a recent mild strengthening, probably caused by the Fed’s hawkishness). That will soon cause import inflation to pick up. And oil prices have been gradually rising since January.
But the economy has fallen spectacularly short at the third hurdle: the labour market. The jobs report was the weakest since 2010. To use up slack in the labour market, it is thought that payrolls must swell by a little under 100,000; the consensus forecast was for about 160,000 net new jobs in May. A mere 38,000 rise in payrolls means that the labour market loosened, rather than tightened, despite low interest rates. That the unemployment rate tumbled from 5% to 4.7% was no consolation: it was caused by falling labour-force participation, which is now back where it was at the start of the year (though a little higher than its trough in September). That is unwelcome news: economists had thought that a strong economy was tempting people back into work.
It is possible that a strike by 35,000 workers at Verizon, a telecoms firm, crimped the numbers slightly. That cannot be blamed on the economy. Still, sceptics note that the firm will have hired temporary workers to cover for absent employees, which would have cushioned the blow. And adding the strikers back into the figures still leaves the report looking underwhelming.
The Fed could still raise rates in July, but it would probably require a bumper jobs report for June, and an upward revision of May’s dire numbers. Ms. Yellen has an opportunity to update her analysis in a speech in Philadelphia on June 6th. For now, the odds of an imminent rate-rise are more-or-less back where they started. After a brief interlude, the market is once again looking like a better forecaster of the Fed’s actions than Fed officials themselves.

Houses under construction stand in the Norton Commons subdivision of Louisville, Ky., on May 12, 2016. (Luke Sharrett/Bloomberg)
U.S. housing starts dip, permits maintain gains
Lucia Mutikani
WASHINGTON — Reuters
Published Friday, Jun. 17, 2016 8:40AM EDT
U.S. housing starts slipped in May as the construction of multifamily housing units dropped, but further gains in building permits suggested a rebound that would continue to support economic growth in the second quarter.
Ground breaking fell 0.3 per cent to a seasonally adjusted annual pace of 1.16 million units, the Commerce Department said on Friday. Starts in April were little changed at a 1.17 million-unit pace.
Economists polled by Reuters had forecast housing starts falling to a 1.15 million-unit pace last month.
Housing remains a pillar of strength for the economy. Residential construction added almost a six-tenths of a percentage point to first-quarter gross domestic product, the biggest contribution in more than three years.
Ground breaking on single-family homes, the largest segment of the market, rose 0.3 per cent to a 764,000-unit pace last month. Single-family starts in the South, where most home building takes place, rose 2.6 per cent to their highest level since December 2007.
Single-family starts in the Northeast surged 12.7 per cent. In the West, ground breaking on single-family housing projects rose 1.9 per cent. But single-family starts in the Midwest tumbled 14.7 per cent to a six-month low.
Further gains in single-family starts are likely after a survey on Thursday showed confidence among home builders rose to a five-month high in June amid optimism over sales and buyer traffic. But single-family home construction continues to run ahead of permits, which could limit gains in the near term.
Housing starts for the volatile multifamily segment fell 1.2 per cent to a 400,000-unit pace. The drop followed an 11.9 per cent jump in April. The multi-family segment of the market continues to be supported by strong demand for rental accommodation as some Americans remain wary of homeownership in the aftermath of the housing market collapse.
Multifamily home construction is also being aided by rising household formation as a fairly strong labour market increases employment opportunities for young adults.
Building permits rose 0.7 per cent to a 1.14 million-unit rate last month. Permits for the construction of single-family homes fell 2.0 per cent last month to a 726,000-unit rate, while multi-family building permits increased 5.9 per cent to a 412,000-unit pace.
High quality global journalism requires investment. Please share this article with others using the link below, do not cut & paste the article. See our Ts&Cs and Copyright Policy for more detail. Email ftsales.support@ft.com to buy additional rights. http://www.ft.com/cms/s/0/eac8fd64-4508-11e6-b22f-79eb4891c97d.html#ixzz4DpQXItzt
July 8, 2016 1:49 pm
US labour market bounces back with payrolls jump
Sam Fleming in Washington Pan Kwan Yuk in New York

©AP
The US jobs market leapt back to life last month following a torrid May as hiring accelerated at the quickest pace since October 2015.
Payrolls in the US grew by 287,000 last month, more than 100,000 more than had been forecast by analysts, the Bureau of Labor Statistics said. That followed a downwardly revised gain of 11,000 in May that now looks like an aberration rather than the start of a weakening trend.
More
On this topic
IN US Economy
The jobless rate rose to 4.9 per cent from 4.7 per cent but the increase was seen by analysts as partly positive news as more people entered the labour force looking for work.
May’s dire figures had triggered concerns within the Federal Reserve that the US labour market rebound was losing steam, helping convince the central bank to leave policy unchanged as it gauged the underlying strength of the recovery.
The new numbers sharply change the picture, pushing aside fears that the US is flirting with recession and providing encouragement to Fed officials who argue that the US is closing in on full employment and that monetary policy needs to respond in the coming months.
Stock futures jumped, the dollar rose and bond yields edged higher on the data. With federal funds futures now pointing to a 23.7 per cent chance that the central bank will raise interest rates before the end of the year, compared with 11.8 per cent on Thursday, investors are bidding up dollar assets.
However, the data predate the UK’s vote to leave the EU, a decision that has sent tremors through global markets and prompted senior Fed officials to call for a wait-and-see stance as they gauge the wider impact.
“Brexit still matters,” said Diane Swonk of DS Economics. “The Fed is an international world, and the world is not an easy place and risks abound. The US looks good and we are gaining traction, but that doesn’t make it easy for them to raise rates.”

June’s solid jobs report was boosted by the end of a strike at Verizon Communications, a stoppage that took 35,100 workers away from payrolls in May and added them back in June. Looking at the past three months, job growth has averaged 147,000 per month, which is enough to keep the jobless rate trending lower over time.
The number of people working part-time because they couldn’t find a full-time job — an indicator closely followed by Fed policymakers seeking signs of slack in the labour market — dropped sharply by 587,000 to 5.8m.

“The rebound shows that employers in the US are continuing to hire at a solid clip, and that last month’s revised number of 11,000 was an anomaly,” said Tara Sinclair, chief economist at Indeed, the job site. However, “the uncertainty of Brexit for the global economy still looms, and may mean employers pull back on hiring in July and beyond,” she said.
The continued strengthening of the labour market will give a boost to Hillary Clinton, the Democratic nominee, who is seeking to highlight positive economic legacies of the Barack Obama years as she campaigns for election in November.
Mrs. Clinton has echoed Mr. Obama in arguing that the US is in a stronger position than overseas economies. Donald Trump, her presumptive Republican rival, by contrast last month called the weak May hiring report a “bombshell” and a “terrible” number.
The DXY dollar index is up 0.2 per cent while yields on the benchmark 10-year Treasury edged up 2.7 basis points to 1.41 per cent.

A U.S. flag decorates a for-sale sign at a home in the Capitol Hill neighbourhood of Washington in this file photo. (JONATHAN ERNST/REUTERS)
Low mortgage rates help boost U.S. home resales to 9-year high WASHINGTON — Reuters
Published Thursday, Jul. 21, 2016 10:08AM EDT
Last updated Thursday, Jul. 21, 2016 10:09AM EDT
U.S. home resales unexpectedly rose in June to their fastest pace in more than nine years as low mortgage interest rates drew buyers into the market, a positive sign for the economy.
The National Association of Realtors said on Thursday existing home sales increased 1.1 per cent to an annual rate of 5.57 million units last month, the highest level since February 2007. Economists polled by Reuters had forecast a 5.48 million-unit pace in June. Sales were up 3 per cent from a year ago.
May’s sales pace was revised slightly lower to 5.51 million units from the previously reported 5.53 million units.
U.S. mortgage rates fell in June to their lowest levels since 2013 on bets the Federal Reserve would be cautious about raising short-term rates. Mortgage rates have declined further since Britain voted on June 23 to leave the European Union.
“Maybe that has induced some first-time buyers to come back into the market,” NAR economist Lawrence Yun said.
First-time buyers made up 33 per cent of sales in June, the biggest share in nearly four years, the NAR said.
Home sales have become a bright spot for the U.S. economy and add to recent retail sales data in suggesting economic activity remains on solid footing despite a growth slowdown earlier in the year and concerns over the impact of Britain’s EU vote on global financial conditions.
Existing home sales jumped 3.8 per cent in the Midwest and rose 1.7 per cent in the West. Sales were flat in the South and fell 1.3 per cent in the Northeast.
The number of unsold homes on the market in June dropped 0.9 per cent to 2.12 million units. With inventory relatively tight, the median house price rose 4.8 per cent from a year ago to a record $247,700 last month.


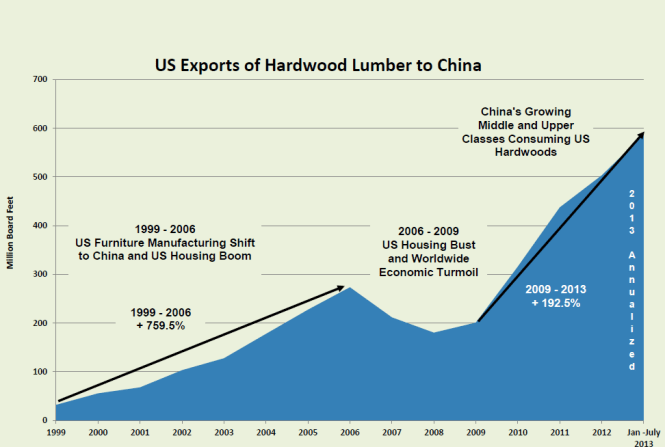
 Sylva Wood 2016 opened doors to the international wood trade on Monday June 27. Asia’s only wood materials and wood products ran from June 27 to 29.