Canada Housing Market
How ‘Trumpflation’ could ripple through Canada’s housing market
The Globe and Mail
Published Monday, Nov. 14, 2016 5:01AM EST
‘Trumpflation’
As if there isn’t enough going on with Canada’s housing market already, now comes “Trumpflation.”
The impact on Canadian housing could happen in a roundabout way, and there are different scenarios for how it could play out. But we’re already seeing the ripple effect in bond markets.
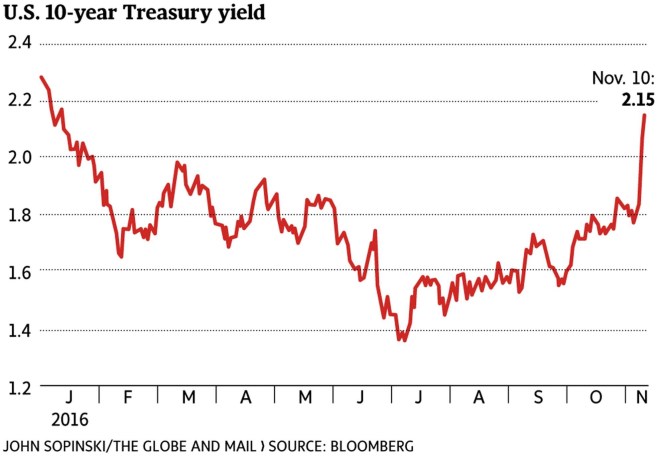
President-elect Donald Trump’s stimulus proposals are fuelling expectations of stronger inflation, pressing up Treasury yields and, in turn, those of Government of Canada bonds.
“Bond markets have interpreted a Trump win as one that will make inflation if not great again then at least rise again,” said Toronto-Dominion Bank senior economist Leslie Preston.
“Market-based measures of inflation expectations have reached their highest level since the middle of last year, driven by the prospects for fiscal expansion, as well as the risk of higher inflation due to an increase in trade protectionism,” she added.
“Higher import tariffs, of the sort discussed by Trump during the election campaign, typically raise prices for imported goods for consumers.”
She wondered, though, about just how this will play out; for example, the extent of “fiscal discipline” other Republicans will demand.
“Markets may be getting a bit ahead of themselves, as it very much remains to be seen whether this ‘Trumpflation’ will pan out,” Ms. Preston said.
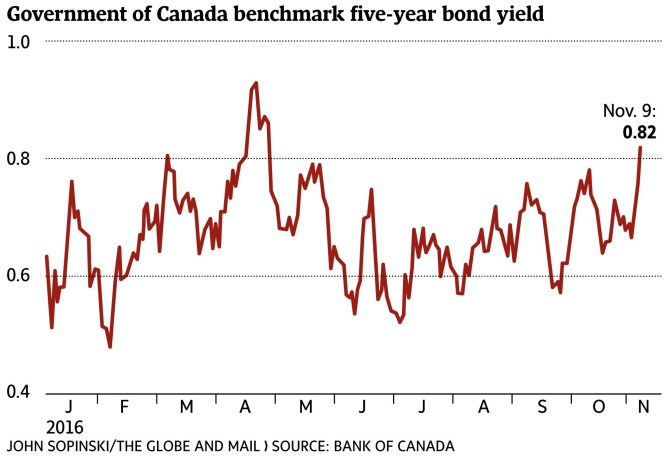
Yields rose in Canada last week, though not to the same extent as in the U.S.
“We did indeed see some upward pressure on GoC yields … but to a somewhat lesser degree than what we saw in Treasury yields post-election,” said BMO Nesbitt Burns chief economist Douglas Porter.
“And I would expect that underlying trend to be the case for many more months – an underlying upward trend in U.S. yields, with Canada pulled along in tow, but to a lesser extent,” he added.
“The ’lesser extent’ is due to the fact that the Bank of Canada is highly unlikely to hike rates in the foreseeable future.”
There are different scenarios for how this could ripple into Canada, with mortgage rates tied to the bond market.
“For mortgage rates and the housing market, the upswing is unlikely to be significant enough to take a serious bite,” Mr. Porter said.
“However, the point may well be that finally – finally! – the tide may be turning on borrowing costs, and that rates will become a small headwind for housing, rather than the gale-force tailwind they have been for years.”
Of course, Mr. Trump’s policies could also juice the U.S. economy, which is his goal and was behind the surge in stock markets, after some initial fear, in the wake of his victory. Which brings us to a different scenario.
“If ‘Trumpflation’ also leads to much stronger U.S. growth (and thus somewhat stronger Canadian growth), it could actually fuel the housing market further, at least initially,” Mr. Porter said.
David Madani, senior Canadian economist at Capital Economics, fears a more severe outcome, one that would press already vulnerable borrowers.
“Given record high household debt levels in Canada, any material increase in bond yields and, in turn, household borrowing costs would be unsettling,” said Mr. Madani, who has been down on Canada’s housing market for years.
“As we have highlighted several times before, Canadian household debt obligations as a share of disposable income are fairly high, despite the current low level of household borrowing rates … So, any increase in mortgage rates, for example, would cause these debt obligations to grow, clouding the outlook for consumption and investment in the severely overvalued housing market.”


Canadian home price and debt charts that will raise the hair on your neck
The Globe and Mail
Briefing highlights
- Of household debt and home prices
- Major stock indexes mixed
- Oil prices climb on weekend agreement
- Canadian dollar tops 76 cents
Raising hairs
Here are some charts that should raise the hair on the back of your neck.
Or, given how often Canadians have been warned about high levels of household debt and home prices, some eyebrows, at least.
They’re from a quarterly report released over the weekend by the Bank for International Settlements, a global body made up of central banks, which in a previous review already had singled out Canadian consumers for naughty borrowing habits.
They also come during a key week for debt and housing numbers, with reports on tap from Statistics Canada, the Bank of Canada and groups that measure home prices.
Household debt has been a huge issue in Canada, tied to the run-up in home prices, which have cooled in some cities of late.
This first chart speaks for itself. Canadian household debt, as a percentage of gross domestic product, certainly isn’t the highest among major developed countries, but it’s way up there.
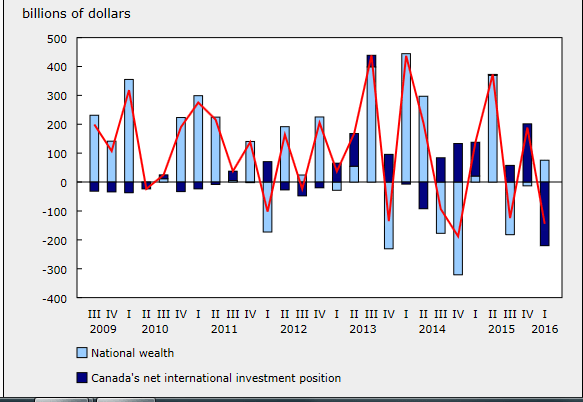
We’ll get a fresh look on Wednesday, when Statistics Canada releases its quarterly report on debt and wealth.
While we’ve been getting richer as home prices and stock values rise, our debts have been getting that much fatter.
The Wednesday report is the one that includes the key measure of household debt to disposable income. Whether the latest reading is up a bit or down a bit almost doesn’t matter, given the exceptionally high level at which it now stands.
But for the record, Bank of Montreal chief economist Douglas Porter expects to see a fresh record of almost 170 per cent.
“Household debt growth continues to chug along at a 5.2-per-cent year-over-year clip, while disposable income growth labours along at about a percentage point slower,” he said.
Which tells you why what’s happening is happening.
Royal Bank of Canada economists, on the other hand, expect to see a wee dip to 166.9 per cent in the third quarter from the 167.6 per cent of the previous three-month period, because the federal government’s child benefit cheques, which were sent in July, are helping us out.
“Growth in assets and net worth should also have outpaced the increase in debt outstanding in the quarter,” they added.
In a previous report, the BIS red-flagged Canada, warning of likely stress on the banking system because of the credit surge.
It noted an elevated credit-to-GDP “gap,” the difference between credit-to-GDP and its long-term trend. That takes in all credit to the non-financial sector, including loans and other instruments such as debt securities.
Here’s where that stands now:
Many economists believe that Canadian families are generally in okay shape, despite the debt burden and absent a shock such as a spike in unemployment or a sudden rapid rise in borrowing costs.
Remember, too, that Ottawa recently brought in new mortgage and tax measures aimed at cooling our credit appetite and heading off a popped housing bubble.
“We have consistently been in the ‘sky-is-not-falling’ camp on this issue, and would point out that the household savings rate has quietly hit its highest level since 2000 (5.8 per cent in Q3),” Mr. Porter said.
Looking ahead, economists believe the housing market will cool further. Sales are already slumping in Vancouver, in the wake of a separate provincial tax on foreign buyers of Vancouver area properties, and the pace of growth in Toronto is expected to ease as people are increasingly priced out of the market.
“The housing market started to slow in Q3, but debt burdens continued to build faster than income gains,” said Mr. Porter’s colleague, BMO senior economist Benjamin Reitzes.
“The new mortgage restrictions should restrain housing activity (and in turn borrowing) in 2017, suggesting the debt ratio could start to flatten out somewhat next year.”
This week also brings the Bank of Canada’s financial system review, which no doubt will again highlight the debt surge and high home prices as points of vulnerability.
“The BoC has been supportive of recent macro-prudential measures … but remains likely to see elevated household debt as a key vulnerability to the system,” said the RBC economists.
“Indeed, while Vancouver has shown signs of moderation, Toronto-area home prices have continued to rise,” they added.
“As well, the recent jump in long-term interest rates, which received a mention in the [Bank of Canada’s] short December rate statement, should get some attention from a financial-conditions perspective.”
Note how the blue line pokes its head just above the others in this chart, below.
Two housing reports this week may also show markets cooling, but for Toronto. We’ll see both the Teranet-National Bank home price index and the Canadian Real Estate Association’s monthly look at sales and prices.
The latter, said BMO’s Mr. Reitzes, is likely to show sales flat compared to a year ago.
“The new mortgage rules took effect in the second half of October, weighing on activity mostly in higher-priced markets,” he said.
“Vancouver continues to be hid hard by the foreign buyers tax and now the mortgage rules, driving sales down nearly 40 per cent year over year,” he added.
“Contrast that with Toronto, where sales remained red hot, surging over 15 per cent year over year.”
Expect to see average price increases stay “relatively healthy” at about 6 per cent, compared to a year earlier, and the MLS home price index, which is deemed a better measure, up by about 14.5 per cent.
- Global body warns of threat to Canada’s banking system
- Brent Jang: Toronto leads rising prices as Vancouver cools
- Tamsin McMahon: Realtors loath to share foreign buyer data, CMHC talks show
- David Parkinson: Why Poloz may use words to cool ‘Trump effect’
- Ontario home-buying math: When prices rise $2,000 every 8 to 9 days
- Risk and reward in Ontario’s Golden Horseshoe
- Data Centre: What homes in your city are worth
- A 5-year, city-by-city Canadian house price forecast
- New Canadian housing rules: How they’ll ‘harden’ the landing
- What you need to know about Ottawa’s overhaul
Updated Tuesday, Nov. 15, 2016 6:04PM EST

Canada’s home prices rose 0.3 per cent in October compared with September, according to new data from the Teranet-National Bank House Price Index.
Six of the 11 metropolitan markets surveyed experienced month-over-month price gains. There were monthly increases of 1.4 per cent in Hamilton, 1.2 per cent in Toronto, 1.1 per cent in Quebec City, 0.5 per cent in Calgary, 0.4 per cent in Winnipeg and 0.3 per cent in Victoria.
Montreal, Vancouver, Ottawa, Halifax and Edmonton had declines in October from September.
The composite index saw a year-over-year improvement of 11.8 per cent to a record high of 198.35, meaning prices went up by 98.35 per cent since June, 2005. It is the sharpest 12-month increase since June, 2010. The average sales price in the national survey was $576,656 for the 11 markets last month.
— Brent Jang
The economic dangers of cooling Canada’s housing market Subscribers Only
David Parkinson and Brent Jang
TORONTO and VANCOUVER — The Globe and Mail
Published Friday, Dec. 09, 2016 7:09PM EST
Last updated Friday, Dec. 09, 2016 7:09PM EST
You don’t have to tell Neil Chrystal about how a booming housing sector can put strains on an economy. He lives it every day, as the Vancouver developer scrambles to keep up with demand and compete for scarce contractors.
“New construction here has been very busy,” said Mr. Chrystal, chief executive officer of Polygon Homes Ltd., which builds condos and townhouses throughout British Columbia’s Lower Mainland – the epicentre of Canada’s housing boom. “On any given day, there are about 1,000 workers at our sites. Those are trades who come to do drywall, painting, concrete work or landscaping. It is getting more challenging to find trades.”
An influx of skilled tradespeople from Alberta, migrating to the Lower Mainland to escape the oil slump gripping that province, is helping ease some of his pressures to keep up with his building schedule. But more people moving in from Alberta also means more people looking for homes – adding even more housing demand.
“The local construction industry provides a lot of jobs in our marketplace. It’s a huge economic driver,” Mr. Chrystal said.
Indeed, the ongoing strength of the housing market in post-recession Canada – now seven years and running – has made the sector a critical engine of growth throughout the economy’s often-trying recovery, not just in hot markets such as Vancouver but throughout the broader Canadian economy. The country’s dependence on the sector for growth has become even more acute in the past two years, as the collapse in resource prices kicked away one of the strongest legs that the post-recession economy had been standing on.
Now, policy makers are looking to tap the brakes on the housing booms in massive markets such as Vancouver and Toronto, in response to deep concerns about dangerously high mortgage debt loads and fast-evaporating affordability. But experts warn they will have to tread carefully to avoid upending Canadians’ broader economic prospects in the process.
“Yes, affordability is important. But we can’t lose sight of the fact that this market has a huge impact on our general economic and personal well-being,” said Frank Magliocco, partner and national real estate leader at business consultant PricewaterhouseCoopers Canada. “If we shut that market down, I think it could have a precipitous effect.”
While it’s hard to get a full measure of the real estate market’s footprint on the economy, as a wide range of goods and services businesses have ties to housing-related activities, the most commonly-used gauge is to look at the two economic segments that relate directly to housing: residential construction (the building of homes) and real-estate services (the buying, selling, renting, leasing, appraising and managing of properties). These two segments today account for 15 per cent of Canada’s gross domestic product, up from 13 per cent a decade ago. But more significantly, they have been responsible for an oversized 26 per cent of Canada’s real GDP growth over the past five years – and a whopping 41 per cent of growth in the past two years.
This impact is most acute in British Columbia, whose economy is dominated by Vancouver – whose economy is, in turn, dominated by residential real estate. In 2015, residential construction and real estate services accounted for 21 per cent of the province’s GDP, far above the national average. Since 2011, these two segments have produced 35 per cent of B.C.’s real GDP growth.
“You see the spinoffs in other industries as well,” said David Bell, a business team leader at Vancouver-based PGL Environmental Consultants, which garners roughly half its revenue from real-estate-related work. “Developers hire consultants, mechanical and electrical engineers, all kinds of technical trades and the whole construction side. The side benefits even spill into the food and hospitality side, because workers have to buy their lunches and some people who travel use hotels.”
The big gains in home prices over the past several years have also made Canadian homeowners much wealthier. Household net worth has surged 40 per cent in the past five years, thanks primarily to the rising values of homeowners’ properties. This has delivered another economic lift, what economists call the “wealth effect” – in short, rising wealth fuels rising consumer spending. Benjamin Tal, deputy chief economist at Canadian Imperial Bank of Commerce, estimates that about 10 to 15 per cent of the growth in Canada’s retail sales in the past year can be attributed to the wealth effect from rising house values.
Of course, the bulk of Canada’s housing boom is now centred in the Vancouver and Toronto regions; in most of the rest of the country, the sector has already moderated. But these two metropolitan areas – which, between them, represent about one-quarter of Canada’s population and its gross domestic product – have delivered most of the growth in Canada’s struggling economy of the past two years, propelled in no small part by their hot housing sectors.
The Conference Board of Canada recently estimated that metropolitan Vancouver’s real GDP expanded by 4 per cent this year while metro Toronto’s grew 3.4 per cent; by comparison, the Conference Board expects Canada’s economy as a whole to achieve growth of just 1.3 per cent this year. If you deduct Vancouver and Toronto from the national figures, the rest of the country is on track to grow a paltry 0.5 per cent. In 2015, when Canada’s economy scratched out 1.1-per-cent real growth, Toronto and Vancouver accounted for all but 0.2 percentage points of that.
Now, with Vancouver’s housing sector recently showing signs of easing, the national economy soon faces a smaller growth contribution from that city. The Conference Board predicts that Vancouver’s growth will moderate to 2.8 per cent in 2017, mainly on the back of a forecast 20-per-cent drop in housing starts, as new federal and provincial regulations take more wind out of the housing sector’s sails.
Governments are also on the hook should the housing market fizzle. In a recent report, National Bank of Canada economists Warren Lovely and Marc Pinsonneault estimated that housing-related activity generates about $120-billion a year in federal, provincial and municipal taxes, covering about 17 per cent of their total revenues. Governments trying to cool their housing markets could put a hole in their own budgets.
“With so much economic activity and government revenue being spun off from today’s housing market, policy makers (be it the Bank of Canada, financial regulators and/or federal, provincial, municipal governments) need to proceed cautiously and with a full understanding of what’s at stake,” Mr. Lovely and Mr. Pinsonneault wrote. “It’s not so obvious that meaningful alternative revenue streams are waiting in the wings should today’s housing-related revenue gusher dry up.”
Jeremy Kronick, senior policy analyst at the C.D. Howe Institute, an economic think tank, argues that if governments want to cool overheated housing markets without chilling economic growth in the process, they’ve been going about it the wrong way.
“If you think about the measures that have been put in place to slow down the housing market, they’re all on the demand side – they’re all with the idea of slowing down demand,” he said. “When you do that, maybe you get the result you want, but those actually slow down [housing activity],” he said.
“The supply side might be the better way to go. If you increase the supply of detached and semi-detached homes, you can get the lowering of price that help with affordability and risk-taking. But you get the added bonus of continuing to contribute to a section of GDP that is a big part of growth.
“Maybe it’s time for a different approach that maybe produces more optimal results.”
Globe & Mail EXPLAINER
Real-estate reform: What you need to know about Ottawa’s overhaul

BEN NELMS FOR THE GLOBE AND MAIL
The Globe and Mail Last updated: Thursday, Nov. 17, 2016 2:38PM EST
TABLE OF CONTENTS
What have provinces been doing?
What else has Ottawa already done?
The federal government is throwing some cold water on Canada’s overheated housing market, hoping to keep Canadians out of unaffordable debt and slow down foreign investment in Toronto and Vancouver’s real-estate markets. Here’s a guide on what has happened so far, what it means and what’s next.
What’s changing?
Earlier this month, Finance Minister Bill Morneau announced a major shakeup of Canada’s mortgage and foreign-ownership rules for real estate. Some of those rules begin to take effect today. There are four big changes involved, The Globe’s Bill Curry explains:
1 Expanding stress tests to all insured mortgages, not just mortgages in which the buyer has put down less than 20 per cent of the purchase price. This may make it harder for some buyers to get insured mortgages, even if they make a larger down payment, because it ends a two-tier system where some mortgages were weighed differently against the buyer’s income to see whether the mortgage is affordable. (To illustrate the difference in dollar terms, here are three scenarios and the maximum purchase prices that would be insured in each under the old and new rules.) Some buyers may be exempt from the new rules, though; here’s Rachelle Younglai’s explanation (for subscribers) of who’s exempt and who’s not.
2 Closing a tax loophole that some foreign buyers have used to claim exemptions in capital-gains tax for selling properties that they falsely claim as their primary residences. Now, home buyers must file taxes in Canada, as a resident, the same year they buy a home, before they can later claim the principal residence exemption on any gains for that year.
3 Launching consultations to see if banks can take on added lending risks, which would lighten Ottawa’s obligations to pay for insured mortgages in the event of a housing crash – but could also lead to higher mortgage rates. (Here’s an explanation of the three scenarios Ottawa is proposing and how lending institutions can give their feedback on them.)
4 Changing the restrictions on portfolio insurance, a type of bulk insurance for mortgages with down payments of 20 per cent or more.
Ottawa targets foreign real-estate investment with new housing measures
The measures got the thumbs-up from Bank of Canada officials who said on the week of the announcement that the changes would help ease risks on the nation’s financial system.
Rachelle Younglai spoke with first-time home buyers ( story for subscribers) to see how they saw the changes affecting them. Here’s how 35-year-old Michael Mikhail of Toronto felt:
This is a big blow. I will get approved [for a mortgage] because I have decent savings and a good job, but they will give me a lot less.
How Ottawa’s new mortgage rules could impact Toronto’s rental market
Why are they doing this?
To crack down on foreign real-estate speculation: Investigations by The Globe and Mail over the past year have also shed light on how local and foreign buyers have been flipping Vancouver-area homes for profit, buying and selling properties in the names of relatives or corporations and collecting tax windfalls in the process. In B.C., fears of wealthy foreign buyers inflating Vancouver’s sky-high housing prices have led to tougher restrictions on how the market is regulated and taxed provincially (more on this below); now Ottawa is hoping to close the federal tax loopholes too, a move met with cautious optimism by the B.C. government.
To keep Canadians out of debt: Mr. Morneau hopes that applying the same stress test to all high-ratio mortgages will make prospective home buyers think twice about taking on more debt than they can pay for. “We want to ensure that we have measures in place to help them to take on risks that they can afford, especially in the situation where mortgage rates go up or their family income goes down,” Mr. Morneau said in an interview with The Globe. Analysts are worried that Canada’s housing markets, especially Toronto and Vancouver’s, are unsustainable: On Oct. 26, the CMHC is set to issue its first-ever “red” warning for the housing market, with CEO Evan Siddall warning that, when home prices and debt levels are high, economic contractions usually follow.
To keep Ottawa off the hook: The federal government currently assumes the full cost of insured mortgages in the event of defaults. Mr. Morneau’s changes would mean Ottawa would pay less, and banks might pay more – as much as 15 per cent, according to the Finance Department’s proposal. Those are costs that the banks might pass on to homeowners by raising rates. The changes to low-ratio mortgage insurance would put the government in less risk in markets with lots of residential mortgages worth $1-million or more, such as Vancouver and Toronto.
What have provinces been doing?

B.C. Premier Christy Clark speaks in Vancouver on June 29, 2016.
JOHN LEHMANN/THE GLOBE AND MAIL
The federal government is part of a task force along with the B.C. and Ontario governments that is looking at housing prices in the Toronto and Vancouver areas. Here’s what those provinces have been up to in their own jurisdictions:
British Columbia: This summer, Premier Christy Clark’s government began more rigorous tracking of home buyers’ nationalities and instituted a 15-per-cent tax on home purchases in Metro Vancouver that involve foreigners. The number of foreign-involved transactions plummeted once the tax took effect on Aug. 2; more Vancouver housing numbers released on Tuesday showed a further drop in property sales in September. But Canada Mortgage and Housing Corp. cautioned in an October report that foreign investment is only one facet of Vancouver’s ultra-hot housing market, and it’s too early to tell if the B.C. tax has made a difference.

B.C. real estate reform: What you need to knowHere are other ways the province is shaking up the rules of real estate.

Ontario: Premier Kathleen Wynne says the province needs more information about the factors behind Toronto’s red-hot real estate market before adopting a foreign-buyer tax like B.C.’s.
What else has Ottawa already done?
The federal government’s most recent measures come after years of fine-tuning Canada’s housing laws in the aftermath of the 2008-09 financial crisis. Here’s what Justin Trudeau’s Liberal government and the Harper Conservatives before it have already done so far:
Feb. 15, 2016: The minimum down payment for new government-backed insured mortgages increases from 5 per cent to 10 per cent for the portion of a house price over $500,000.
July 9, 2012: The maximum amortization period for new government-backed insured mortgages drops to 25 years from 30 years. Ottawa lowers the maximum amount Canadians can borrow when refinancing to 80 per cent from 85 per cent and stops offering insurance on mortgages for homes worth more than $1-million, instead requiring borrowers for such homes to make a minimum down payment of 20 per cent.
April 18, 2011: Ottawa withdraws government insurance backing on lines of credit secured by homes, such as home equity lines of credit.
March 18, 2011: The maximum amortization period for government-backed insured mortgages is cut to 30 years from 35 years and the maximum amount Canadians can borrow in refinancing their mortgages is reduced to 85 per cent from 90 per cent of the value of their homes.
April 19, 2010: Ottawa introduces a requirement that all borrowers meet the standards for a five-year fixed rate mortgage even if they choose a mortgage with a lower interest rate and shorter term. The government also lowers the maximum amount Canadians can withdraw in refinancing their mortgages to 90 per cent from 95 per cent of the value of their homes and requires a minimum down payment of 20 per cent for government-backed mortgage insurance on non-owner-occupied properties bought for speculation.
Oct. 15, 2008: The maximum amortization period for new government-backed mortgages is fixed at 35 years and a requirement for a minimum down payment of 5 per cent is introduced. Ottawa also establishes a consistent minimum credit-score requirement and introduces new loan documentation standards.
What happens next?
The new stress-test rules came into effect for borrowers on Oct. 17. While several economists don’t fear a housing meltdown as a result of the new rules, some effects may be felt immediately. Royal Bank of Canada’s Robert Hogue predicts it will “harden” the landing as the markets shift, Michael Babad reports.
Here are some other important dates to watch out for as the changes come into effect:
- Nov. 30: The new rules for low-ratio mortgages come into effect.
- Feb. 28: This is Ottawa’s deadline for feedback from lending institutions on possible risk-sharing in the mortgage industry.
- April 30: For most Canadians, this is the deadline day for filing taxes. The new housing rules affect when you have to declare the sale of your home to the government.
Ottawa doesn’t have any other plans to intervene in the housing market beyond the changes already announced, Mr. Morneau said on Oct. 13.
Will this actually work?
RAFAL GERSZAK FOR THE GLOBE AND MAIL
When it comes to housing prices and sales, we won’t know for a while what effect Ottawa’s latest measures will have, or whether they’re working as the Trudeau government intends.
Not all the factors behind Toronto and Vancouver’s high prices – like the shortage of single family houses in those cities, or global trends that drive foreign investment in real estate – are within the federal government’s control, The Globe’s Barrie McKenna explains, and mortgage stress tests may not be a sufficient fix.
Here’s Kathy Tomlinson and Mike Hager’s report on what some real-estate experts predict will happen after the federal changes take effect. Over time, monthly housing reports will also paint a clearer picture of how they’re affecting home buyers’ bottom line across the country. To see how the market is shifting in your city or neighbourhood, get the latest numbers and analysis from The Globe’s house-price data centre.
Canada’s housing bubble makes America’s look tiny
Comparing Canada’s infatuation with real estate against the peak of the U.S. housing bubble yields some disturbing insights
October 31, 2016
It’s been just over a decade since the U.S. housing market peaked, and rarely a day goes by without stories exploring the hot real estate market in Canada. Whether it’s warnings about elevated levels of household debt, government regulations to cool prices or the influx of foreign money, residential real estate generates sustained discussion and debate. After witnessing the housing crash south of the border, and the carnage it wrought, this is to be expected.
For all the attention, it’s notable that most analysts don’t see Canada facing a U.S.-style housing crash. For instance, Moody’s Analytics argued this month that even though price growth will decelerate, there is not likely to be a hard landing. Some observers are a bit more pessimistic, such as TD Bank, which predicts a 10 per cent fall in Vancouver house prices. Still, if there is a consensus view among professional forecasters about the Canadian housing market, it’s that prices will plateau or suffer only a minor dip. For a variety of reasons, most people do not see a U.S.-style crash on the horizon for Canada.
Yet when it comes to our respective housing bubbles, comparing Canada’s current infatuation with real estate with the peak of property mania in the U.S. yields some disturbing insights. We may not be as different as we like to think.
MORE: Hands off my housing bubble!
When looking at housing markets, the most obvious comparison is price. How does the level and trajectory of Canadian house prices stack up against the U.S.?
The following chart is drawn from the Federal Reserve Bank of Dallas’s International House Price Database. It’s an index (100 = prices in 2005) of real, or inflation-adjusted house prices, and it drives home just how much more inflated Canadian house prices are than at the U.S. bubble’s peak. The chart also includes Japan and its mammoth housing bubble of the 1980s—which is more akin to what’s gone on in Canada.
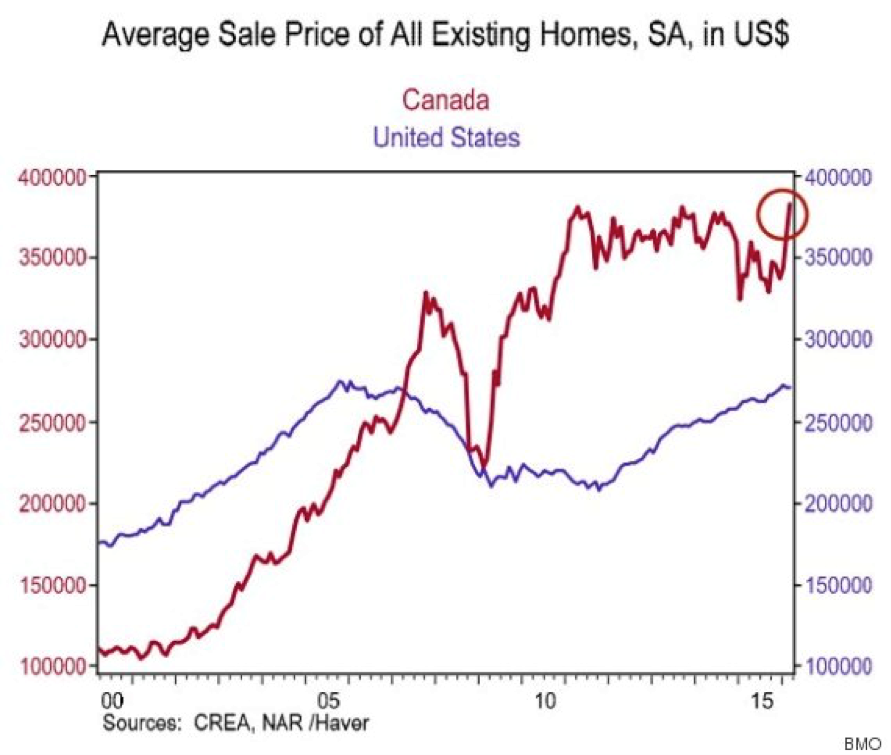
Here’s another way to look at the astonishing price gap between Canada now and when the U.S. bubble peaked. BMO economist Sal Guatieri put together the following chart in May, showing average house prices for Canada and the U.S. since the year 2000 but with both housing markets denominated in U.S. dollars in order to show relative valuations. It reveals just how expensive our housing market has become relative to the U.S. bubble’s peak.
As has been pointed out many times, two cities in particular are driving Canada’s real estate boom: Vancouver and Toronto. Here are how those two cities compare against four American cities that saw rapid house inflation during the U.S. boom. Vancouver’s market quite clearly leads the pack, with prices going parabolic. Toronto comes in second, with its price appreciation since 1998 eclipsing the mid-2000 bubbles in all four American cities on the graph—even the hyper-charged markets of Miami and Las Vegas. Of course, prices are not the only way to look at the evolution of a housing market. Another important consideration is the level and change in household debt. As with the U.S. bubble, a surge in household indebtedness (principally via mortgages) has provided the fuel to send prices soaring. If we examine U.S. and Canadian household debt-to-GDP ratios, we see that Canada recently exceeded the level reached by American households in the first quarter of 2008. Perhaps a more telling comparison, however, is household debt to disposable income for the two countries. Indeed, that’s the ratio more often cited by economists, because it measures the debt burden of households against the income they have available to repay it. When Canada’s debt and income data is adjusted to reflect how the U.S. measures them, Canada’s debt-to-income ratio now sits just shy of the U.S. peak reached in the wake of the housing crash. (It should be noted, though, that among industrialized countries, Canada is not the most indebted using this ratio. Norway and the Netherlands have household debt to disposable income ratios well in excess of 200 per cent, while Denmark’s households owe just over 300 per cent.)
Some critics have in the past argued that household debt to disposable income is a misleading metric, when what really matters is not the debt burned itself but the ability of households to manage it. And for a long time, Statistics Canada’s debt-service ratio—the amount of disposable income required to cover debt payments—showed Canadian households in a far better position than American households were at the time of the housing crash, with Canada’s ratio hitting record lows thanks to near-zero interest rates. But those claims were made when StatsCan only published the interest part of debt servicing. Now that StatsCan includes principal repayment in the calculation, bringing the measure in line with the U.S. methodology, the situation in Canada looks much grimmer and skeptics have stopped using it.
Another way to assess a housing market is to consider it relative to the size of the national economy. Again, both in the case of the U.S. at the time of the bubble and in Canada now, residential construction represents a sizable share of GDP. Further, the following graph from investment bank Macquarie suggests that Canada is following the path of the U.S. when it comes to this sector. And crucially, using the U.S. bubble as a guide, Canadian residential investment may have recently peaked.

Comparing the underlying data and trends in the two North American housing manias is interesting. But it’s in some of the softer, less quantifiable aspects of the Canadian bubble that we see echoes of the U.S. boom.
One obvious similarity between the Canadian and U.S. bubbles is the wall-to-wall coverage of all things real estate. Turn on Canadian radio and television these days, or browse the Internet and social media, and you’ll encounter a near-constant barrage of pitches for condos, mortgages (as well as second mortgages) and real estate seminars, promising the secrets of easy real estate riches as taught by self-professed experts. Also ubiquitous: ads for debt management and credit counselling.
As with the U.S., too, there are seemingly compelling arguments put forth as to why bubble fears are overblown. For example, in 2004, then-Federal Reserve chairman Alan Greenspan argued that U.S. households were actually in reasonably good shape, despite rising consumer debts. In painting a healthy picture, Greenspan pointed to rising household net worth, which of course was principally the result of the soaring real estate market. The problem was, when the market crashed, so too did the net worth of U.S. households. Similar arguments have been repeatedly made in Canada.
Given all these similarities, both statistical and anecdotal, why then do more people not believe Canada could suffer the sort of housing crash that the U.S. suffered?
In part, it may be related to how the respective bubbles formed. The U.S. bubble involved widespread use of complex products such as collateralized debt obligations and credit default swaps. That sort of financial engineering is not nearly as prevalent in Canada, and while there are signs of fraud in the mortgage industry, the causes of the Canadian bubble seem more straightforward: low interest rates and lots of bank lending (much of it insured by the taxpayer), with foreign investors also playing a role in certain areas (namely Vancouver). Oh, and old-fashioned greed, fuelled by ridiculously unrealistic expectations.
Another explanation for the lack of housing fear lies in Canada’s sense of its own economic uniqueness. When the U.S. housing market collapsed, it kneecapped the global economy, and yet Canada emerged largely unscathed, with observers praising the health of Canada’s banks. Then when the European debt crisis and U.S. debt ceiling debates raged, observers again pointed to Canada for its sound government finances. Now as global growth slows, yet more observers are singing Canada’s praise for its embrace of fiscal stimulus, trade and newcomers, a stark contrast to the presidential candidacy of Donald Trump. It’s enough to make anyone smug.
Canada better hope all this housing confidence is justified. If there’s one thing the U.S. crash reminded us, it’s that housing bubbles can have very serious and long-lasting consequences—property values crater, mortgages become millstones, consumer spending plummets, and unemployment soars.
After all, with so many indicators suggesting Canada’s housing market has inflated well beyond what the U.S. experienced in the early 2000s, the chart shown above simulates what a 33 % house price decline would mean for the Canadian market. This is sobering.
But surely that can’t happen here. Right?

Watch this indicator for signs of an impending plunge in housing prices
The Globe and Mail
Published Friday, Dec. 23, 2016 10:08AM EST
The following is an excerpt from Scott Barlow’s collection of 10 charts that will define the markets in 2017. To view the entire series, click here.
The Teranet-National Bank composite index of the country’s 11 largest housing markets shows a healthy 11.8 per cent year-over-year increase in residential real estate prices. This is deceiving. Once booming everywhere, national housing prices are now dependent to a great extent on the red-hot Greater Toronto Area and the now-flagging British Columbia markets.
The first chart below shows the year-over-year change for the Teranet-National Bank composite 11 index of home prices and all of its components (using October data). Vancouver homes saw the greatest increase at 22.5 per cent but recent measures to slow foreign investment flows saw prices fall in the September to October period. The Toronto real estate market remained strong and the 15-per-cent increase in Hamilton home prices indicates how far outside the city GTA homebuyers had to go to find affordable prices.
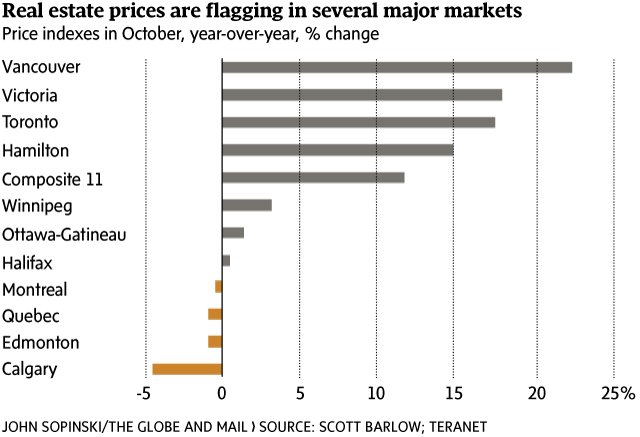
Five markets saw flat or declining housing values – Halifax, Montreal, Quebec, Edmonton and Calgary.
The second chart compares national home prices and retail spending in an attempt to predict the future course of the real estate market. The thesis here is that the infamously indebted Canadian consumer will pull back on discretionary spending when monthly mortgage payments start to bite. Mortgage payments aren’t optional and if high household debt levels are about to slow the housing market and the economy at large, the trend should be visible first at the shopping mall.
From November, 2011, to July, 2013, the growth in Canadian real estate values trended lower, following declining sales growth with a lag of about six months.

This year has seen a much different pattern. Retail sales growth has slowed sharply, falling below the five-year average. At the same time, the Teranet-National Bank composite 11 index has continued to rocket higher, creating a major divergence on the chart.
The relationship between home prices and retail spending growth is far from ironclad – it is not guaranteed that housing prices will follow consumption levels lower. But it stands to reason that further weakness in Canadian spending levels is a negative sign for real estate and an indication that high household debt levels are beginning to limit domestic economic growth.
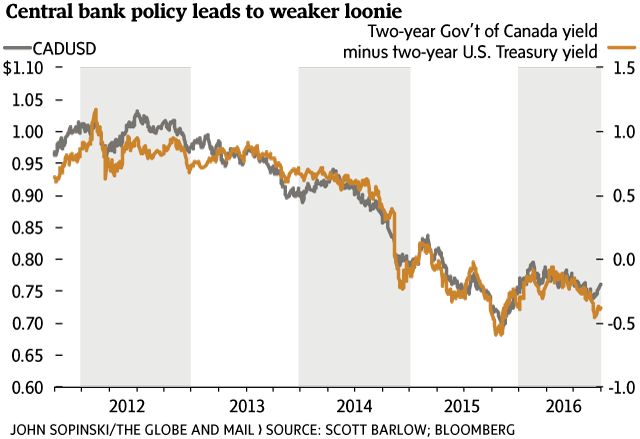
The Bank of Canada and the U.S. Federal Reserve are moving in different directions and this is likely to result in a lower Canadian dollar for 2017.
The price of oil has a significant impact on the loonie but interest rates have been the better predictor of the domestic currency’s value in the past five years. Specifically, the yield on the Canadian two-year government bond minus the yield on the two-year U.S. Treasury bond has been almost foolproof as a fair value indicator for the Canadian dollar, as the chart below shows.
Cross border investment flows are behind the trend. Domestic and foreign investors will shift assets to higher-yielding bond markets. In April, 2012, for instance, the two-year Canada bond yielded 1.42 per cent compared with 0.25 per cent for the U.S. equivalent bond. U.S. bond investors moved assets to the Canadian market to receive higher yields. As part of this transaction, these foreign funds were converted to Canadian dollars in foreign exchange markets, pushing the loonie’s value above par on the greenback.
Current trends in Canadian bond yields are very negative for the loonie. Fed chairwoman Janet Yellen’s recent decision to increase U.S interest rates pushed the orange-coloured line on the chart lower. Fed policy caused U.S. bond yields to rise relative to Canadian bond yields. The Bank of Canada is not expected to change policy in 2017, but if it does, the most likely action is an interest rate cut. This would also make domestic bond yields less attractive relative to U.S. bonds and weaken the loonie. In other words, central bank policy on both sides of the border is leaning towards a weaker Canadian dollar.
The extent to which Canadian bond yields follow U.S. yields higher will be an important theme for 2017. Historically, domestic yields have followed U.S. yields even during periods when the Canadian economy did not justify any change. In bond trader parlance, Canada is a ‘yield taker’ country. Any change in Canadian yields relative to U.S. bonds will likely have a significant effect on the value of the domestic currency.
With reports from Bill Curry, Tamsin McMahon, Rachelle Younglai, Kathy Tomlinson,
US Housing Market
Housing Market Forecast: Experts Weigh In On 2017 Real Estate
Low Mortgage Rates, High Demand Fueled 2016 Housing Market
The year 2016 proved to be a hot one for real estate.
Home values, prices and sales showed some of their strongest numbers since before the economic downturn a few years ago.
And mortgage rates were downright cheap.
But there’s no guarantee favorable conditions for buying and borrowing will continue in the months ahead.
Consequently, it’s fair to ask the question: Will housing prices keep climbing into 2017?
Industry experts weigh in. Though no one can tell the future, their housing market forecast can help first-time home buyers make better decisions this year and next.
Should you buy now, or wait? Here is advice from leading experts.
Home Prices Near Pre-Recession Peak
First, a closer look at the current climate on housing prices nationally.
Home prices continue to post steady year-over-year gains and are nearly back to pre-recession highs, based on 90.6 million U.S. single-family homes and condos tracked by real estate data firm ATTOM Data Solutions.
In July, for example, the national median home price for single-family homes and condos collectively was $226,500 – an increase of 7% from a year earlier and the 53rd consecutive month with a year-over-year increase.
This is within a half percent of the pre-recession peak price observed in July 2005, says Daren Blomquist, senior vice president for ATTOM Data Solutions.
But looking closer at market indicators reveals further truths.
“The strong national sales price numbers mask a shift in the market where we are seeing home price appreciation weaken in some previously high-flying and high-priced markets while continuing to strengthen in some of the secondary markets,” says Blomquist.
Case in point: In July, home price appreciation in San Jose and San Francisco was each 5%, the former down from 16% a year earlier. San Francisco was down from a high of a 32% rate of appreciation in July 2013.
Secondary markets like Portland, Denver and Seattle, meanwhile, all experienced appreciation increases in 2016 versus one year ago.
Nela Richardson, chief economist for Redfin, agrees that bullish real estate sales prices are decelerating.
“After several years of steady and steep price growth, we are seeing indications that price growth is slowing and the market is normalizing,” says Richardson. “Redfin housing market data indicate that home prices in August rose just 4.4% compared to 2015 — the slowest pace of the year.”
Prediction: Housing Market To Normalize
Based on these indicators, Richardson expects 2017 will bring a more normalized housing market — one that still boasts a healthy number of sales but a moderate rate of price growth.
“According to a recent survey of Redfin agents, 54% predict prices will rise somewhat next year and 36% predict prices will level off,” says Richardson.
Ask Rick Sharga, executive vice president of Ten-X (previously Auction.com), and he’ll tell you that home price appreciation is likely to slow down next year, “although we’re still likely to see at least a 3 to 4% year-over-year increase,” he says.
“In 2017, we’re also projecting another modest increase in total home sales,” Sharga continues. “However, three headwinds continue to challenge the housing market’s recovery — tight credit, limited inventory, and rising prices, which are beginning to create some affordability problems in certain markets.”
Home Appreciation Might Slow, But Not Stop
Blomquist anticipates home appreciation to slow nationally to approximately 5% in six months and to 3.5% in 12 months.
“Based on bellwether markets across the country, where sales volume has been decreasing often for several months, I would expect sales volume nationally also to slow down in 2017,” says Blomquist.
“That slowdown could be accelerated by rising mortgage rates,” he says, “but even without rising interest rates I think enough markets are now hitting affordability and inventory constraints that demand will slow down. And as demand slows, inventory will gradually increase in 2017.”
Many parts of the country could see a small dip in property values over the next six to 12 months, predicts Brian Guth, regional vice president/branch manager for Cross-country Mortgage, Inc.
“But real estate, for most people, should still be thought of as a long-term hold with a great tax write-off, forced savings plan, and long-term appreciation,” Guth says. “My home has doubled in value since I purchased it in 2002, even though it was hit very hard in 2009.”
Colby Sambrotto, president of USRealty.com, expects home sale prices to gradually increase in 2017 as more moderately priced homes ease into the market.
“There’s a lot of demand right now for moderately priced houses that appeal to both first-time buyers and baby boomers who want to be in a right-sized house for aging in place. Across the country, most markets don’t have enough houses at or just below the median price in that market,” says Sambrotto.
Click to see today’s rates (Nov 24th, 2016)
Rising Rent Could Be Your Deciding Factor in 2017
Considering these housing market forecasts, many professionals say it’s wise for prospective home buyers to think about purchasing relatively soon.
Mortgage interest rates remain low and housing price are rising.
“I think it’s still a great idea for first-time buyers to purchase now, because most are paying high rents and need the tax write-offs that come with owning a home,” says Guth.
Richardson agrees that rental affordability is one of the biggest factors driving first-timers into the market.
“With rates at historic lows, buyers may be able to find a home with a monthly mortgage payment that is less than or equal to rent,” she says.
Richardson adds, “The conditions that challenged first-time and millennial homebuyers this spring are starting to ease. There are fewer bidding wars and less of a need to escalate significantly above the list price to get an offer accepted. And the pace of the market is also slowing, which helps buyers since they can now afford to be more patient.”
Should Buyers Put Off Their Purchase?
Blomquist says purchasing sooner versus later can be smart — so long as you view the home as a long-term investment.
“It’s probably not the best time if you are counting on your home value going up by another 20 or 30% in the next three years,” says Blomquist.
He also offers a mortgage rate forecast: “The rock-bottom interest rates make it a good time to be a borrower, but I don’t expect interest rates to rise dramatically in 2017.”
Sharga warns that trying to time the housing market can be as frustrating as trying to time the stock market.
“For first-time buyers seeking a place to live and possibly raise a family, it’s smart to have a long-term view on a home purchase,” says Sharga. “In many markets, prices are still below peak pricing from the boom years, so there are many markets across the country with excellent affordability.”
In addition, waiting for the next real estate crash and prices to go lower really isn’t a good strategy — “it’s much more likely that home prices will continue to go up over time and that interest rates will ultimately rise,” Sharga adds.


Quarterly Forecasts- The Canadian Real Estate Association (CREA)
Ottawa, ON, December 15, 2016
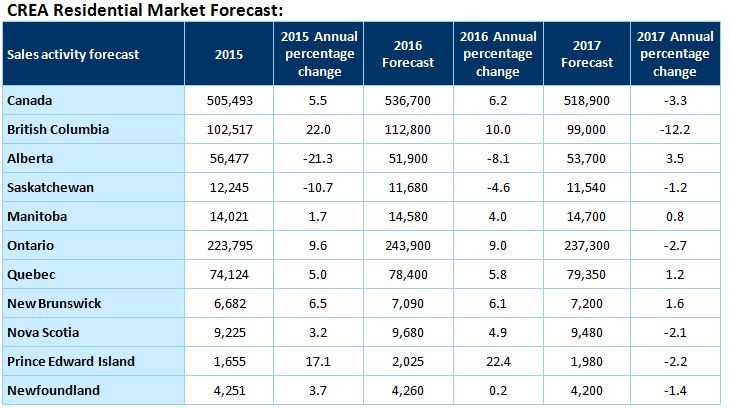
The Canadian Real Estate Association (CREA) has updated its forecast for home sales activity via the Multiple Listing Service® (MLS®) Systems of Canadian real estate Boards and Associations in 2016 and 2017.
Canadian housing market trends have evolved largely as expected since CREA last published its forecast in September. Sales activity in British Columbia is showing signs of returning to, and stabilizing at, more normal levels, while Ontario sales continue to set new records despite an unprecedented supply shortage in the Greater Toronto Area (GTA) and throughout the surrounding region (Greater Golden Horseshoe).
Mortgage regulations were further tightened following CREA’s previous forecast. In the near term, tightened regulations are expected to reduce the number of first-time buyers who qualify for mortgage financing, particularly in pricier markets where there is a severe shortage of lower-priced listings. Tightened mortgage regulations and lending guidelines are also expected to increase capital costs for lenders, resulting in modest increases in mortgage interest rates in the New Year. These regulatory headwinds were not a factor at the time of CREA’s previous forecast, and have resulted in downward revisions to the forecast for sales and average price in 2017.
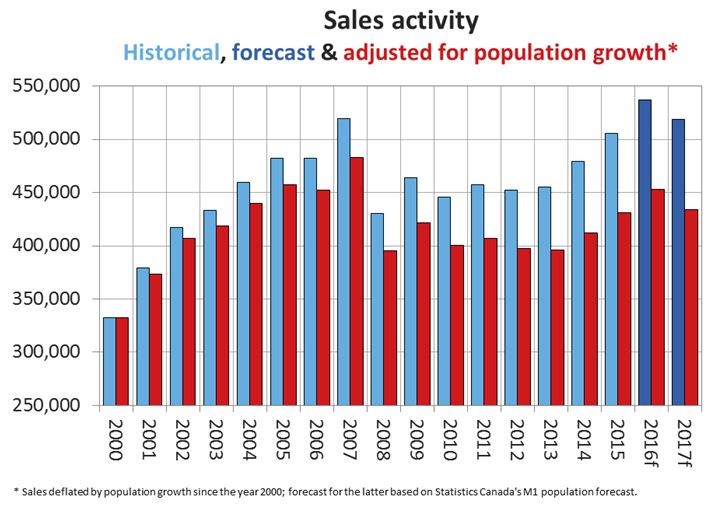
Nationally, sales activity is projected to rise by 6.2% to 536,700 units in 2016. This represents a slight upward revision from CREA’s previously forecast increase of 6.0%. However, the forecast for sales activity was revised upward for Ontario and downward for British Columbia.
Projected annual sales for 2016 would represent a new annual record for national activity, up 3.3% from the previous record set in 2007. That said, after adjusting for population growth, sales are nonetheless expected to remain below the 2007 peak.
Among Canada’s most populous provinces, British Columbia is still forecast to post the largest annual increase in activity (+10.0%) due to unprecedented strength in sales there early this year. Ontario’s annual increase in sales (9%) is anticipated to be nearly as large.
Prince Edward Island should post the largest annual percentage increase in sales this year (+22.4 percent), making it one of only four provinces to set a new annual sales record in 2016 (along with British Columbia, Manitoba and Ontario).
Among provinces where housing market prospects are closely tied to the outlook for natural resource prices, Alberta is still expected to record the largest annual decline in activity in 2016 (-8.1 percent), followed by Saskatchewan (‑4.6%). Meanwhile, annual activity in Newfoundland and Labrador is now anticipated to register almost no change in 2016 as compared to 2015.
Elsewhere, sales are forecast to rise in Manitoba (+4.0%), Quebec (+5.8%), New Brunswick (+6.1%) and Nova Scotia (+4.9%). In the latter three provinces, activity has been slowly but steadily gaining momentum, and 2016 is expected to mark a multi-year high for annual sales.
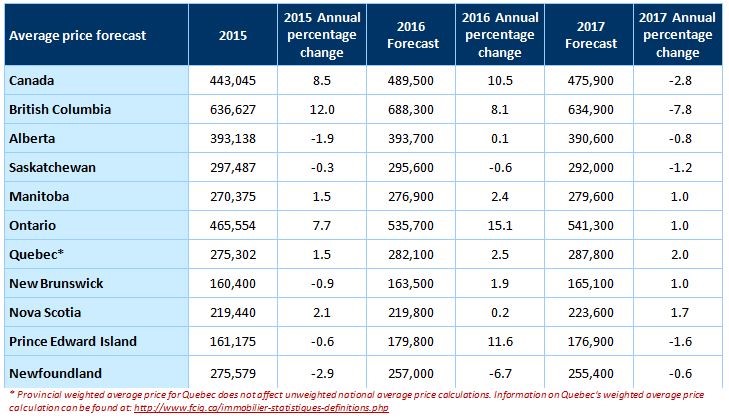
Year-over-year average price gains have continued to accelerate in Ontario amid strong demand in the face of an unprecedented supply shortage. Meanwhile, average prices in British Columbia have receded due to a sharp decline in multi-million-dollar single detached home sales in the Lower Mainland.
As a result, the projected annual average price for Ontario in 2016 has again been upwardly revised compared to CREA’s previous forecast, while the projected annual average price for British Columbia has again been downwardly revised. As with the revisions to forecast sales, revisions to average price forecasts for these provinces mostly offset each other at the national level.
In provinces where economic and housing market prospects are closely tied to the outlook for the oil patch and other natural resource industries, average prices appear to be stabilizing in Alberta and Saskatchewan but remain down from year-ago levels in Newfoundland and Labrador. Average prices in other provinces are either rising modestly or holding steady, reflecting well balanced supply and demand for housing stock.
The national average price is now projected to rise by 10.5% to $489,500 in 2016, with a slightly smaller gain in British Columbia ($688,300; 8.1%) and a larger gain in Ontario ($535,700; 15.1%). Elsewhere, average prices are forecast to rise by 2.4% in Manitoba, 2.5% in Quebec and 1.9% in New Brunswick. Annual average prices in Alberta, Saskatchewan and Nova Scotia are projected to remain largely stable.
By comparison, the forecast average price increase (11.6%) for Prince Edward Island has been revised upward to reflect an exceptionally strong price gain recorded in the third quarter. By contrast, average price in Newfoundland and Labrador is now forecast to ease by -6.7%.
In 2017, national sales are forecast to number 518,900 units, representing a decline of 3.3% compared to projected activity this year. Transactions in B.C. and Ontario are anticipated to remain strong but fall short of this year’s record levels due to deteriorating affordability, an ongoing shortage of affordably priced listings for single family homes and tightened mortgage regulations. British Columbia home sales are forecast to decline by 12.2%, while annual sales in Ontario are forecast to retreat by 2.7%.
Sales are also forecast to ease slightly in 2017 in Saskatchewan (-1.2%), Nova Scotia (-2.1%), Prince Edward Island (‑2.2%) and Newfoundland and Labrador (-1.4%).
The downward revision to forecast sales in Prince Edward Island reflects unexpected strength in sales this year that is not expected to reoccur in 2017. Nonetheless, sales for the province are expected to remain strong, as its economy should continue benefiting from a weakened Canada-U.S. currency exchange rate.
Sales in 2017 are forecast to rise by 3.5% in Alberta and by 1.2% in Quebec. The forecast rise in Alberta’s sales in 2017 mostly reflects slow sales activity in the first quarter of 2016, a repeat of which is not expected. Sales are also forecast to improve modestly in Manitoba (+0.8%) and New Brunswick (+1.6%).
The national average price is forecast to decline by 2.8% to $475,900 next year, with modest price gains near or below inflation in Manitoba, Ontario, Quebec, New Brunswick and Nova Scotia, together with small declines of a similar magnitude in Alberta, Saskatchewan, Prince Edward Island and Newfoundland and Labrador.
While the average sale price in British Columbia is expected to decline by 7.8% in 2017, this largely reflects an anticipated decline in single family home sales activity at the higher end of the market – particularly in the Lower Mainland.
The forecast dip in the national average price in 2017 along with a decline in British Columbia is expected to be similar to the trend in 2012, when a more normal year for activity in Greater Vancouver followed record level sales activity for multi-million dollar homes in 2011. As such, the forecast decline reflects the influence exerted by the composition of sales activity on average price (as it did in 2012 versus 2011).
Meanwhile, an ample supply of listings relative to demand is anticipated to keep price gains in check in other provinces, although sales have begun to draw down inventories in provinces where supply had been elevated in recent years.
US Housing Market
Housing Market Forecast: Experts Weigh In On 2017 Real Estate

US jobless rate falls to lowest level since crisis
Trump inherits economy that is shedding vestiges of financial crash
Low Mortgage Rates, High Demand Fueled 2016 Housing Market
The year 2016 proved to be a hot one for real estate.
Home values, prices and sales showed some of their strongest numbers since before the economic downturn a few years ago.
And mortgage rates were downright cheap.
But there’s no guarantee favorable conditions for buying and borrowing will continue in the months ahead.
Consequently, it’s fair to ask the question: Will housing prices keep climbing into 2017?
Industry experts weigh in. Though no one can tell the future, their housing market forecast can help first-time home buyers make better decisions this year and next.
Should you buy now, or wait? Here is advice from leading experts.
Home Prices Near Pre-Recession Peak
First, a closer look at the current climate on housing prices nationally.
Home prices continue to post steady year-over-year gains and are nearly back to pre-recession highs, based on 90.6 million U.S. single-family homes and condos tracked by real estate data firm ATTOM Data Solutions.
In July, for example, the national median home price for single-family homes and condos collectively was $226,500 – an increase of 7% from a year earlier and the 53rd consecutive month with a year-over-year increase.
This is within a half percent of the pre-recession peak price observed in July 2005, says Daren Blomquist, senior vice president for ATTOM Data Solutions.
But looking closer at market indicators reveals further truths.
“The strong national sales price numbers mask a shift in the market where we are seeing home price appreciation weaken in some previously high-flying and high-priced markets while continuing to strengthen in some of the secondary markets,” says Blomquist.
Case in point: In July, home price appreciation in San Jose and San Francisco was each 5%, the former down from 16% a year earlier. San Francisco was down from a high of a 32% rate of appreciation in July 2013.
Secondary markets like Portland, Denver and Seattle, meanwhile, all experienced appreciation increases in 2016 versus one year ago.
Nela Richardson, chief economist for Redfin, agrees that bullish real estate sales prices are decelerating.
“After several years of steady and steep price growth, we are seeing indications that price growth is slowing and the market is normalizing,” says Richardson. “Redfin housing market data indicate that home prices in August rose just 4.4% compared to 2015 — the slowest pace of the year.”
Prediction: Housing Market To Normalize
Based on these indicators, Richardson expects 2017 will bring a more normalized housing market — one that still boasts a healthy number of sales but a moderate rate of price growth.
“According to a recent survey of Redfin agents, 54% predict prices will rise somewhat next year and 36% predict prices will level off,” says Richardson.
Ask Rick Sharga, executive vice president of Ten-X (previously Auction.com), and he’ll tell you that home price appreciation is likely to slow down next year, “although we’re still likely to see at least a 3 to 4% year-over-year increase,” he says.
“In 2017, we’re also projecting another modest increase in total home sales,” Sharga continues. “However, three headwinds continue to challenge the housing market’s recovery — tight credit, limited inventory, and rising prices, which are beginning to create some affordability problems in certain markets.”
Home Appreciation Might Slow, But Not Stop
Blomquist anticipates home appreciation to slow nationally to approximately 5% in six months and to 3.5% in 12 months.
“Based on bellwether markets across the country, where sales volume has been decreasing often for several months, I would expect sales volume nationally also to slow down in 2017,” says Blomquist.
“That slowdown could be accelerated by rising mortgage rates,” he says, “but even without rising interest rates I think enough markets are now hitting affordability and inventory constraints that demand will slow down. And as demand slows, inventory will gradually increase in 2017.”
Many parts of the country could see a small dip in property values over the next six to 12 months, predicts Brian Guth, regional vice president/branch manager for Cross-country Mortgage, Inc.
“But real estate, for most people, should still be thought of as a long-term hold with a great tax write-off, forced savings plan, and long-term appreciation,” Guth says. “My home has doubled in value since I purchased it in 2002, even though it was hit very hard in 2009.”
Colby Sambrotto, president of USRealty.com, expects home sale prices to gradually increase in 2017 as more moderately priced homes ease into the market.
“There’s a lot of demand right now for moderately priced houses that appeal to both first-time buyers and baby boomers who want to be in a right-sized house for aging in place. Across the country, most markets don’t have enough houses at or just below the median price in that market,” says Sambrotto.
Rising Rent Could Be Your Deciding Factor in 2017
Considering these housing market forecasts, many professionals say it’s wise for prospective home buyers to think about purchasing relatively soon.
Mortgage interest rates remain low and housing price are rising.
“I think it’s still a great idea for first-time buyers to purchase now, because most are paying high rents and need the tax write-offs that come with owning a home,” says Guth.
Richardson agrees that rental affordability is one of the biggest factors driving first-timers into the market.
“With rates at historic lows, buyers may be able to find a home with a monthly mortgage payment that is less than or equal to rent,” she says.
Richardson adds, “The conditions that challenged first-time and millennial homebuyers this spring are starting to ease. There are fewer bidding wars and less of a need to escalate significantly above the list price to get an offer accepted. And the pace of the market is also slowing, which helps buyers since they can now afford to be more patient.”
Should Buyers Put Off Their Purchase?
Blomquist says purchasing sooner versus later can be smart — so long as you view the home as a long-term investment.
“It’s probably not the best time if you are counting on your home value going up by another 20 or 30% in the next three years,” says Blomquist.
He also offers a mortgage rate forecast: “The rock-bottom interest rates make it a good time to be a borrower, but I don’t expect interest rates to rise dramatically in 2017.”
Sharga warns that trying to time the housing market can be as frustrating as trying to time the stock market.
“For first-time buyers seeking a place to live and possibly raise a family, it’s smart to have a long-term view on a home purchase,” says Sharga. “In many markets, prices are still below peak pricing from the boom years, so there are many markets across the country with excellent affordability.”
Additionally, waiting for the next real estate crash and prices to go lower really isn’t a good strategy — “it’s much more likely that home prices will continue to go up over time and that interest rates will ultimately rise,” Sharga adds.
What Are Today’s Mortgage Rates?

© Bloomberg
December 2, 2016
by: Shawn Donnan in Washington and Mamta Badkar in New York
Donald Trump will inherit a US economy in rude health with new employment data on Friday adding to growing evidence that the world’s largest industrialised economy is emerging from the long shadow of the 2008 global financial crisis.
The US economy added 178,000 jobs in November with the unemployment rate falling to 4.6 per cent, its lowest level since August 2007. The data added to expectations the Federal Reserve will raise interest rates for only the second time since the crisis when its policy committee meets this month.
The strong numbers, which mean the US economy has added 15.6m jobs since its post-crisis nadir in early 2010, comes at the end of a week where a key housing price index surpassed its pre-crisis peak for the first time and gross domestic product growth for the third quarter was revised upwards to a robust 3.2 per cent.
The growing evidence of a return to economic health highlights a welcome paradox facing Mr Trump as he prepares to take office.
The president-elect’s victory came thanks to his ability to tap into economic discontent, particularly in the US rust belt which was highlighted by his flight to Indiana this week to announce a deal to save almost 1,000 jobs at air conditioning manufacturer Carrier.

But the data point to the fact that much of the repair job has already been done by his predecessor, Barack Obama. The OECD said in its latest forecast that it expected the US to be the best performing large advanced economy in 2017, growing 2.3 per cent. Other data this week highlighted a “sustained acceleration” in US manufacturing.
Steven Mnuchin, Mr Trump’s nominee for treasury secretary, this week promised to oversee an economy that would grow regularly at an annual rate of 3-4 per cent thanks to a combination of tax cuts and deregulation aimed at spurring business investment and hiring.
In a bid to give business a voice in economic policy, the Trump administration on Friday also announced the establishment of a special advisory body made up of top executives chaired by Blackstone’s Stephen Schwarzman and including Bob Iger, chief executive of Disney, and former General Electric boss Jack Welch.
But data released this week pointed to an economy already well on its way to the sort of job-boosting growth Mr Mnuchin is targeting, even before the much-anticipated fiscal stimulus a Trump administration is expected to bring with it.
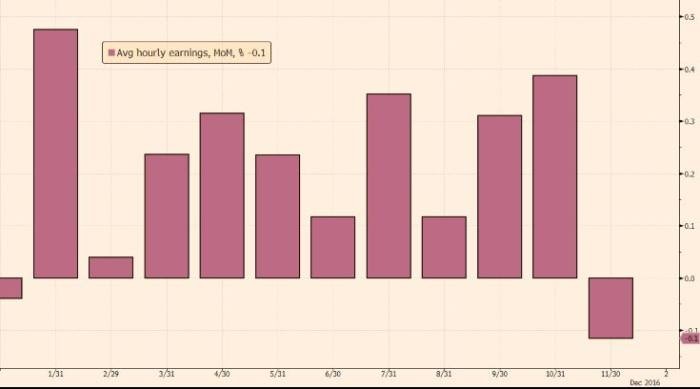
Friday’s jobs report, which was just shy of economists’ expectations of 180,000, did contain some cautionary points.
Average hourly earnings unexpectedly dipped 0.1 per cent from the previous month and the participation rate — the number of working age Americans in or actively seeking jobs — fell to 62.7 per cent.
But economists said the slip in wages was largely a seasonal blip in hiring patterns and said the overall positive report cleared the way for Fed policymakers to raise rates when they gather December 14, in what would be another sign of the US economy’s relative return to normality.
“The November employment report seals the case for a [Fed] rate increase later this month, in our view,” said Jan Hatzius, an economist at Goldman Sachs.
“This was the last hurdle on the path to a December hike, and it has been cleared convincingly,” said Luke Bartholomew at Aberdeen Asset Management. “It is now incredibly hard to imagine what would stop the Fed from going.”
Fed sees three interest rate rises in 2017
Central bank lifts short-term rates for only second time since financial crisis

Janet Yellen © Getty
Bottom of Form
December 14, 2016
by: Sam Fleming in Washington and Eric Platt in New York
The US Federal Reserve has raised short-term interest rates for the second time in a decade and forecast a faster pace of tightening in the coming year, as it responds to a US economy that has been gathering momentum and may receive further stimulus from Republican tax cuts.
With the US on the cusp of full employment and inflation gradually approaching the Fed’s target, the central bank raised the target range for its federal funds rate by a quarter-point to 0.5-0.75 per cent, as was widely expected in the financial markets.
Following a long procession of downgrades to its interest-rate forecasts in recent quarters, the central bank’s policymakers pencilled in a median projection of three quarter-point increases for 2017, up from two previously.
The decision to lift rates on Wednesday, which was unanimous, came in the Fed’s final meeting before president-elect Donald Trump is due to take office, and as Republicans contemplate tax-cutting plans that could add further fuel to the recovery.
Janet Yellen, Fed chair, told a press conference that the rate increase was a “reflection of the confidence we have in the progress the economy has made and our judgment that that progress will continue. The economy has proven to be remarkably resilient”.
However, she also played down the scale of the forecast changes, calling the new interest-rate outlook a “modest adjustment” by some of the Fed’s policymakers. “We continue to expect the evolution of the economy will warrant only gradual increases [in interest rates],” Ms Yellen said.
While the Fed chair was repeatedly pushed to discuss the impact of Republican tax and spending plans on the Fed, not all policymakers had factored the prospect of fiscal changes into their new outlooks. “We are operating under a cloud of uncertainty at the moment,” she said.

“Changes in fiscal policy or other economic policies could potentially affect the economic outlook,” she added. “Of course, it is far too early to know how these policies will unfold. Moreover, changes in fiscal policy are only one of the many factors that can influence the outlook in the appropriate course of monetary policy.”
Treasuries slid after the decision, with the yield on the two-year note climbing 10 basis points to 1.26 per cent. Selling was concentrated in the front of the yield curve, most sensitive to changes in monetary policy.

The US Housing Forecast is Looking Good 2017 to 2020 and Beyond
Gord Collins
Welcome to 2017! I hope you’re having happy thoughts about buying, investing and selling in 2017. More experts are predicting a strong year ahead for US housing in 2017 with almost no risk of a crash downturn. They see existing home sales of 6 to 6.5 million in 2017 along with 160,000 new homes being built per year up to 2024. When builders are feeling optimistic, it’s a good omen.
What’s also a good omen is what you’re going to read in this post. It may impact your choice about many things in 2017, from employment, to finding the best investments 2017 to moving where opportunity is.
Interest in rental income investment and apartments is particularly strong now in places like Dallas, Seattle and San Francisco. Whether you’re in Los Angeles, San Diego, San Francisco Bay Area, Seattle, Denver, Miami or New York, the outlook for return on investment is positive. See this post on investing in rental income property.
You won’t find too many US housing forecasts beyond 2017, yet we’re looking looking for the best cities to invest in real estate, where to buy a home, and whether this is a good time to sell your home.
Here’s a short list of positive factors that will affect the housing market 2017 and beyond:
- moderately rising mortgage rates
- low risk of a housing crash for most cities
- millennials buyers coming into the main home buying years
- a trend to government deregulation
- labor shortages pushing up costs of production
- the economy will keep going – longest business cycle in history
- Donald Trump and his “drain the swamp” crew
- The biggest factor even for 2017 is Donald Trump. The repatriation of business back to the US may come with a big price — a high dollar and strong inflation. Trump has spoken on another matter that might seem inconsequential – that of forgiving student loan debt after 15 years. Young people including Millennials can’t buy homes because of massive student loan debts that kill their credit scores and keep them unable to save for the down payment. That’s called a syndrome.
- To be on the safe side, see this post on the likelihood of a US housing market crash in the years ahead.
Expert Predictions – US Housing
Expert Prediction from Eric Fox, vice president of statistical and economic modeling (Vero Forecast) — The top forecast markets shows price appreciation in the 10% to 11% range. The top forecast market is Seattle, Washington at 11.2%, followed by Portland, Oregon at 11.1% and Denver, Colorado at 9.9%.
These economies have robust economies, growing populations and no more than two month’s supply of homes. In fact, the forecast of the Boston market increase sharply to 7.4% is due to reductions in inventory and unemployment. On the other hand, the worst performing market is Kington, New York with 2.5% depreciation, followed by Ocean City, New Jersey at -2.1%, Kingsport, Tennessee at -1.9% and Atlantic City, New Jersey and San Angelo, Texas tied at -1.4%. — Business Wire
Pantheon Macro Chief Economist Ian Shepherdson explains that “Homebuilders behavior likely is a continuing echo of their experience during the crash. No one wants to be caught with excess inventory during a sudden downshift in demand. In this cycle, the pursuit of market share and volumes is less important than profitability and balance sheet resilience.” — Market watch.
Housing Construction Starts Will Slowly Rise
It’s predicted that new home construction won’t keep up with demand, however it is recovering and we’ll see more renters becoming homeowners over the next decade.
Forisk Research projects US Housing starts continuing at 1.5 Million per year to 2024 #ushousing #homes… Click To Tweet
US Housing Construction Starts All Time – on the Rise Again
Let’s begin with a look at how home prices have grown up to 2016. Nationwide prices are still $50,000 below the pre-recession highs. Will it take 3 to 4 more years to reach those highs? If construction rates do moderate, prices in the hot markets of Miami, San Francisco, Los Angeles, San Diego, New York, Boston, and Phoenix should rocket to all-time highs but what is the risk of a housing market crash?
Mortgage Rate Trends
Mortgage rates are forecast to stay low. Yet recently, mortgage rates have risen above the 4% mark and homeowners are locking in their home loans at the 30 year period. Some are calling this the Trump Effect. With Trump in power, lending requirements are expected to be eased, land opened up for development, and this should stimulate home purchases. With employment growing and wages moderating upward, the market is set for growth. Yet, some housing forecasters still cling to the idea that housing starts will moderate after strong growth to 2020.
US Housing Starts to 2024
The enlightening statistic presented in the graphic below shows the US economy hasn’t recovered from the great recession and housing crash of 2007. Single family spending is rising rapidly, yet no one believes conditions for high inflation exist. It points to years of solid, healthy growth ahead with an unfulfilled demand for single detached homes.
Graphic courtesy of paper-money.blogspot.ca
2016 Non Farm Payrolls
With the price of oil forecast to be rising again, it’s unlikely that economic winds will inflate wage demands. From 2017 on, wage demands should ease from their hot rates as you can see here:
Graphic courtesy of paper-money.blogspot.ca
Graphic courtesy of paper-money.blogspot.ca
US Housing starts are forecast to grow strong this year and next, particularly single family homes which will rise about 30%.
Chart stats courtesy of realtor.org
Home Ownership: The home ownership rate is predicted to continue growing to 2020. #housing #mortgage… Click To Tweet

Housing Starts Forecast to 2020 — Graphic courtesy of tradingeconomics.com/united-states/forecast
Employment Outlook: Let’s not forget jobs. Total employed persons in the US will grow 800,000 over the next 2 years.
Graphic courtesy of tradingeconomics.com/united-states/forecast
Existing homes or resale home sales, may slow slightly but US construction spending will increase. Prices will rise to 2020 and construction spending will grow through 2020.
Graphic courtesy of tradingeconomics.com/united-states/forecast
Mortgage Rate Trends
Mortgage rates are forecast to stay low. Yet recently, mortgage rates have risen above the 4% mark and homeowners are locking in their home loans at the 30 year period. Some are calling this the Trump Effect. With Trump in power, lending requirements are expected to be eased, land opened up for development, and this should stimulate home purchases. With employment growing and wages moderating upward, the market is set for growth. Yet, some housing forecasters still cling to the idea that housing starts will moderate after strong growth to 2020.

US Housing Starts to 2024

The enlightening statistic presented in the graphic below shows the US economy hasn’t recovered from the great recession and housing crash of 2007. Single family spending is rising rapidly, yet no one believes conditions for high inflation exist. It points to years of solid, healthy growth ahead with an unfulfilled demand for single detached homes.

Graphic courtesy of paper-money.blogspot.ca
2016 Non Farm Payrolls
With the price of oil forecast to be rising again, it’s unlikely that economic winds will inflate wage demands. From 2017 on, wage demands should ease from their hot rates as you can see here:

Graphic courtesy of paper-money.blogspot.ca
Graphic courtesy of paper-money.blogspot.ca
US Housing starts are forecast to grow strong this year and next, particularly single family homes which will rise about 30%.

Home Ownership: The home ownership rate is predicted to continue growing to 2020. #housing #mortgage… Click To Tweet
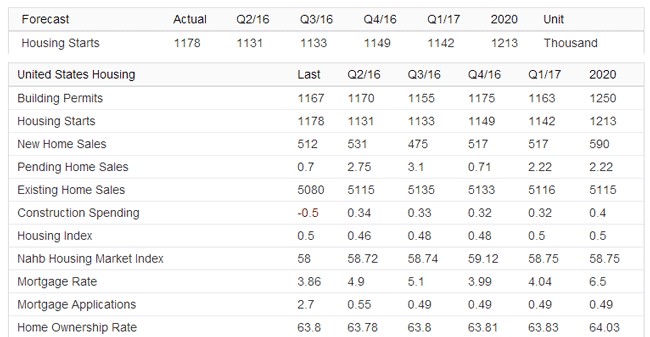
Housing Starts Forecast to 2020 — Graphic courtesy of tradingeconomics.com/united-states/forecast
Employment Outlook: Let’s not forget jobs. Total employed persons in the US will grow 800,000 over the next 2 years.