The year of the fire rooster was a humdinger. Lots of social, political and economic anxiety and uncertainty. The rise of populism working against globalization. 2018 will be very interesting. Happy New Year!
Banyan For Asia, the path to prosperity starts with land reform
Countries that did it properly have grown fastest

Oct 12th 2017
NEARLY as striking as Asia’s dynamism is how unevenly prosperity is spread—in contrast to Africa, Latin America or Europe. First-world Japan (with a GDP per person of $38,900) is in effect part of the same island chain as the Philippines ($2,950). Rich Singapore ($53,000) is little more than an hour’s flight from Myanmar ($1,275). On the Korean peninsula, the division is even starker. Two economies that started out in identical circumstances have diverged so wildly that South Koreans are between 3cm and 8cm taller than their North Korean counterparts on average, depending on their age, thanks to better nutrition.
A voluminous literature ponders the causes of the East Asian miracle, in which first Japan, then the four original “Asian tigers”—Hong Kong, Singapore, South Korea and Taiwan—and then China sustained bounding growth for decades. Most studies point to market-friendly policies that encouraged exports of manufactures and the rapid accumulation of capital, including the human sort. Others emphasise the importance of institutions. Yet one crucial factor has been relatively underplayed: restructuring agriculture.
“Land reform” sounds innocuous but involves great upheaval: seizing land from those who have it and giving it to those who do not. Yet radical action may be necessary in countries with big, impoverished, rural populations. As Joe Studwell points out in “How Asia Works”, farm yields often stagnate in such places. As populations grow, making land scarce, landlords jack up rents and lend at extortionate rates. That leaves poor tenant farmers mired in debt, with no means to invest.
China provides a stark example. By the 1920s, a tenth of the population owned over seven-tenths of the arable land. Three-quarters of farming families had less than a hectare. Mao Zedong’s Communists reallocated land in every new territory they seized. After the defeat of the Kuomintang (KMT) in 1949, they rolled out land reform nationwide. Landlords, some with scarcely more land than most, were blamed for everything. In the decade after 1945, millions of them were beaten to death or shot, or left to starve. Revolution, Mao said, was not a dinner party.
The effect was immediate. Grain output leapt by perhaps 70% in the decade after the war. When farmers can capture most of the value of their land, they have a powerful incentive to produce. And while smallholder agriculture is hugely labour-intensive that makes sense when labour is abundant. (Only a few years later the Communists embarked on the madness of collectivisation. China emerged from that disaster in 1978, after Mao died. North Korea is starting to do so only now.)
China’s early success challenged Japan, South Korea and Taiwan. These countries, pressed by America to carry out land reform, showed that it does not require mass murder. By the war, half of Japan’s arable land was worked by tenant farmers, and rent was never less than half the crop. After the war, farm size was limited to three hectares. Land committees on which tenants outnumbered landlords oversaw a reapportionment that took land from 2m households and gave it to 4m others. Compensation fell short (and was gobbled up by inflation), but there was little violence among farmers. Perhaps it helped to be able to blame the occupiers when politely taking over someone’s paddy field. At any rate, agriculture boomed.
South Korea had the most unequal land ownership in the region, and resistance by the elites was strongest. Some landlords lost as much as 90% of their land. But Taiwan under the KMT shows the clearest benefits from land reform, which started with rent controls and reforms to tenancy. Sales of formerly Japanese-owned land followed. Then, in 1953, came appropriation. The share of land tilled by the owner rose from just over 30% in 1945 to 64% in 1960. Yields on sugar and rice leapt. New markets sprang up for exotic fruits and vegetables. Household farmers dominated early exports. Crucially, income inequality shrank thanks to the new farmer-capitalists. Less spent on imports of food, more money in Taiwanese pockets, a new entrepreneurialism: farming was the start of Taiwan’s economic miracle.
Cheap at half the price
Indonesia, Malaysia and Thailand could have followed Taiwan’s example, but didn’t. Their economies have done far worse. With between 25% (Malaysia) and 48% (Thailand) of their populations still living in the countryside, land distribution matters. The state favours agribusiness and plantations over small farmers. There is a yawning gap in income between countryside and city.
The situation is worse in the Philippines, which had a similar income per person to Taiwan’s just after the war. Before independence in 1946, America auctioned off the Catholic church’s huge estates. Only the local elites could afford them. These became the hacienda class that thrives today, forming the basis of many political dynasties. Admittedly, after the People Power revolution (led by Cory Aquino, from one landed family, who married into another), political pressure for land redistribution culminated in a reform law passed in 1988. Nearly 30 years on the law, replete with loopholes, is still being implemented. The operations of many big estates have hardly been affected, while household farmers still lack technical and financial support. Many of those given plots have had to lease them back cheaply to the big planters, becoming wage labourers on their own land.
There are political consequences too. In South Korea and Taiwan inclusive agricultural growth prefigured the inclusive politics of today’s thriving democracies. In South-East Asia, by contrast, cronyism and inertia are consequences of an economy that is unfair to those at the bottom. The Philippines and Thailand have most clearly paid a price, in the form of insurgencies and rural unrest, for keeping poor people down. When weighed against the costs, land reform, done well, starts to look cheap.
This article appeared in the Asia section of the print edition under the headline “Land to the tiller”
Sep 2, 2017 | 15:44 GMT
Will the U.S. Free Itself From a South Korean Trade Deal?

(NICHOLAS KAMM/AFP/Getty Images)
The White House is considering beginning the official withdrawal process from the U.S.-Korea Free Trade Agreement (KORUS) next week, several sources have told Inside U.S. Trade. The online publication noted in a Sept. 1 report that U.S. President Donald Trump has not made a final decision on whether to make the move, but the news source also reported that the draft notice has been written and that several members of Congress have been told it will be announced Sept. 5.
The U.S. trade pressure on South Korea comes as Washington is trying to maintain Seoul’s cooperation in reining in North Korea. The two negotiations have run on parallel tracks, and South Korea is aware that the United States will pursue its trade agenda regardless of Seoul’s cooperation against Pyongyang. However, trade has the potential to drive a wedge between the two allies, particularly as South Korea mulls the pursuit of a softer stance toward the North to avert a military conflict.
Issuing a Threat to Force a Move
While the Trump administration is almost certainly considering a clean break from KORUS, the media leaks and the threat of withdrawal are as much a negotiating tactic as anything else. In July, the United States called for a special meeting of the agreement’s joint committee to discuss modifying the deal after arguing that KORUS has unfairly hurt the United States. Since the agreement came into force in March 2012, the U.S. trade deficit with South Korea has increased from $15.1 billion in 2011 to $29.7 billion in 2016. When the joint committee finally met on Aug. 22, talks went nowhere. The United States demanded the two countries renegotiate the deal, but South Korea said it would reject any changes to the agreement that did not come with a recommendation from an objective joint study. This difference in views echoes the disagreement between the two sides during South Korean President Moon Jae In’s visit to Washington in June, when Trump said the United States and South Korea were negotiating a new trade agreement but Seoul remained conspicuously silent about such an arrangement.
By threatening to withdraw from the trade deal, the United States is hoping to force South Korea back to the negotiating table. This is the second time that the United States reportedly has been close to withdrawing from an existing trade deal. In April, there were leaks that the United States was about to pull out of the North American Free Trade Agreement (NAFTA), forcing Mexican President Enrique Pena Nieto and Canadian Prime Minister Justin Trudeau to hurriedly phone Washington to object. While the more recent threat may be a negotiating tactic, it is far more realistic than the threat to leave NAFTA.
After all, KORUS is a 5-year-old trade deal between two countries an ocean apart, whereas NAFTA is a 25-year-old trade deal between three countries on a deeply integrated continent. Over the last quarter-century, the United States, Canada and Mexico have developed closer links and sophisticated supply chains where goods crisscross national borders multiple times before finally being sold to end consumers. These deeply interwoven supply chains are difficult to unravel, and the outright breakdown of NAFTA would cause immediate economic pain to a considerable portion of the U.S. electorate — and key Republican Party constituencies. States, communities and a number of powerful industries provide a significant counterweight that constrains Trump’s ability to completely rip apart NAFTA.
The same level of supply chain integration with South Korea does not exist. The vast majority of U.S. imports from South Korea are finished products that go to end consumers. The products include $16.4 billion worth of automobiles in 2016 and $7 billion in phones, representing about a third of U.S. imports from South Korea alone. As a result, there would be less of a lobbying push from U.S. industry and fewer immediate consequences to communities and regions dependent on U.S.-South Korean trade.
A Perception of Caution Abandoned
Should the United States actually issue a withdrawal notice — even if its ultimate intention is to make South Korea decide between negotiating or losing the free trade agreement — it would change how the world sees the country’s trade negotiation strategy. So far under Trump, the United States has taken a cautious approach toward trade policy. The key professional free trade camp within the White House — led by Treasury Secretary Steven Mnuchin, chief economic adviser Gary Cohn and, to a lesser extent, Secretary of State Rex Tillerson — has been able to prevent Trump from going to the extreme or taking drastic measures. A withdrawal from KORUS would shatter confidence that they would be able to continue to do so.
This newfound doubt would have important implications for Washington’s other ongoing trade negotiations. The most critical of these talks concern NAFTA, with a second round of negotiations taking place Sept. 1 to Sept. 5. Trump already has threatened to pull out of the deal once. Last month as the talks began, Trump complained on Twitter that Canada and Mexico were being “very difficult” in negotiations. There has long been speculation that Trump might try to weaken Mexico’s and Canada’s hands by issuing a formal withdrawal notice — which takes six months to complete — and then negotiating during the countdown as a way to reduce their leverage.
By pulling out of KORUS, Trump would be announcing to the world that he is willing to put his money where his mouth is and sever trade ties with countries. Until now, his policy has focused more on orderly negotiations and higher levels of trade agreement enforcement, but if the president pulls the trigger on KORUS next week, that policy will change.
Oct 2, 2017 | 07:58 GMT
Korean Economy, Construction & Lumber Shipments
By Tai Jeong

Technical Director, Canada Wood Korea
October 30, 2017
Posted in: Korea
Economy
South Korea’s economic growth hit a seven-year record high in the third quarter of 2017 mainly due to increased construction investment and exports.
South Korea’s gross domestic product in the third quarter increased 1.4% from the previous quarter, faster than the previous quarter’s 0.6% on-quarter gain and improved 3.6% from a year earlier.
Government spending increased by 2.3% in the third quarter, the highest since the first quarter of 2012, when it came to 2.8% and construction investment grew 1.5%, faster than the previous quarter’s 0.3% on-quarter gain.
On the back of rising global demand, exports, South Korea’s key economic driver, grew a solid 6.1%, the highest since the first quarter of 2011.
However, South Korea’s private consumption has remained in the doldrums for months as consumer sentiment dropped for two straight months to a five-month low of 107.7 in September. Consumer prices continued their sharp growth in September to 2.1% from a year earlier due to high-flying food prices.
South Korea’s jobless rate stood at 3.4% in September, down 0.2 percentage point from a year ago.
The exchange rate for Canadian Dollar averaged at 903.08 won in the third quarter of 2017, up by 4.95% from 860.47 in the second quarter of 2016 and also down by 7.40% from 840.88 in the previous quarter.
Construction
In early September, the South Korean government announced a fresh set of regulations to cool down the overheated housing market, a month after in October adopting strong measures for Seoul and other cities. Household loans in South Korea accounted for 95% of all household debt, which stood at 1,388 trillion won (US$1.23 trillion) as of the first half of 2017. Mortgage loans took up 54% of all household loans.
Amid ongoing government intervention to limit the supply of new homes, especially new apartment in Seoul, South Korea’s housing starts in number of buildings in the first eight months of 2017 decreased 14.3% to 67,077 buildings from a year earlier 78,264 buildings while that in number of units significantly decreased 22.4% to 311,098 units from a year earlier 400,898 units. Housing permits in number of buildings and units for the same period of 2017 also decreased 9.7% and 15.9% respectively to 79,999 buildings and 396,469 units from a year earlier 88,614 buildings and 471,528 units. This downward trend in both housing starts and permits is set to be precipitated by the government’s measures aimed at curbing rising house prices and a planned cut in public infrastructure spending.
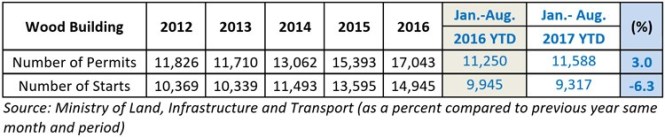
While the overall residential construction sector struggles, the number of wood building permits in the eight months of 2017 increased 3.0% to 11,588 buildings from a year earlier. However, the number of wood building starts for the same period decreased 6.3% to 9,317 buildings.
Total floor areas of wood building permits for the same period in 2017 increased 6.6% to 1,060,196 m2but that of wood building starts slightly decreased 3.6% to 866,930 m2 from a year earlier.
Lumber Shipments
Owing to the increased percentage use of Canadian lumber in wood building sector and price competitiveness of Canadian lumber resulted by 0% tariff as a benefit of the CAN-KOR FTA, BC softwood lumber export volume to South Korea for the first eight months of 2017 increased 5.7% to 196,631 cubic meters as compared to 186,005 cubic meters for the same period of 2016.
Export value for the same period also increased 17.3% to CAD$56.954 million as compared to CAD$48.559 million for the same period in 2016.

Safe against Fire, ‘Age of Tall Wood Mass Timber’ Begins
By Sunny Kim

Program Manager / Market Development & Market Access, Canada Wood Korea
October 30, 2017
Posted in: Korea

CLT floor test
The two-hour fire resistive performance of a wood frame construction (WFC) was proven for the first time in South Korea. The National Institute of Forest Science (NIFoS), formerly known as KFRI, tested five different main structural members of tall wood mass timber such as glued laminated timber columns and beams and Cross Laminated Timber (CLT) floor and wall materials in the fire certificate testing performed at the Korea Institute of Civil Engineering and Building Technology (KICT). The test materials satisfied the two-hour fire resistive performance.
According to the Building Act of Korea, 5 to 12-storey buildings must satisfy at least two-hour fire resistive performance for its major structural components, such as bearing walls and floors. The test proved that the materials successfully secured the two-hour fire resistive performance, which is the precondition for tall wood mass timber, for the first time in South Korea. As the wood framed structural components developed in this fire certificate test stably secured the fire resistive performance, it is expected to encourage the acquisition of the two-hour fire rated certificates for WFC (Weighted Fractional Count) and promote tall wood mass timber.

Test passed with flying colors
CLT wall test

Green Building Seminar Held in Conjunction with CWK’s Participation in 2017 Busan Kyunghyang Housing Fair
By Sunny Kim
Program Manager / Market Development & Market Access, Canada Wood Korea
November 30, 2017
Posted in: Korea

Presentation by Mr. Hyeon Wook Lee
Canada Wood Korea (CWK) participated in the 2017 Busan Kyunghyang Housing Fair from September 14 to September 17, 2017. In conjunction with the participation in the Housing Fair, CWK held a “Green Building Seminar”, a wood-frame construction technical seminar to promote wood as a sustainable building material.
Two passionate speakers spoke at the seminar: Mr. Wook Lee, the principal of Kwangjang Architects, famous for the “Peanut House” spoke on wood infill walls and Mr. Ki Cheol Bae, the principal of IDS, famous for designing large scale wood institutional buildings using mass timber spoke on “tall buildings”.

Presentation by Mr. Ki Cheol Bae
Tai Jeong, Country Director of CWK, also spoke on tall wood and mass timber products with emphasis on nail laminated timber (NLT), and reviewed technical aspects relating to installation, connections, and fire protection focused on design and construction of the 18 storey Brock Commons in Canada.
Busan Metropolitan City, with 3.5 million population, is the second most-populous and the largest port city in Korea located in the southeastern corner of the peninsula.
Canada Wood Korea Provides Seismic Design Solutions for Architects, Engineers and Builders
By Tai Jeong
Technical Director, Canada Wood Korea
November 30, 2017
Posted in: Korea

Catriona Armstrong, Manager, Market Development, Trade and International Division, Natural Resources Canada providing welcoming remarks.
Korea used to be considered as safe from earthquakes, however, an earthquake with the magnitude of 5.8 in Richter scale, the strongest one since the measurements of seismic activities began in 1978 in Korea, occurred in September 2016 and the Ministry of Land, Infrastructure and Transport (MLIT) has recently strengthened the seismic design requirements and soon the requirements will be extended to 2 storey buildings and houses.

Workshop received keen interest from more than 170 local professionals
In response to growing needs for seismic design solutions, CWK organized the Seismic Design Workshop with local and overseas lecturers: David Joo (PE, President of King Engineering, Canada), Sang-sik Jang (Professor of Chungnam National University, Korea) and Damon Ho (PE, Engineering Supervisor with Simpson Strong-Tie, U.S.).
The three speakers have introduced Mid-rise Wood Construction in Canada focused on seismic design, Simplified Seismic Design Method for using OSB sheathed shearwalls and North American Lateral Force Provisions and Seismic Design Method respectively, providing seismic design solutions for various types of wood frame buildings.
The workshop was attended by more than 170 architects and designers, engineers and builders showing growing interest in seismic design and wood construction. And two special guests, Catriona Armstrong, Manager, Market Development, Trade and International Division, NRCan and Joyce Wagenaar, Director, Market Outreach, FII also came from Canada and provided welcoming remarks.
2017 Fourth-Quarter Forecast

(HUYANGSHU/WIN MCNAMEE/CHUNG SUNG-JUN/ED JONES/YOUNG84/iStock/Getty Images)
Overview
Homing in on North Korea: An emerging nuclear crisis on the Korean Peninsula will rise to the top of the United States’ agenda this quarter, reducing the priority of less pressing issues as Washington works furiously to avoid — and prepare for — the worst. Thoroughly distracted, the United States will have little time and few resources to spend on other foreign policy matters, including its nuclear deal with Iran. Though Washington will try to counter Tehran’s regional power grabs where it can, it will not risk triggering another diplomatic meltdown by abandoning the agreement. The White House will similarly shelve the most aggressive moves in its protectionist trade agenda until next year.
The Debate Over Europe’s Future Begins: Europe, for its part, will turn its attention inward to wrestle with weighty questions about its future. But discussions of reform will be fraught with thorny issues that lay bare the fundamental differences among European Union members. As France lobbies to more closely knit together the Continent’s core, Central and Eastern European countries will be torn between their desire for the security and financial perks that deeper integration could bring and their determination to keep institutions in Brussels at arm’s length. All the while, the bloc’s leader, Germany, will be preoccupied with the task of cobbling together a ruling coalition after September elections produced a divided parliament, forcing parties to enter into complex negotiations in hopes of forming a government.
Pragmatic Cooperation Masks Deeper Competition in the Middle East: As U.S. pressure gradually builds against Iran, the government in Tehran will try to relieve it somewhat by easing tension with its regional rivals, Turkey and Saudi Arabia. At least, that is, on the surface. Though Iran will find common ground with each country in places such as Iraq and Syria, its pragmatic cooperation will remain just that — pragmatism — as its long-standing feuds persist beneath the surface in proxy battles scattered across the Middle East. But Iran is not the only external power involved in these conflicts, and as common enemies like the Islamic State are beaten back, the risk of clashes breaking out between the partners of the United States and Russia will only increase, potentially pulling their larger patrons deeper into the fray.
In a Volatile Region, Japan and China Seek Stability at Home: Though North Korea will pose the greatest security threat to the Asia-Pacific this quarter, leaders in China and Japan will have other problems on their minds. The Chinese Communist Party is gearing up for a crucial congress in October, where President Xi Jinping will take the opportunity to further concentrate power among a circle of trusted allies. In much the same way, Japanese Prime Minister Shinzo Abe will work to shore up his support base during snap elections in October with an eye toward his party’s leadership contest next year.
India Finds the Enemies of Its Enemy: The tense standoff between India and China on the Doklam Plateau has ended, but it exposed the neighbors’ age-old dispute over much of the mountainous border separating them. As India races to expand its infrastructure in the region in case tensions flare again, it will also reach out to Japan and the United States to deepen its defense relationships in hopes of countering the rising power looming on its doorstep.
Global Trends
In today’s world, nations are becoming increasingly interconnected by air, land, sea and cyberspace. As globalization has knitted countries and continents closer together, the borders of the map and the barriers of geography have been rendered, in some ways, obsolete. Now events in one region can more easily have consequences in another, at times even rippling across the globe. We explore those with the greatest impact on international decision-making during the forecast period below.Read Synopsis

(NASA/Newsmakers)
Table of Contents
- Global Trends
- Asia-Pacific
- Europe
- Middle East and North Africa
- Americas
- South Asia
- Eurasia
- Sub-Saharan Africa
Section Highlights
- North Korea’s nuclear ambitions will occupy most of the United States’ attention as Washington searches for ways to halt the progress of Pyongyang’s weapons program, even as China and Russia continue to subtly prop up their belligerent neighbor.
- Distracted by North Korea, the United States will not be willing to create another headache for itself by withdrawing from its nuclear deal with Iran. Russia, meanwhile, will deepen its involvement in several conflicts around the world to strengthen its own bargaining position in talks with the United States.
- The White House will keep putting its trade policies into practice in the fourth quarter, but despite its tough talk in the opening phase of NAFTA negotiations, the United States will have a hard time persuading Mexico and Canada to meet its steep demands.
- Across the Atlantic, Europe will turn to the difficult task of reforming institutions within the European Union and eurozone now that national elections in France and Germany have wrapped up.
- Though the world’s oil inventories have declined, they haven’t fallen quickly enough to suit the organizers of a pact among oil producers to slash output, signaling the group’s likely intent to extend the quota beyond March 2018.
The Start of a Dangerous Race
The United States will head into the last quarter of the year facing one of the greatest direct nuclear threats to the American mainland since the Cuban missile crisis. Over the past three months, North Korea has stepped up its nuclear and ballistic missile tests, leading U.S. intelligence officials to conclude that Pyongyang will obtain a reliable intercontinental ballistic missile (ICBM) capable of carrying a nuclear warhead before next year is out.
Washington will race against the clock to find ways to stall North Korea’s progress and bring it back to the negotiating table. The United States will likely try to court the support of Russia and China in this endeavor as it doubles down on employing diplomatic and financial pressure to dissuade further weapons tests by Pyongyang. But getting their help will not be easy. Even if the United States casts a wider sanctions net to include Russian and Chinese firms that trade with or provide financial services to North Korea, it will not weaken either country’s determination to protect the stability of the government in Pyongyang while advocating a policy of engagement rather than isolation.
But therein lies the problem.
Dialogue between North Korea and the United States presents somewhat of a Gordian knot. Pyongyang will agree to talk with Washington only as an equal, and it will not curb its weapons development to do so. Pyongyang is also willing to accept the risk of further sanctions, confident that its troop presence on the Korean Peninsula and its burgeoning nuclear capabilities would preclude any military action against it. Washington, on the other hand, has demanded that Pyongyang freeze its nuclear weapons tests before talks can begin. Washington also views coercion as the most effective method of blocking Pyongyang’s continued weapons development. Because the two adversaries’ positions are incompatible, their dispute will doubtless escalate in the coming quarter.

A picture taken on Sept. 23 shows an anti-U.S. rally in Pyongyang’s Kim Il Sung Square.
(STR/AFP/Getty Images)
As North Korea continues to conduct weapons tests, the risk of U.S. military action against it will rise. Though the United States could launch a limited strike against North Korea with the assets it currently has near the peninsula, Washington is far more likely to gradually build up its military presence in the region throughout the quarter, giving diplomatic overtures and sanctions a chance to take effect. And though an accident or close call during a North Korean missile launch may force the United States or its allies to shoot down the device, they will not make the decision to initiate a more serious military intervention before the end of the year.
The Side Effects of U.S. Tunnel Vision
More Information

Syrian loyalists stand on the side of a road on the outskirts of Deir el-Zour on Sept. 24.
(STRINGER/AFP/Getty Images)
A continent away, Russia is gaining ground in yet another regional conflict: the Syrian civil war. Loyalist forces, backed by Russia and Iran, broke the Islamic State’s grueling siege against Deir el-Zour in September. Now those troops will be free to push toward the Iraqi border even faster. As they do, the United States will have to maintain contact with Russia to prevent the outbreak of clashes between their battlefield proxies.
Closer to home, Washington will have to come to grips with Moscow’s presence in a third unstable environment. Venezuela is inching closer and closer to a financial default, and Russia (along with China) is one of the last allies the foundering country has left. Caracas has even asked Moscow to restructure Venezuelan debt as U.S. sanctions weigh heavily on its finances.
As Western Protectionism Surges, the World Adjusts
The return of protectionism will continue to manifest in trade, investment and technology relationships across the globe through the end of the year. As has been true for most of 2017, the United States will lead the charge, particularly with the renegotiation of NAFTA underway. In fact, Washington has already put forth plans outlining the ways in which bilateral trade deals should be implemented instead. It has also called for the introduction of a U.S. content requirement in certain sectors, stipulating that foreign goods must contain a given share of parts produced in the United States in order to qualify for reduced tariffs. Washington has even gone so far as to suggest an automatic sunset clause that would terminate NAFTA under certain circumstances.
Both proposals have drawn criticism from Canada and Mexico, but they also have signaled Trump’s determination to significantly revise the North American pact. Despite adopting an aggressive opening stance in the talks, however, the United States will not abandon NAFTA. Instead, the three partners will eventually reach an agreement, albeit beyond the fourth quarter’s end.
Over the past few months, the United States has shifted more attention toward its trade complaints with China and South Korea. As a result, disputes between Washington and both Asian nations will become more heated in the months ahead. U.S. investigations into China’s technology transfer requirements and other practices related to intellectual property could lay the groundwork for sweeping action against China, including broad tariffs. However, such moves likely won’t come until next year.
The United States may not wait that long to clarify its intention to pursue a case against China through the World Trade Organization (WTO). If U.S. investigators discover that Chinese tactics are inconsistent with the bloc’s rules, Washington will be compelled by both its WTO obligations and U.S. law to bring the disagreement to the organization before unilaterally imposing other punitive trade measures. On the other hand, if China’s activities are found to hurt American companies in ways that are not addressed by WTO regulation, the United States will be able to more swiftly respond as it sees fit.
The United States is not the only party concerned about Beijing’s strategy for acquiring Western technology, either. In September, the European Commission called for the Continent to establish more mechanisms for scrutinizing investment into strategic sectors from companies backed by states outside the European Union — a move clearly aimed at Chinese money. Italy, France and Germany have each supported this sentiment as well, fearing that the Chinese government may be using the resources of the state to encourage takeovers of European companies to “buy” the core technologies and know-how that underpin the world’s modern economies. As usual, France will lead the protectionist charge within the European Union in the months ahead. But Paris’ proposals will create controversy among market-oriented countries, such as Denmark, and Eastern European states, which will view with suspicion any undertaking that could rob them of Chinese investment opportunities or increase Brussels’ control over their economies.
These differences of opinion, along with many others, will be on full display this quarter as Europe tackles the task of reforming the union. Now that critical elections in France and Germany have concluded, the bloc will weigh proposals to create a European Monetary Fund, boost public investment across the Continent and introduce risk-sharing measures in the eurozone. Though Berlin is willing to find common ground with Paris, Germany will spend the remainder of the year building a governing coalition at home. Even so, the debate over Europe’s future that will become a defining feature of 2018 will kick off within the next three months.
Amid the resurgence of economic nationalism in the United States and parts of Europe, the rest of the world will scramble to adjust its expectations and strategies. The 11 members left standing in the Trans-Pacific Partnership will continue to hash out a pact without the United States, but there is no guarantee that they will find compromise. The group’s large, developed members — Japan, Australia and Canada — are certainly eager to sign a deal, but their less-developed counterparts may demand enough concessions to precipitate the negotiations’ collapse. The incipient bloc’s best chance for success, then, lies in its speed, suggesting that talks could progress quickly before the year’s end.
With the WTO’s biennial ministerial meeting set to take place in December, countries will likely spend the months leading up to it lobbying for their pet projects. The bloc will also hold an unprecedented “mini-ministerial” meeting in October to try to firm up an agenda for the full summit in Buenos Aires. But this year’s convention may not be as fruitful as some states had hoped. In light of dissent from the United States, India and South Africa earlier this year, China and Germany’s hopes of reaching a comprehensive agreement on the facilitation of investment have been dashed, as has any chance of a deal to restrict agricultural subsidies. Even so, some progress on issues such as e-commerce, public stock holdings and fisheries subsidies cannot be ruled out.
A Crude Awakening
Meanwhile, the world’s oil stockpiles are declining, but not quickly enough for global producers’ liking. In the United States, one of the most closely watched markets in the industry, crude oil inventories totaled 471 million barrels (about 24 percent higher than the five-year average) as of Sept. 22. Such gluts will spur the strongest advocates of production cuts — Saudi Arabia, Russia and Venezuela — to redouble their efforts to extend the quotas among OPEC members and non-OPEC states beyond March 2018. At the same time, they will ratchet up pressure on exempted OPEC members Libya and Nigeria, which have increased their collective output by 622,000 barrels per day since the fourth quarter of 2016, to join the pact. However, these states are unlikely to sign on. And if the cuts are extended, it won’t be long before compliance among existing signatories starts to weaken.

The United States, for its part, continues to see its output climb. But by the end of June, U.S. crude production reached a little under 9.1 million bpd — just 27,000 bpd higher than its February total. This suggests that the recent growth in U.S. output is not as resilient as industry experts initially expected. And though the country’s production will keep rising slowly throughout the quarter, it will not be cause for debate and contention among the global producers trying to counter the persistent oversupply in the oil market.

Asia-Pacific
The Asia-Pacific is home to more people than any other region. Centered on the western rim of the Pacific Ocean, this region includes the easternmost countries of continental Asia as well as the archipelagos that punctuate the coast. Several of these countries, most notably China, experienced rapid economic growth in the second half of the 20th century, giving the region a new sense of global economic relevance that continues today. That relevance, however, depends largely on China, a power in transition whose rise is testing the network of U.S. alliances that have long dominated the region. How effectively Beijing manages its transition will shape the regional balance of power in the decades to come.Read Synopsis

(Thoyod Pisanu/Shutterstock.com)
Table of Contents
- Global Trends
- Asia-Pacific
- Europe
- Middle East and North Africa
- Americas
- South Asia
- Eurasia
- Sub-Saharan Africa
Section Highlights
- Heedless of the sanctions mounting against it, North Korea will continue to steadily conduct weapons tests while the United States pursues every economic and diplomatic tool available to stop it.
- Next door, China will work to pre-empt the crisis in Pyongyang while fortifying its own administration in Beijing, completing a leadership transition within the Communist Party that will likely result in a strong show of support for President Xi Jinping.
- Though China will focus on preserving its economic and social stability once the crucial party congress is over, the conclusion of its leadership transition will give Beijing greater flexibility in its foreign policy, making room for it to grow more assertive in South Asia and the South China Sea.
 See more on this RegionWar Looms Over the Korean Peninsula
North Korea will remain at the center of the region’s — and the world’s — attention as the year comes to a close. Over the third quarter, Pyongyang made steady strides in its intercontinental ballistic missile (ICBM) and nuclear weapons programs, even going so far as to conduct launches over Japanese territory. And as Pyongyang inched closer to fielding a nuclear device capable of striking the U.S. mainland, China’s temporary detente with the United States on North Korea crumbled. Hoping to sever Pyongyang’s economic lifelines for good, Washington stepped up pressure on Beijing and, at times, Moscow by slapping their citizens and companies with new sanctions, both unilaterally and with the support of the United Nations.
North Korea’s weapons tests will proceed apace in the coming quarter as the country closes in on a credible nuclear deterrent. The United States will exhaust every economic and diplomatic tool at its disposal to arrest Pyongyang’s progress and to persuade China to step in on its behalf. Though Washington will also hedge its bets by continuing to build up strategic and tactical assets on the Korean Peninsula and in the Asia-Pacific, it will opt for an incremental expansion of its military footprint in the region to give its other sticks and carrots time to take effect. At the same time, the United States will strike deals with Japan and South Korea aimed at bolstering their defenses — especially their missile defense systems — over the long run.
 Determined to counter the U.S. military buildup on its doorstep, China will work to amass its own forces along the North Korean border. Pyongyang will also keep shoring up its defenses as it continues to test devices in accordance with its technical needs and in response to U.S. actions. Such tests may include firing ICBMs (perhaps even several at a time) to prove North Korea’s ability to overwhelm nearby missile defense systems.
During the fourth quarter, the likelihood that these tests will trigger a conflict on the Korean Peninsula is greater than the possibility of a preventive military strike by the United States. Should a North Korean missile come perilously close to or break up over Japanese or South Korean territory, the United States and its allies would have to decide whether to try to shoot it down. The attempt would be costly, no matter the outcome: Success would risk retaliation from North Korea, while failure would undermine the credibility of the region’s missile defenses. Pyongyang, moreover, may feel the need to counter the movements of U.S. air and naval assets in the region. Its responses could inadvertently lead to a rapid military escalation, as could a decision by Pyongyang to test a missile near the U.S. mainland. Another North Korean nuclear test cannot be ruled out either, and if that was an atmospheric test, Washington may feel the need to halt it by downing the missile carrying the test warhead.
It is possible (albeit unlikely) that the United States will use the forces it already has stationed in the region to launch a punitive or preventive strike against North Korea’s nuclear and missile programs. Washington might resort to such drastic measures in response to an unforeseen crisis or to unexpected progress in Pyongyang’s weapons development. However, the United States would be far more likely to preface an attack by deploying more military assets to the Asia-Pacific to better respond to any retaliation by North Korea.
Of course, the United States has many avenues it can pursue before turning to a military solution. To that end, Washington will continue to isolate Pyongyang economically and diplomatically, leaning on North Korea’s dwindling trade partners to fall in line with the initiative. China may consider squeezing some flows of aid to North Korea in the interest of averting a U.S. intervention — a prospect it fears even more than the collapse of the government in Pyongyang. Russia, however, will work to undercut any endeavor that threatens to undermine the North Korean administration.
As China comes under mounting pressure from the United States to cut economic ties to North Korea, Russia will move to soften the resulting blow to Pyongyang’s finances. In hopes of discouraging such behavior, Washington may pursue secondary sanctions against China and Russia in the months ahead. But as both countries distance their most important firms from North Korea, these measures will likely affect companies and individuals with relatively minor roles in the Chinese and Russian economies.
Meanwhile, Beijing and Moscow will continue to emphasize the importance of easing tension and diplomatically engaging with Pyongyang. The two will try to dissuade Washington from taking military action against North Korea, advocating dialogue between the North and South instead. The installation of the Terminal High-Altitude Area Defense (THAAD) system in South Korea, however, will feed tension between Seoul, on one hand, and Moscow and Beijing on the other. Eager to fortify its alliance with the United States, South Korea will remain broadly aligned with the White House’s stance, temporarily shelving its own attempts to pursue a dialogue with North Korea for a more opportune time while reinforcing its indigenous defenses.
China’s President Tightens His Grip
China, for its part, will have bigger concerns to grapple with at home this quarter. The Chinese Communist Party’s careful preparations for a change in leadership will be realized in mid-October at its quinquennial congress. The event will bring reshuffles at the highest ranks of the party and serve as an important test of President Xi Jinping’s attempts to consolidate power.
So far, all signs point to the president’s success in tightening his grip over the country’s top decision-making bodies. Xi has already secured the honored status of “core leader,” not just of the Communist Party but also of the Chinese state and military. He has also managed to rapidly promote many of his associates to prestigious positions in recent months. Looking ahead, as many as 11 Politburo and five Politburo Standing Committee members are nearing retirement — vacancies that would give Xi the opportunity to fill the majority of seats in both bodies with political allies. Perhaps even more important, party members are likely to endorse the inclusion of Xi’s guiding philosophy in the Communist Party Constitution at the approaching congress, allowing him to join the venerated ranks of Deng Xiaoping and Mao Zedong.
But the summit will also signal the lengths to which Xi must go to secure the political compromises he seeks. It remains to be seen whether the president will be able to break the ruling party’s customary age limit to keep longtime ally and anti-corruption czar Wang Qishan on the Politburo Standing Committee. It is similarly unclear whether Xi intends to try to extend his presidency beyond the two-term ceiling specified in the Chinese Constitution.
Even so, Xi will likely emerge from the party congress with the political capital needed to see many of his grand visions through. But in the wake of widespread turnover among the Party’s upper ranks, the president will focus his immediate attention on stabilizing the country. Xi will look to contain any socio-economic issues at home or diplomatic disputes abroad that could threaten the image of the Party or the president’s status within it. This effort will include steadying China’s precarious financial system and highly leveraged companies while mitigating the risk of external volatility. To that end, China has attempted to blunt the effect of U.S. trade measures, insisted on negotiation with North Korea while discouraging U.S. military action and struck a temporary deal with India to end their tense border standoff.
China’s sensitive political environment will not cause its leaders to completely ignore economic reform, though. The party’s newly instated officials, after all, will need to boost the public’s confidence in the government as the economy remains stable but weak. Over the past few months, Beijing has combined broad-based structural reforms such as the consolidation of industries, production cuts and the enforcement of environmental regulations with renewed efforts to chip away at the mountain of debt crippling the country’s state-owned enterprises, financial sector and local governments. These reforms will only accelerate in the coming quarter.
 Beijing, however, will have to hedge against the significant risks associated with the reforms. They include threats to corporate solvency and a slowdown in the all-important real estate market on which China’s heavy industries and construction sector depend. Underpinning these problems are the long-term risks that the country’s considerable debt presents to the Chinese economy, which will only become more fragile over time if it is not paid off. And though Beijing has the resources and fiscal tools with which to contain the danger of widespread default, relying on them will only exacerbate the government’s debt problems in 2018 and beyond.
The global resurgence of protectionism, moreover, will run counter to China’s desire to avoid upheaval outside its borders. Over the past few months, the United States has opened several investigations into China’s technology transfer requirements as well as other matters related to the protection of intellectual property. In the months ahead, discord between the two countries will only worsen in the trade realm. Even if the United States chooses not to take action against Chinese practices, Washington will probably expand its investigations into critical Chinese industries, such as semiconductors. As it does, it will doubtless use the same justification — safeguarding U.S. national security — that it has used to target China’s steel and aluminum sectors before. China, which is eager to dissuade the United States from targeting its economy, will ramp up its efforts to increase the protection of intellectual property at home while leveraging market access and investment in its negotiations with Washington. But the United States is not alone in its scrutiny of China: A recent decision by the European Union to deepen investigations into Chinese takeovers of high-tech companies on the Continent underscores the growing backlash against the country’s overseas investment into crucial industries.
Despite the economic nationalism sweeping across the developed world, Beijing will continue its effort to upgrade its domestic manufacturing base and to invest in infrastructure in countries participating in the Belt and Road Initiative. It will, however, maintain close control over the outflow of capital into foreign industries it deems risky, including property, entertainment and sports. Countries whose property markets have been buoyed by China’s previous spending sprees will feel Beijing’s tightening grip most acutely.
Asia’s Biggest Powers Square Off
China will try to ease mounting U.S. pressure on trade issues and North Korean threats where it can. But Beijing will be particularly wary of any attempts by Washington to raise the touchy subject of Taiwan’s status before or during the Communist Party Congress. Once the summit is over, however, China will have more flexibility in its foreign policy.
As the United States disengages from Southeast Asia, China will continue its amicable outreach to the members of the Association of Southeast Asian Nations (ASEAN), offering to negotiate a code of conduct in the South China Sea and to formalize discussions with the Philippines on joint energy development in the disputed waters.But Beijing will also keep its coercive options open in dealing with states that prove uncooperative, increasing the likelihood of new spats emerging between China and Vietnam.
The Philippines, for its part, will try to strike a balance between its relationships with China and the United States. Manila hopes to secure its maritime boundaries by maintaining its detente with Beijing, but it also relies on the assistance of the U.S. military to combat militants linked to the Islamic State in the restive region of Mindanao. Once the few insurgent pockets left in Marawi City fall, the Philippine military will have the opportunity to clear the region of any remaining fighters. But Manila will also face the challenge of reconciling with the mainstream militant Moro Islamic Liberation Front, which has assisted military operations in Marawi City and will expect political concessions in exchange for its help.
Meanwhile, China’s foray into South Asia through the Belt and Road Initiative will continue to inspire similar projects among Beijing’s regional rivals, including India. New Delhi already has entered the proposal stages of the India-Japan Freedom Corridor and of the joint construction of ports by India, Japan and the United States. None of these undertakings, however, will notably progress during the fourth quarter.
As China builds up its infrastructure and troop presence along its contested border with India, New Delhi will follow suit, blazing its own roads while seeking out new defense relationships with Asian partners such as Vietnam, Mongolia and Australia. Chief among them, however, will be Japan. The common ground that New Delhi and Tokyo find in maritime security and in their mutual aspirations in Africa and Southeast Asia could drive Beijing to expand its own outreach in India’s backyard. If it does, states like Nepal, Bhutan and Sri Lanka will have to find a way to juggle their relationships with India and China. In much the same way, China will work to solidify its security and economic ties with Pakistan amid the United States’ calls for India to play a larger role next door in the stabilization of Afghanistan.
The Tale of Two Trade Deals
Scrambling to account for the recent swell of global protectionism, countries in the Asia-Pacific will feverishly negotiate deals to increase their connectivity with international markets. The 11 members left in the Trans-Pacific Partnership will try to pick up the pieces of the crumbling pact as tension rises between its more- and less-developed signatories. Pressure to reach an agreement will only grow as the rival Asia-Pacific Economic Cooperation bloc prepares to meet in November. Nevertheless, states will have a tough time finding a compromise on thorny issues such as data exclusivity, investment regulations and copyright protections.
The outlook of another major Asian trade pact under negotiation — the Regional Comprehensive Economic Partnership — is even less promising. Its members are largely split into three camps. Developing nations, many of which belong to ASEAN, are interested in discussing little beyond tariffs on goods. By contrast, developed countries such as Japan and Australia aim to hash out a more comprehensive pact. Caught in the middle, India is reluctant to discuss measures to ease the trade of goods but is keen to liberalize the trade of services. These stark differences are guaranteed to lead to dysfunction in talks regarding the deal.
 All the while, the United States will continue to hassle Asian exporters — particularly South Korea and China — to change their trade policies. Though Washington will not take any concrete steps to revamp the United States-Korea Free Trade Agreement in the coming quarter, Seoul suspects that it will eventually, regardless of how much South Korea cooperates with U.S. attempts to rein in North Korea. Seoul will likely try to preempt any punitive measures against the South Korean electronics and automotive industries by agreeing to some concessions in its trade arrangement with Washington.
Japan’s Ruling Party Makes a Bid to Preserve Power
Like China, Japan will concentrate on the political changes underway within its borders this quarter. Over the past few months, few challenges have arisen at the national level to the rule of the Liberal Democratic Party (LDP) as its opponents have remained in disarray. But Prime Minister Shinzo Abe’s approval ratings have dipped repeatedly amid a series of scandals and his use of the LDP’s majority to ram unpopular bills through the legislature. The public made its growing dissatisfaction clear in Tokyo elections on July 1, dealing the LDP a humiliating blow with the victory of a right-wing contender backed by the capital city’s governor, Yuriko Koike.
On the heels of a Cabinet reshuffle and a rebound at the polls, Abe recently decided to take advantage of lingering disunity among his opponents by calling for snap elections in late October. The vote will bring Koike’s new political party to the national stage for the first time. It will also test the popularity of Abe’s ambitious proposal to revise the Japanese Constitution to pave the way for the normalization of the country’s military and for a massive economic reform package. North Korea’s persistent weapons tests, particularly those that involve launching missiles over Japanese territory, will certainly drum up support for the prime minister and his party.
If the LDP sweeps the elections on the promise of constitutional revision, the win would give Abe a broad mandate to pursue his reform agenda. On the other hand, a loss of seats would jeopardize the ruling party’s plans, particularly if coalition ally Komeito or the opposition party led by Koike — both of which are ambivalent to the prime minister’s proposals — carve out a bigger share of seats. And though the opposition has long been disunited, there is a risk that it will start to coalesce into a more coherent force. More important for Abe, however, the snap elections will serve as a bellwether of the prime minister’s political future as his party nears a leadership transition scheduled for late next year.
Abe Win May Boost Chances of Second Term for Kuroda, Takenaka Says
By
Toru Fujioka
and
Masahiro Hidaka
October 16, 2017, 2:00 PM MDT
- Takenaka says Kuroda should remain Bank of Japan governor
- The ex-economy minister says Kuroda has done ‘excellent’ job
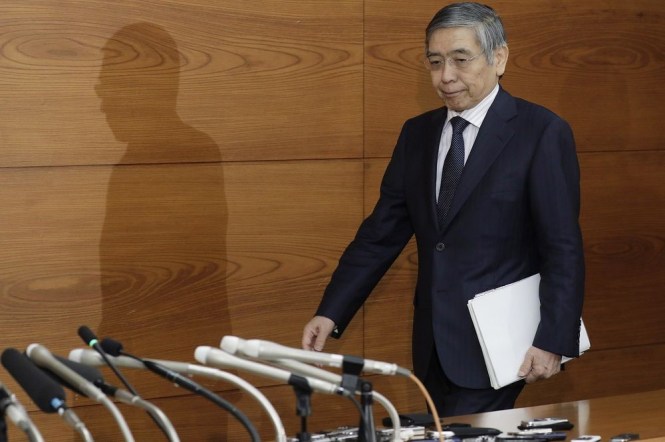 Haruhiko KurodaPhotographer: Kiyoshi Ota/Bloomberg
If Shinzo Abe wins the election next week, it will boost the chances that Bank of Japan Governor Haruhiko Kuroda will serve a second term, according to a former Japanese economy minister.
“Kuroda has done a excellent job. He should continue,” Heizo Takenaka said in an interview on Monday. After Kuroda pushed through massive stimulus, prices have stopped falling and the economy is in better shape, Takenaka said.
 Heizo Takenaka
Photographer: Akio Kon/Bloomberg
Abe has expressed his trust and confidence in Kuroda numerous times, and reappointing him was seen as the most likely scenario in a recent survey of economists. Even though inflation is nowhere near the BOJ’s 2 percent target, the Nikkei 225 Stock Average closed at a 21-year high on Monday and the economy is on track for the longest expansion since 2001.
Recent polls show Abe’s ruling Liberal Democratic Party could win a majority in the lower house by itself in the Oct. 22 election. An Abe victory “will of course push the tide” toward a second term for Kuroda, said Takenaka, a professor at Toyo University in Tokyo. “I think there is a sufficient amount of trust between the government and the BOJ for that to happen.”
Takenaka and Abe served together in the cabinet of former Prime Minister Junichiro Koizumi in the early 2000s. He also served with current Tokyo Governor Yuriko Koike, who was environment minister at the time and is now an opposition leader. He is a member of an advisory panel for special economic zones chaired by Abe.
More: Kuroda Is on Top in Guessing Game for Who Will Run the BOJ
Unlike the 2012 election that returned Abe to power, the BOJ isn’t the center of debate this time, with none of the parties proposing alternative policies for the central bank. Still, if Kuroda were reappointed, the decision could draw criticism. Abe advisers Nobuyuki Nakahara and Etsuro Honda have both suggested Kuroda should step down because the central bank needs a new face.
Takenaka said that even though there is no need for further easing at this point, an exit won’t happen soon, so the BOJ needs to continue stimulus with “considerable patience.” Kuroda, speaking in Washington over the weekend, pledged to continue monetary easing as inflation remains a long way from his target. Japan’s core inflation rose 0.7 percent in August.
Takenaka became widely known after he led the write-off of bad loans at Japan’s debt-ridden banks, when he served as financial services minister under Koizumi. He also held the economic and fiscal policy portfolio and oversaw plans to privatize the post office.
Appointing Kuroda for another term will raise expectations for appropriate policies, Takenaka said. “A shift in personnel can change expectations at once.”
B.C.’s largest forestry trade mission to China
Japanese 2×4 Building Code to Specify High Performance Shear Walls

- Deputy Director and Manager Technical Services, Canada Wood Japan
November 6, 2017
Posted in: Japan

- When designers take the prescriptive design approach for wooden buildings, shear wall multipliers are the indicator that are popularly used to determine the seismic load resistance. In the PFC building code, a shear wall multiplier 3.5 has been the highest value given to a shear wall with 9-mm thick Class 1 JAS plywood sheathing fastened with the CN50 nails at 100 mm spacing. In the past 3 years, MLIT has been reviewing the shear wall ministerial approvals with the multiplier higher than 3.5 and has been seeking the possibility to include those specifications in the code. The reviewed approvals include those obtained by the APA the Engineered Wood Association. As a result, it has been decided to specify in the PFC code the shear walls with the multiplier as high as 4.8. The code revision draft defines 4.8 for the walls with 12mm-thick Class 3 OSB and Class 1/Class 2 plywood sheathing fastened with CN65 nails at 50mm spacing. Using these high shear wall factors would enable the architects to design PFC houses with remarkably higher seismic resistance than currently achievable in the code. It is important to note that shear wall factors approved in the past remain effective even after the new code becomes enacted. The revised code is scheduled to be released in December 2017.
The Seven Men Who Will Rule China for the Next Five Years
Bloomberg News
October 24, 2017, 10:12 PM MDT October 25, 2017, 3:39 AM MDT
- New Politburo Standing Committee surrounds Xi with loyalists
- Communist panel manages affairs for one-fifth of humanity
China’s Xi Unveils New Leaders But No Clear Successor
Trump, Corker Get Into Feud That Could Hurt Tax Reform
Why Capital Economics Is Bearish on China After Congress
China’s Top Political Body Shows No Clear Successor
President Xi Jinping walked onto the red carpet of China’s Great Hall of the People on Wednesday having amassed more power than any leader in a generation.
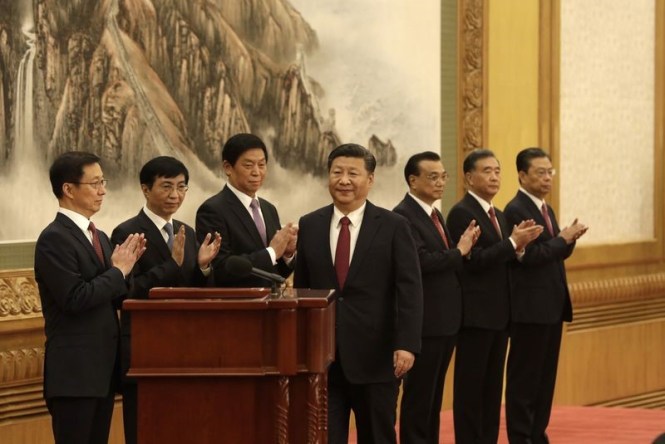 Photographer: Qilai Shen/Bloomberg
Behind him followed — in order of rank — the other six members of the Politburo Standing Committee, the panel that meets weekly to manage the affairs of almost one-fifth of the world’s population. The new line-up chosen after the Communist Party’s twice-a-decade congress surrounds Xi with loyalists to advance his ambitious plans to cement one-party rule and complete China’s reemergence as a great power.
Here’s a look at the officials who will run China for the next five years, in the order they appeared:
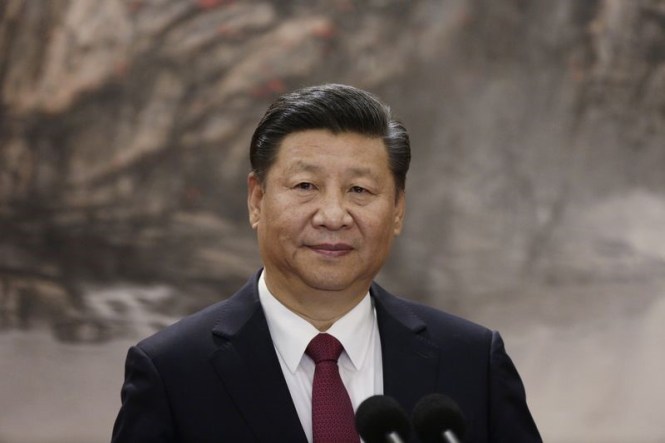
Xi Jinping, 64
 Photographer: Qilai Shen/Bloomberg
For Xi, the party congress was a crowning moment. The enshrinement of his name in the party’s charter capped a decades-long journey from being forced to live in the countryside under Mao Zedong to becoming a leader on par with him. In his first five years in power, Xi has demonstrated vast ambitions to restore China’s place among the great powers, laying out a three-decade plan to finish the job. His changes to the party’s governing documents — and the lack of a clear heir — position him to rule China for years to come.
Li Keqiang, 62
 Photographer: Qilai Shen/Bloomberg
Once seen as a contender for the presidency, Li Keqiang watched Xi win the top job and instead became premier. The job appeared a natural fit for Li, who holds a Ph.D in economics and served as top lieutenant to former Premier Wen Jiabao. He once likened unleashing market forces to “cutting one’s wrist.” His image took a hit during the 2015 stock market rout and Xi has quickly assumed economic roles held by past premiers. Still, if there’s any gap between Xi and Li, outsiders haven’t been allowed to see it.
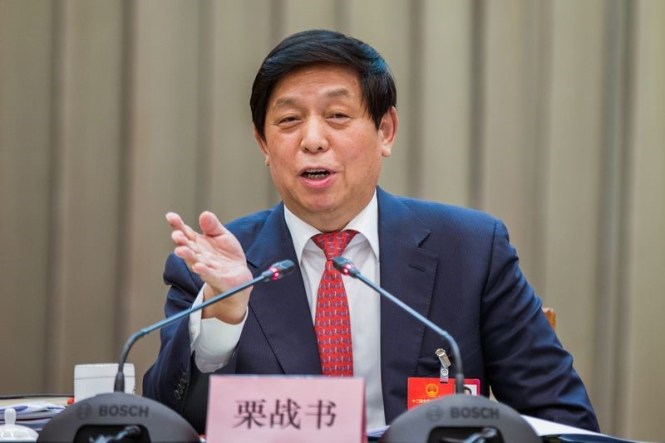
Li Zhanshu, 67
 Source: Imaginechina
Not only is Li Zhanshu among an exclusive group of top officials who accompany Xi on diplomatic visits, he’s also become the leader’s personal liaison to Russian President Vladimir Putin. Before becoming Xi’s chief of staff in 2012, Li toiled for decades in rural obscurity. He wrote poetry and held jobs in places like China’s ancient heartland of Shaanxi and the rust belt province of Heilongjiang. His ties with Xi stretch back to the 1980s, when they served in adjacent counties in the central province of Hebei.
Wang Yang, 62
 Photographer: Andrew Harrer/Bloomberg
Wang Yang missed the cut for the Standing Committee in 2012, the year his effort to bring the pro-democracy protests in the fishing village of Wukan to a peaceful resolution helped earn him a spot on Time Magazine’s most-influential list. He had risen to prominence in an unusually public debate about China’s economy. Wang backed a relatively liberal package of policies called the “Guangdong model” that allowed a greater role for non-profits and trade unions. That approach contrasted with Bo Xilai’s “Chongqing model,” which emphasized social cohesion and the role of the state.
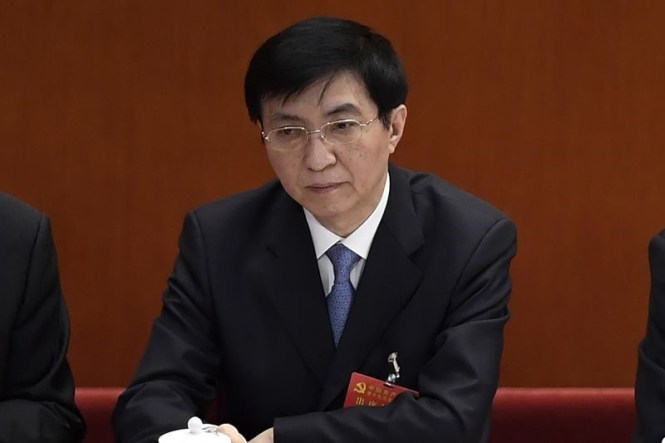
Wang Huning, 62
 Photographer: Andrew Harrer/Bloomberg
Wang Yang missed the cut for the Standing Committee in 2012, the year his effort to bring the pro-democracy protests in the fishing village of Wukan to a peaceful resolution helped earn him a spot on Time Magazine’s most-influential list. He had risen to prominence in an unusually public debate about China’s economy. Wang backed a relatively liberal package of policies called the “Guangdong model” that allowed a greater role for non-profits and trade unions. That approach contrasted with Bo Xilai’s “Chongqing model,” which emphasized social cohesion and the role of the state.
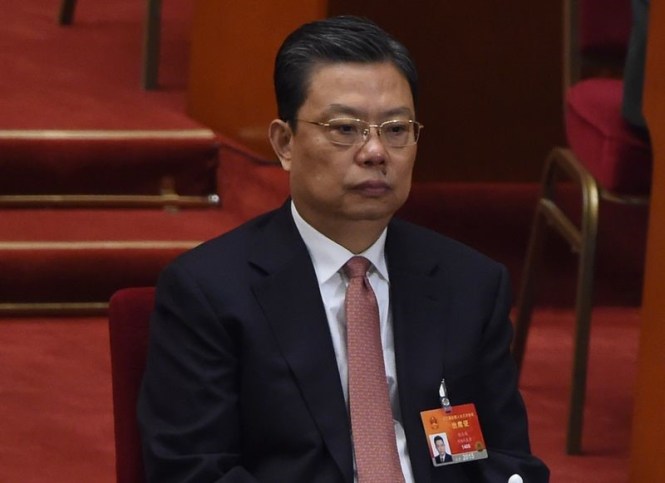
Zhao Leji, 60
 Photographer: Wang Zhao/AFP via Getty Images
Zhao Leji has played an instrumental role in Xi’s efforts to position allies ahead of the current reshuffle. For the past five years, he has led the powerful Organization Department, which holds sway over appointments to senior jobs across the country, from provinces to central party agencies. Before that, he spent almost three decades climbing the ranks in Qinghai, a northwestern province bigger than Texas at the crossroads of some of the country’s largest ethnic groups. He eventually became the country’s youngest provincial leader, overseeing the doubling of Qinghai’s economy. - Han Zheng, 63
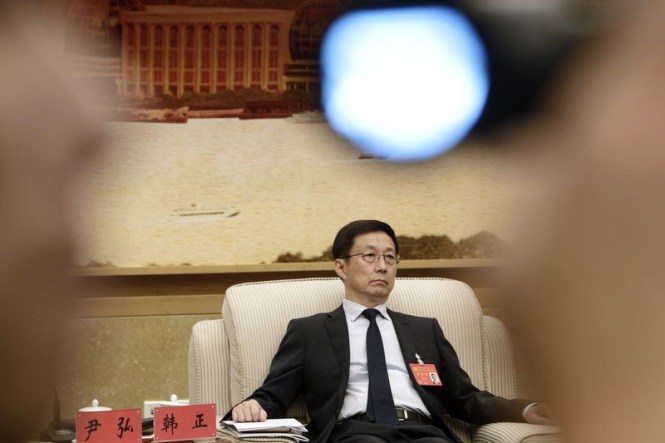 Photographer: Qilai Shen/BloombergHan Zheng’s ascension from Shanghai to the Standing Committee is all the more remarkable after the shocking 2006 downfall of his then-boss Chen Liangyu amid bribery charges. During more than three decades in Shanghai, Han has overseen the once-gray former colony’s transformation into a shimmering monument to modernity. As mayor, he led a $44 billion infrastructure makeover for the 2010 Shanghai Expo. He has faced challenges since taking over as Shanghai party chief in 2012, from runawayproperty prices to a New Year’s stampede that killed 36.
— With assistance by Keith Zhai, Peter Martin, and Ting Shi
XI’S CHINA
China’s Xi gains Mao status, adding to power with name in constitution

A general view shows delegates attending the closing of the 19th Communist Party Congress at the Great Hall of the People in Beijing on October 24, 2017
NICOLAS ASFOURI/AFP/GETTY IMAGES
OCTOBER 24, 2017
Xi Jinping sat before the thousands of delegates gathered for his latest coronation in Beijing, and asked for a show of hands. Did anyone oppose adding his name to the party’s constitution?
The shouts rang out across the enormous Great Hall of the People:
“Meiyou” – “none.”
With that, “Xi Jinping Thought on Socialism with Chinese Characteristics for a New Era” formally entered ruling party doctrine, a stroke vaulting Mr. Xi into the ranks of Communist royalty, alongside Mao Zedong and Deng Xiaoping.
China Communist Party enshrines ‘Xi Jinping Thought’ in constitution(REUTERS)
China’s Xi sells his vision of new socialism to the world
Far from a theoretical nicety, the change both reflects and strengthens the firm grasp Mr. Xi has attained over the direction of the world’s second-largest economy.
“Xi’s ability to dominate the policy-making process has just increased by a factor of 10,” said Jude Blanchette, an expert in the Communist Party at the Conference Board’s China Center for Economics and Business in Beijing.
Mr. Xi has sought to unify the Chinese people, military and economy toward a vision of national rejuvenation – one that promises new greatness by rejecting Western principles in favour of an authoritarian, neo-Marxist ideology under Communist rule.
“The Chinese people and the nation will, of course, embrace a bright future. And in this great era, we are full of confidence and pride,” Mr. Xi said moments after the unanimous show of his support for his leadership. Delegates to the Communist Party’s 19th National Congress also added Mr. Xi’s “Belt and Road Initiative” to the constitution, enshrining his vision of extending China’s political and development models far beyond its borders. The plan would place Beijing at the centre of new networks of trade and investment that extend as far as Europe. The concept of “supply-side reform,” a description of Mr. Xi’s vision for fixing domestic economic problems, is also included.
“The inclusion of Xi Jinping thought in the constitution along with the requirement to pay obeisance to him as the party core is no small feat,” said Bonnie Glaser, director of the China Power Project at the Center for Strategic and International Studies “The new era is where Xi will take China in the years to come – history that has yet to be written.”
But Mr. Xi has offered a clear preview, both in his first five years of rule and in his remarks, in which he called on the party to be “brave and passionate … to create achievements and make great strides to a promising future.”
The Chinese president has pledged to eradicate poverty, restore environmental health and wage war on corruption at home, while elevating China’s global influence abroad.
Mr. Xi called it “the historical mission of the Communist Party of China in a new era.” As he spoke, former presidents Jiang Zemin and Hu Jintao looked on at the man who has now eclipsed them. Neither of the two predecessors had their names added to the constitution.
“There is enormous meaning in changing the party’s constitution, since the constitution is the leading guidebook for Chinese development,” Xie Chuntao, member of administrative committee at the Party School of the CPC Central Committee, told China Youth Daily.
“China is currently going through the most comprehensive revolution in its history,” Wang Xinsheng, who is with the School of Marxism at Nankai University, told China National Radio.
“As a country at a critical stage of development, we can’t help asking what we should do to push forward our cause of socialism with Chinese characteristics. And President Xi, the core of the Communist party, is the one who can answer this question.”
In his dramatic ascension, however, Mr. Xi has taken onto himself a degree of personal authority rejected by party elders in favour of consensus rule following the vicious turbulence of the Mao era.
The extent of Mr. Xi’s influence will come into sharper view on Wednesday, when the party unveils the roster of the Politburo Standing Committee, the elite inner trust that holds great power. A relatively youthful new face in the Standing Committee would signal that Mr. Xi has selected someone as his likely successor.
A Standing Committee stacked with older leaders, or perhaps one winnowed from its current seven members to five, would confirm suspicions that Mr. Xi expects to stay in power beyond the two five-year terms allowed for presidents.
Mr. Xi’s more powerful positions as general secretary of the party, and chairman of the Central Military Commission, which he also now holds in addition to his leadership of a number of influential “small leading groups,” carry no such restrictions.
But for at least the next five years, Mr. Xi’s new pre-eminence gives him potent new authority to shape a country of 1.3 billion people after his own vision.
“Non-compliance with his signature policies – the Belt and Road Initiative and Supply Side Structural Reform – is now tantamount to betrayal after their inclusion in the Party Constitution,” said Mr. Blanchette.
His success, however, will be measured in his skill in putting his new power to use.
“The moves over the past week are primarily about increasing Xi’s power within the party-state bureaucracy, so we really won’t know the extent of his power until we see how effectively he can initiate and oversee policy,” Mr. Blanchette said.
FOLLOW NATHAN VANDERKLIPPE ON TWITTER @NVANDERKLIPPE
Oct 18, 2017 | 09:00 GMT
China’s Economic Reforms Get Another Chance

(STR/AFP/Getty Images)
Editor’s Note
The 19th Chinese Communist Party Congress runs Oct. 18-24. The convention marks the start of a transition as delegates name new members to lead China’s most powerful political institutions. But the change in personnel is only part of a larger transformation underway in the Party and in the country — a process that began long before the party congress kicked off and will continue long after it ends. This is the third installment in a four-part series examining how far China has come in its transition, and how far it has yet to go.
The global financial crisis in 2008 was the last straw for the Chinese economy. After years of rapid growth, China had finally reached the limits of its economic model, centered on exports of low-end manufactured goods. The ensuing slump revealed the glaring inequality that still divided the country’s coastal regions from its inland, its wealthiest citizens from its poorest. To get back on track, Beijing would have to break with the socio-economic paradigm that it had maintained for the preceding three decades and introduce a new one.
Today, the transformation is far from complete. The balanced and homogenous society the central government had imagined — and the sustainable, consumption-based economy that would support it — are still little more than a decades long dream. China’s socio-economic disparities are as stark as ever, and the legacy of past growth models continues to haunt the country’s economy. What’s more, Beijing’s attempts at change have unleashed numerous social pressures that China’s growing material wealth had previously kept at bay. For Chinese leaders, the transition poses a dilemma. On the one hand, they understand that reform is necessary to sustain the country in the coming decades. But on the other, they know the difficulties inherent to the transformation could jeopardize their positions, and that of the Communist Party. President Xi Jinping spent his first term in office struggling to reconcile these conflicting concerns, and he’ll spend his second term in much the same way.

Hu’s Legacy Is This
When Xi took office in 2012, he inherited a socio-economic situation in China far different from the one that had greeted his predecessor, Hu Jintao. Hu came to office in 2002, just as China was emerging from the Asian financial crisis and as the dust was settling from reforms to the state sector that had caused massive unemployment. Having survived the crucible, China was ready to resume double-digit economic growth with help from a capital stimulus initiative, a booming private sector and its recent accession to the World Trade Organization. Social and regional inequality, along with rampant bureaucratic corruption, were beginning to take their toll on the country, giving rise to unrest. Still, the government could manage the brewing discontent so long as the economy was strong enough to uphold the Communist Party’s legitimacy.
To that end, Hu focused on growth. But because China’s economic model had already reached its limit, and its workforce was nearing its peak, Beijing had to find new ways to stimulate the economy. Hu and his administration launched a host of measures to try to retool the economy, including efforts to develop China’s inland regions, fiscal incentives to encourage manufacturers to relocate their operations from the coast and reforms aimed at cultivating a domestic consumer base. As it worked to promote these endeavors, however, the government had to contend with resistance from bureaucratic patronage networks and extensive business interests concentrated on the coast, not to mention the global financial crisis that hit in 2008. To keep the economy afloat, the government radically expanded access to credit while also funneling state money into infrastructure projects, particularly in the property sector, through state-owned enterprises and banks.
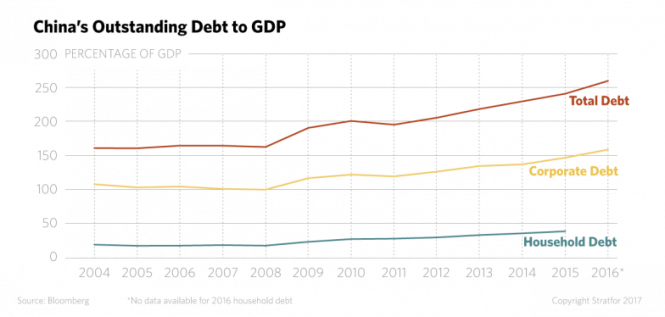
Thanks to these policies, Xi arrived in office to find a precariously swelling real estate bubble, massive overcapacity in China’s industries, severe environmental degradation and a staggering level of debt awaiting him. The government is still dealing with the fallout five years later. Xi’s administration has accepted comparatively sluggish growth as the new normal for China and has adapted its policies and rhetoric to temper expectations for a more robust recovery. Structural reforms to reinvigorate the economy, for instance by phasing out inefficient heavy industrial and low-end manufacturers, and initiatives to curb pollution have made little headway, constrained by Beijing’s core imperative to maintain employment levels. China’s debts, meanwhile, have continued to pile up, reaching an equivalent of 250 percent of the country’s gross domestic product. (Corporate debt alone accounts for 165 percent of GDP, of which state-owned enterprises — mainly in the sectors that most benefited from the credit expansion, such as real estate and steel — hold more than half.) To make matters worse, China’s real estate market is starting to correct itself. The decline in property sales, coupled with the efforts to consolidate China’s unwieldy steel and coal sectors, could bring the simmering debt crisis to its boiling point.

Under the circumstances, Xi has no choice but to try to push forward with structural economic reforms. His attempts to do so have put him on a different course from those followed by predecessors Deng Xiaoping, Jiang Zemin and even Hu. To overcome the many obstacles standing in the way of change, Xi dispensed with the devolved power structure that for some 30 years had given localities, bureaucracies and industries considerable political sway as a way to drive growth. In its place, a more cohesive central government emerged and with it, a more unified Communist Party.
Xi and the Party undertook a sweeping campaign to streamline China’s key economic sectors and bring them and the country’s provinces more firmly under their control. Since taking office, the president has largely consolidated his power over economic decisions while cracking down on Beijing’s disparate political factions, including the array of powerful state-owned industries and the regional cliques of Chongqing, Sichuan and Shanxi. Under the guise of an anti-corruption drive, Xi’s administration has overhauled the Chinese bureaucracy. Not even the country’s entrenched financial and banking sectors have escaped the shake-up. At the same time, Beijing has refrained from stepping in to weaken the state economy, despite its promises of reform in the public sector, preferring mergers and consolidations to rehabilitate ailing state-owned enterprises. It has also apparently reinforced its role in the private sector. By adopting more stringent regulations on outbound investment, for example, the central government aims to increase its oversight of private companies at home — and over itsBelt and Road Initiative projects abroad.
Compared with Western economies, China’s has always been subject to greater state control. However, the Xi administration’s recent moves don’t necessarily signal a return to a command economy in China, nor do they suggest that the Party even aspires to gain total control of economic affairs. Instead, the president is trying to move away from the devolved system that, from his perspective, empowered competing factions whose interests conflicted with, and thereby threatened, those of the central government. With a more unified Communist Party at the helm of China’s economic policy, Xi hopes to bring his vision for the country to fruition.
Falling Into a Familiar Pattern
Of course, whether he can achieve that goal is hardly certain. Beijing can’t prevent provincial and local governments from bucking its orders, given China’s sheer size and complexity. Nor can it keep strategically important sectors from challenging its policies, as many of the country’s high-tech companies have demonstrated. This predicament isn’t unique to Xi’s administration, either; Chinese rulers throughout history have struggled against the forces pulling the country apart to form a coherent political entity. Campaigns to consolidate power inevitably follow stretches of decentralization as new leaders take over, or as tenured rulers encounter new problems.
And so, Xi will likely continue his quest to concentrate control under his office, though the aim of his endeavors will be increasingly unclear. The president outlined an ambitious reform agenda in 2013 in which he called for the market to “play a decisive role” in charting the course of China’s economy. Yet his administration’s apparent return to economic statism, its push for political conformity among the economy’s various sectors and its efforts to give the Party enhanced authority over the state have all undermined or contradicted that goal. Beyond small steps toward liberalizing China’s currency and stock market, Beijing has kept its reforms to the financial system limited to regulatory and bureaucratic changes. Its bids to restructure state-owned enterprises, likewise, have focused on staving off their collapse by bringing them more closely under the Party’s control. Furthermore, the central government’s policies to expand key strategic sectors abroad have only invited pushback from foreign powers, including the United States and the European Union. Xi’s efforts to reform China’s heavy industries have produced uneven results at best — to say nothing of his initiatives to kick-start the country’s languid services sector or to improve conditions for private businesses.
Even so, he could turn things around in the coming years. The steps Xi took during his first term in office to consolidate power could ease the way for deeper and more politically challenging structural reforms in his next term. Otherwise, the president and the Communist leadership may find themselves in a tricky position when the next party congress rolls around in 2022.
Please use the sharing tools found via the email icon at the top of articles. Copying articles to share with others is a breach of FT.com T&Cs and Copyright Policy. Email licensing@ft.com to buy additional rights. Subscribers may share up to 10 or 20 articles per month using the gift article service. More information can be found here.
https://www.ft.com/content/7ed7fe86-b8b4-11e7-8c12-5661783e5589
China consumer sentiment improves as party extols economic record Premium FTCR Consumer Index just short of record high in October despite slower income growth EM Squared Read next EM Squared Chinese operators bullish as freight rates rise Premium Share on Twitter (opens new window) Share on Facebook (opens new window) Share on LinkedIn (opens new window) EmailSave to myFT YESTERDAY by FT Confidential Research The FTCR China Consumer Index rose 0.7 points in October to 74.8, the second-highest reading since our survey launched in July 2011. The improvement in the headline reading was largely the result of household views on the economy, which were at their best on record. This in part reflects the economic and financial market stability engineered as the Communist party leadership met in Beijing for its twice-a-decade congress. Blanket domestic coverage of the congress, including the party’s emphasis on its achievements in developing the Chinese economy and raising living standards, was not lost on Chinese households. In contrast, our measure of household incomes and of their financial situations softened again in October. Although both remained near recent record highs, their relative weakness follows signs that wage inflation is cooling and the housing market is responding to government tightening measures. The wealth effect generated by rising house prices was evident from a pick-up in the reported growth of discretionary spending in October, while indices measuring sentiment towards the purchase of cars and clothing, as well as housing, all improved. Share this graphic Consumers said their discretionary spending improved in October compared with both last month and October 2016. The FTCR China Discretionary Spending Index rose 0.6 points month on month and 2.9 points year on year to 78.1. Our Discretionary Spending Outlook Index also increased, rising 0.4 points month on month and 3.2 points year on year to 75.8. Share this graphic Consumers reported that their household incomes grew at a slower pace for a second straight month but remained well above historical averages. Our Household Income Index fell 0.1 points to 78.2. However, it was 7.6 points higher than last year and 3.7 points above the series average. Our Household Income Outlook Index rose 0.2 points month on month and 5.8 points year on year to 78.4, while our measure of financial situations dropped 0.5 points to 62.8. Share this graphic Household views on the economy were at their best on record in October. Our Economic Sentiment Index rose 3.1 points month on month and 16.6 points year on year to 77. Our Economic Outlook Index also hit a fresh high, rising 4.3 points month on month and 16 points year on year to 85. Share this graphic Consumers reported that their cost of living rose at a quicker pace in October but remained well below the historical average. Respondents estimated their average cost of living rose 7.8 per cent year on year in October, up from 6.7 per cent the previous month and close to the series average of 8 per cent. They expected their cost-of-living growth to increase 7.1 per cent over the next six months, up from 6.5 per cent previously. Share this graphic Our House Buying Sentiment Index rose 0.9 points to 56.3, the second highest reading on record. Our Property Investment Index rose 2 points, taking it 9.9 points higher than last year at 51.1 — only the fourth reading above 50 since our survey launched in July 2011. Indices measuring sentiment towards purchases of cars and clothing both rose but remained below August’s record high readings. Our measure of sentiment towards buying watches and luxury jewellery weakened. Share this graphic Our A-share Buying Sentiment Index, measuring whether consumers perceive now to be a good time to invest in A-shares, fell in October despite another improvement in the stock market. The index dropped 2.5 points to 50.1, but was 6.2 points higher year on year. Actual stock-buying intentions weakened, with 35.2 per cent of retail investors saying they plan to buy stocks in the next three months. Buying sentiment towards funds was also weaker but consumer sentiment towards purchases of wealth management products and insurance products strengthened. The FTCR China Consumer survey is based on interviews with 1,000 consumers nationwide. For further details click here. This report contains the headline figures from the latest Consumer survey; the full results are available from our Database.
China’s Government Bond Woes Prove Infectious
The slow-burn rout in China’s government bonds started to cause some turmoil elsewhere this week. The nation’s $3.4 trillion corporate debt market was showing the strain, as were key policy banks. And stocks took a tumble that may last for a while. The disturbances highlight the difficult course China has chosen, stepping up a deleveraging campaign to make long-term growth more sustainable, at the risk of curbing short-term growth if the consequences prove disruptive. On the other side of the equation, some are concerned the reform moves won’t do enough to get rid of moral hazard. It all adds to the challenges that will greet China’s next central bank chief. And it explains why China is seen in some quarters as one of the top two major risks for the global outlook now.
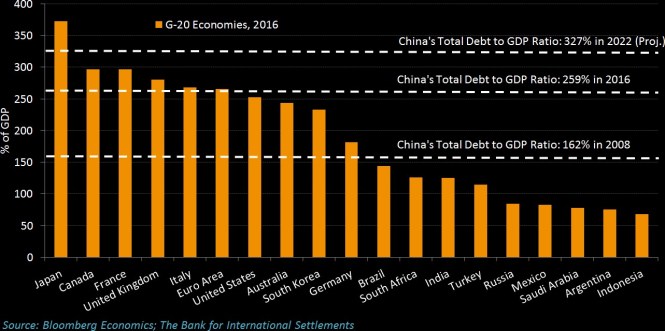
By Lisa Dou

FII General Manager
November 30, 2017
Posted in: China
B.C. Forests, Lands, Natural Resource Operations and Rural Development Minister Doug Donaldson led a B.C.’s largest-ever forest sector mission to China from November 12th to 15th. There were over 40 delegates from more than 20 B.C. forest companies and associations, and representatives from Embassy of Canada to China, the Consulate General of Canada in Shanghai, B.C. Trade Office and Canadian Trade Office joining in the mission. John Kozij, Director General, Trade, Economic and Industry Branch of Natural Resources Canada was one of the delegates.
Although it was an only four-day mission in China, the mission covered comprehensive elements to provide Minister Donaldson and delegates to:
- Gain new insights into China’s economic and political trends;
- Reinforce the commitment of B.C. government to Chinese stakeholders;
- Understand the range of opportunities for B.C. wood products in China;
- And enhance government-to-government relations with key partners.
Minister and the full delegation participated in 3rd Sino-Canada Wood Conference on the first day. It is worth mentioning that there were more than 200 participants attending the conference consisting of Shanghai local MOHURD officials, real estate developers, wood traders, builders and academics. It provides an important platform to promote Canadian forest products, particularly in industrialized construction sector. At the beginning of the conference, Minister Donaldson, Weldon Epp, Canadian Consul General in Shanghai and Mr. Pei Xiao, Deputy Director-General of Shanghai MOHURD provided opening remarks respectively. Furthermore, it also provides opportunities for Canadian sellers and Chinese buyers to strengthen business-to-business relationships.

Minister Donaldson and delegates participating in 3rd Sino-Canada Wood Conference in Shanghai
The panel discussion was another important segment in the conference. Executives from West Fraser, Canfor, Interfor, Tolko and Interex had a discussion moderated by Susan Yurkovich, President and CEO of COFI. The industry executives highlighted that China is one of most important market for Canadian wood business. Nowadays China has been the second-largest export market for Canadian softwood lumber. The Canadian wood industry is committed to China, values China as a business partner and expects to further strengthen this partnership.

Panel discussion by Canadian Forestry Executivies
Following the wood conference in Shanghai, it was an official meeting with Jiangsu Ministry of Housing and Urban-Rural Development (MOHURD) in Nanjing, Jiangsu Province on the second day. Minister Donaldson and other delegates had a deep discussion with Mr. Liu Dawei, Vice Minister of the Jiangsu MOHURD, and other Chinese government and industry stakeholders on the latest developments of wood construction in Jiangsu and potential innovative applications in Jiangsu such as prefabricated wood infill wall, re-roofing and cross-laminated timber. Minister Donaldson expressed gratitude to Jiangsu MOHURD for their efforts and contribution on developing wood technology in Jiangsu province and making Jiangsu Province as a leader in wood construction in China.
Meeting with Jiangsu MOHURD
Also in Jiangsu, CW China signed an MOU with Yadong Group which is a large, specialized real-estate and industrial investment enterprise with witness of Minister Donaldson, John Kozij, Liu Dawei and other governmental officials and industry executives from Canada and China. Signing MOU with Yadong Group will help CW China step further into tourism sector as the group is using wood to build resort home and tourism projects in China including wood-frame villas, hotels and commercial facilities.

MOU signing with Yadong Group; seats from left to right: Michael Loseth, CEO, Forestry Innovation Investment; Liu Chenggang, President of Yadong Group; Rick Jeffery, Chairman of Canada Wood Group
The mission ended with a tour of the Jiangsu Urban and Rural Construction College in which the delegation was introduce the development of wood frame course in the school and its workshop with various wood application models.
The trade mission plays an important role for Canada Wood China carrying out our strategies in Chinese market. Canada is a long-term, reliable partner to China for wood products.
China Economy, Construction & Lumber Shipments
By Eric Wong

Managing Director, Canada Wood China
November 6, 2017
Posted in: China
2017Q3 highlights[i]:
- GDP growth in Q3 is 6.8% (YOY), maintaining strong growth between 6.7% to 6.9% consecutively for 9 months.
- Consumption is 64.5% of GDP, increased by 2.8% compared to 2016.
- Fixed-asset investment in Q1-3 is 45,847.8 billion RMB, grew 7.5% (YOY).
- Investment in real estate development in Q1-3 is 8,064.4 billion RMB, grew 8.1%. New construction started over Q1-3 is 1,310 million m2 (floor space), grew 6.8%.
PMI (Caixin) indexes dropped to 51.0 in September 2017 from 51.6 (August) which was the weakest expansion since this June due to the slow growth of output, new orders and export sales in the past three months[ii].
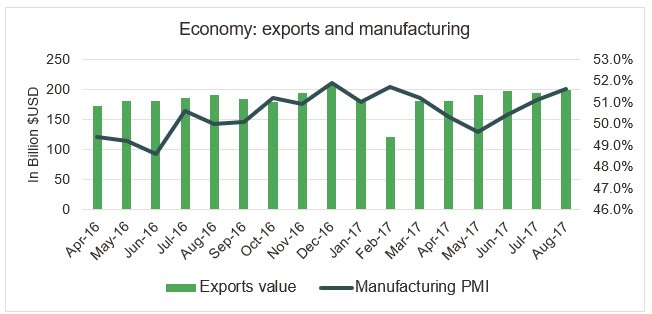
China Consumer Price Index (CPI) has increased 1.6% year-on-year in September compared to the 1.8% rise in August and both under 3% which is Beijing’s 2017 target.[iii] USD/CNY decreased continuously from 6.78(July 1st) to 6.72 (August 1st) to 6.56 (September 1st) and slightly came back to 6.65 (October 1st) [iv]; CAD/CNY fluctuated from 5.23 (July 1st) to 5.35 (August 1st) to 5.29 (September 1st) to 5.34 (October 1st)[v].
Building material prices
Cement price moved from RMB 308.33 to RMB 320.00 per metric ton (up 3.78%%) over September [vi]; Rebar steel price dropped by 3.89% from RMB 4,049.33 per metric ton on September 1st to RMB 3,892.00 per metric ton on September 30th [vii].The log price index in September was 1,106.30 which increased 1.81% more than this August and grew 5.54% YoY; the lumber price index in September was 1,102.98 with 0.85% growth MOM and 1.89% growth YoY[viii].
Wood import of China[ix]
From January to August 2017 the forestry fixed asset investment was worth RMB 144.89 billion which increased 7.1% year-on-year. During the same period around 7.76 million m3 of Russian wood were imported through Manchurian Port with 8.1% growth year-on-year. In the second quarter of 2017 the Swedish softwood lumber inventory was predicted to be 2.1 million m3 with a 21% decreasing year-on-year. Canadian lumber output was 5.2 million m3 in July 2017 which showed -1.9% year-on-year and -9.1% month-on-month; its lumber shipment quantity was 5.5 million m3, down 0.8% year-on-year and down 5.2% month-on-month.

[i] Yawen Chen and Ryan Woo (October 4th, 2017). China September data to show steady growth ahead of key Communist Party congress
[ii] Trading Economics (September, 2017). China Caixin Manufacturing PMI
[iii] Trading Economics (September,2017). China Consumer Price Index (CPI)
[iv] XE Currency Charts: USD to CNY
[v] XE Currency Charts: CAD to CNY
[vi] Sunsirs (September 2017). Spot Price for Cement
[vii] Sunsirs (September 2017). Spot Price for Rebar Steel
[viii] BOABC (September 2017). China Wood and Its Products Market Monthly Report
[ix] BOABC (July to September 2017). China Wood and Its Products Market Monthly Report
Kiwi politics New Zealand’s Labour Party turns defeat into triumph
Another youthful leader takes the helm, even though her party won second place

Oct 20th 2017
FOR the first time since the 1920s, a losing party will form a government in New Zealand. Labour came second in last month’s election, claiming 46 seats with a shade under 37% of the vote. But after the horse-trading had finished, it emerged with political power. It has entered a coalition with New Zealand First, a populist party that won nine seats and held the balance of power. By relying as well on the votes of the Green Party’s eight MPs (who remain outside the coalition), Labour secured a narrow majority in the one-house, 120-seat parliament. The party was polling terribly before the campaign, but recovered under a charismatic new leader, Jacinda Ardern, who has been the boss for less than three months. Her coalition ousts the soft-right National government, which has been in power for nearly a decade. At just 37 years old, Ms. Ardern joins a growing club of youthful leaders promising to shake up politics.
The result will incense the conservatives, led by the outgoing Prime Minister, Bill English, who steered the economy out of the financial crisis and returned it to enviable growth. After three terms in charge, his National Party won 44% of the vote—and ten more seats than Labour. Under New Zealand’s German-style system of proportional representation, the winning party does not have the first opportunity to form a government, however. Any leader who can command the confidence of parliament may do so. Expect dissatisfaction from conservative voters who are “not used to the biggest party not being in government”, says Bryce Edwards, a political analyst.
Ms Ardern, who almost single-handedly breathed new life into her party after its decade on the sidelines, is liked for her warmth and approachability. She makes an unusual mate for Winston Peters, the belligerent 72-year-old leader of New Zealand First. Yet the two have found common ground on issues relating to the economy. Labour will not announce policy agreements until next week, but will almost certainly push forward with promises to cut net immigration by almost half, to stop foreign non-residents from buying houses, and to renegotiate existing and prospective trade deals. Mr Peters will be rewarded with four cabinet positions for his party and another, less senior ministerial spot. For the second time in his career, he has also been offered the role of deputy prime minister. After feigning a lack of interest in the spoils, he will probably accept.
He said that he had chosen to side with “change” over a “modified status quo” because “far too many New Zealanders have come to view today’s capitalism not as their friend but as their foe”. It is time, he argued, “for capitalism to regain a human face”. Strategically, identifying with a new government makes sense for New Zealand First, which has been stung by coalitions with incumbents in the past. But Mr Peters’s comments alarmed some observers, who fear that the new government will now veer leftwards, ending more than 30 years of liberal reform. The New Zealand dollar fell immediately.
Labour’s positive campaign resonated with some locals whose personal wealth has not grown alongside the economy. Many are frustrated by high house prices and increasingly gridlocked roads. Yet New Zealanders are not ideologically divided, nor itching for the revolution to which Mr Peters points. The campaigns of the two main parties were generally mild-mannered and at times painfully polite. After three terms of conservative leadership, the mood for change was as much a product of boredom as of anti-establishment zeal. The main local news channel switched off its coverage before Mr English made a magnanimous speech conceding defeat on October 19th. It did something similar before the final count came in on election night. Interested New Zealanders had to turn to Australian networks instead.
Promising the Moon South Korea tries to boost the economy by hiking the minimum wage
But at 70% of the median wage, is it going too far?

Oct 12th 2017| Seoul
A LOT has changed since Jeon Tae-il killed himself. In 1970, when the 22-year-old South Korean set himself alight to protest about poor working conditions, his country received millions of dollars of foreign aid. Now it is the world’s 11th-biggest economy. The statue that commemorates him in the capital, Seoul, is dwarfed by skyscrapers. Passers-by play games on their smartphones. Yet his memory is often invoked by activists and politicians who argue that ordinary workers do not get their fair share of the national pot of kimchi. “He was a great man,” says a market trader, having a cigarette break next to the memorial. “Things have improved a lot but our wages are still poor.”
Moon Jae-in, the left-leaning president who took office in May, was elected in part on the promise of changing that. The centrepiece of his economic policy is a bold experiment in raising the minimum wage. The first step is a 16.4% increase set for next year, the biggest rise since 2000. The difference is that in 2000 the economy was growing three times as fast as it is now. Even more ambitious is the sequence of increases planned for coming years, intended to produce a total rise of 55% by 2020.
South Korea’s is far from the only government ratcheting up the minimum wage, but the others that have opted for such big increases have typically been those of wealthy cities or regions in rich countries, such as Seattle and Alberta. It is rare for an entire country to move so aggressively, especially one that relies on exports. If South Korea follows through as intended, its minimum wage will be roughly 70% of its median wage by 2020, well above the level in all other big economies (see chart).

On the face of things, the South Korean economy is doing well. Growth has averaged 3% annually over the past six years, a decent outcome for a period when global trade was sluggish. Income per person is about two-thirds of America’s, up from a third 25 years ago. The unemployment rate is just 3.6%. South Korea spends more as a share of GDP on research and development than almost any other country.
But it may not be the best time for such a radical economic reform. There are immediate concerns: Donald Trump’s threat to tear up a bilateral free-trade pact, foreign investors’ jitters over the nuclear stand-off with North Korea and Chinese economic retaliation in response to South Korea’s deployment of an American missile-defence system. There are also more lasting worries: high household debt, a rapidly ageing population and stiffer competition from China in a range of industries.
Nonetheless, poorer Koreans resent rising inequality. The chaebol—sprawling family-run conglomerates such as Samsung and Hyundai—dominate business, as they have for decades. A study by the International Monetary Fund last year found that the top 10% of South Koreans receive 45% of total income—a greater concentration than in other big economies in Asia. The proportion has risen sharply over the past two decades as the wages of the rich have grown faster than those of the poor. A spike in youth unemployment earlier this year highlighted a mismatch between the needs of business and an education system that is geared towards producing stellar test scores. Adjusted for inflation, household incomes fell last year, something that in recent decades had happened only in the wake of financial crises.
In his campaign Mr. Moon pledged to take on vested interests and rev up the economy. Nearly six months into his presidency, he has taken several symbolic steps in that direction. He has appointed Kim Sang-jo, known as the “chaebol sniper”, to head the Fair Trade Commission, raising expectations that he will try to reduce the big conglomerates’ clout. His government is nudging up taxes on companies and high-earners. It has also increased spending, albeit modestly. But most striking of all in its immediate impact is the hefty increase in the minimum wage, the heart of what Mr. Moon calls his “income-led growth” strategy.
The bet is that the jump in wages will feed through to stronger consumption, particularly as low-earners tend to spend more of their pay than the rich do. In addition to propping up growth, stronger consumption would make South Korea less reliant on exports and so less beholden to the whims of China and America, Mr. Moon predicts. It should also help reduce inequality.
Politically, the push for higher wages is popular. All the main candidates in the presidential election matched Mr. Moon’s pledge to increase the minimum wage to 10,000 won ($8.80) per hour. They differed only about how quickly to do so. Two said they would reach the goal by the end of their five-year term; three, including Mr. Moon, said they would do it by 2020.
Whether the increase will actually work as planned is, however, in doubt. Nearly 14% of companies ignore the current minimum, according to a government-run employment agency; it reckons the share could go up to 20% next year. The vast majority of people on the minimum wage work at smaller businesses, not chaebol. Nearly all respondents to a survey by the Korean Federation of Micro Enterprise said they would consider laying off workers to cope with higher wage bills.
Park Kyung-ja, 59, who runs two convenience stores with her son, says the rise will hit them hard. They plan to close their less profitable branch to cut costs and will probably cut two of six part-time staff, who are paid the minimum wage. “What could we sell here to make up that cost?” she says, gesturing to the packs of chewing gum and cigarettes.
Evidence from elsewhere suggests that increases in the minimum wage generally lead to only slight declines in employment as well as to solid rises in income for those on lower salaries. But at a certain point—economists use 50% of the median wage as a rule of thumb—employers will begin to cut back on hiring. Misgivings are widespread enough that the government has promised to review the policy next year.
Another concern is that the reform does nothing to diminish the sharp split between permanent employees and those on part-time or temporary contracts. Other economies have similar divisions, but they are particularly pronounced in South Korea, with permanent employees accounting for less than 50% of the workforce. As Sung Taeyoon of Yonsei University puts it, half of workers end up overpaid and overprotected, and the other half underpaid and insecure.
No remedy is straightforward. The government could make it easier for companies to fire permanent workers or expand social spending to provide more of a backstop for those with temporary jobs. However, the former would anger Mr Moon’s base and the latter would require a big increase in taxation.
Raising the minimum wage, by contrast, is popular and cheap for the government. But it risks exacerbating the divide in the workforce and further discouraging companies from creating permanent jobs. An executive at a big company says that it will lead to greater polarisation between profitable conglomerates and struggling small businesses—just the opposite of what the government set out to do. Mr Moon’s big experiment could soon turn into a big liability.
This article appeared in the Asia section of the print edition under the headline “Promising the Moon”
Please use the sharing tools found via the email icon at the top of articles. Copying articles to share with others is a breach of FT.com T&Cs and Copyright Policy. Email licensing@ft.com to buy additional rights. Subscribers may share up to 10 or 20 articles per month using the gift article service. More information can be found here.
https://www.ft.com/content/fe003926-b8dc-11e7-9bfb-4a9c83ffa852
India agrees $32bn plan to recapitalise state banks Balance sheets strained by soaring corporate defaults Read next Opposition says Kenya constitution being subverted 2 HOURS AGO The Reserve Bank of India. State banks have been hit by soaring corporate defaults © Bloomberg Share on Twitter (opens new window) Share on Facebook (opens new window) Share on LinkedIn (opens new window) Email11 Save to myFT YESTERDAY by Simon Mundy in Mumbai India’s government has announced a $32bn recapitalisation plan for the country’s ailing state-controlled banks in a bid to tackle a festering economic problem. The finance ministry promised on Tuesday to take a “massive step . . . to support credit growth and job creation” by shoring up bank balance sheets strained by soaring corporate defaults over the past three years. Of the Rs2.11tn ($32.4bn) to be raised over the next two years, Rs1.35tn would come through recapitalisation bonds, the ministry said, promising further details in due course. Karthik Srinivasan, financial sector head for rating agency ICRA., said the government was likely to issue the bonds to the banks themselves and use the proceeds to inject capital in them — an approach previously used by New Delhi in the 1990s. The state banks have been faced with weak credit demand this year and have lost market share to private sector rivals. A further Rs580bn will be raised from private investors, diluting the government’s holdings in the banks, while direct budgetary support will account for a further Rs181bn. Analysts at Nomura called the intervention “growth positive”, while noting that it would push up the stock of government debt, even if the recapitalisation bonds are not formally included in the fiscal deficit estimate. India is aiming to bring its deficit down to 3.2 per cent of gross domestic product in the fiscal year ending next March, from 3.5 per cent in the last year. Concerns about the condition of the state-owned banks, which account for more than two-thirds of sector assets, have been mounting along with estimates of their bad loans. Recommended Serious economic reform is key to unlocking India’s potential Modi’s pursuit of black money proves drag on India’s economy Why Thomas Piketty is wrong about inequality in India This is because of a spurt in loans to companies in sectors such as steel and infrastructure over much of the past decade, many of which subsequently turned sour. Gross non-performing loans at the state-controlled banks rose to 13.7 per cent of their assets at the end of June, up from 5.4 per cent in March 2015. The finance ministry’s announcement implicitly acknowledged the limitations of the government’s previous recapitalisation plan, announced two years ago. That allowed for government capital injections of Rs519bn and a further Rs213bn from the market. Beyond the recapitalisation, the government promised to push the banks to step up their lending to small and medium-sized enterprises, including by partnering with financial technology companies. This sector was badly hit by India’s demonetisation last year, which triggered a shortage of bank notes that rocked companies long used to dealing entirely in cash. Further problems were caused for many smaller companies by the introduction in July of a new goods and services tax. The government acknowledged the hit to growth from the tax on Tuesday, while calling it “a historic economic and political achievement”. The government also gave new details of its plans for infrastructure investment, with Rs6.9tn to be spent on a 83,677km road-building programme over the next five years.

Investors Told to Brace for Steepest Rate Hikes Since 2006
By
David Goodman
Aviva’s Nicola Sees Three Hikes for Fed Into 2018
China Credit Growth Tops Estimates
Stiglitz Says U.S. Tax Bill Is the Worst He’s Ever Seen
Aviva investment strategist Mary Nicola discusses Fed policy, inflation and her out for markets in 2018.
Wall Street economists are telling investors to brace for the biggest tightening of monetary policy in more than a decade.
With the world economy heading into its strongest period since 2011, Citigroup Inc. and JPMorgan Chase & Co. predict average interest rates across advanced economies will climb to at least 1 percent next year in what would be the largest increase since 2006.
As for the quantitative easing that marks its 10th anniversary in the U.S. next year, Bloomberg Economics predicts net asset purchases by the main central banks will fall to a monthly $18 billion at the end of 2018, from $126 billion in September, and turn negative during the first half of 2019.
That reflects an increasingly synchronized global expansion finally strong enough to spur inflation, albeit modestly. The test for policy makers, including incoming Federal Reserve Chair Jerome Powell, will be whether they can continue pulling back without derailing demand or rocking asset markets.
“2018 is the year when we have true tightening,” said Ebrahim Rahbari, director of global economics at Citigroup in New York. “We will continue on the current path where financial markets can deal quite well with monetary policy but perhaps later in the year, or in 2019, monetary policy will become one of the complicating factors.”
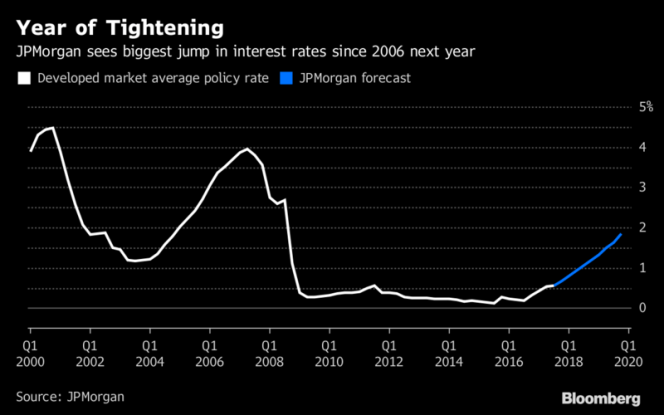
A clearer picture should form this week when the Norges Bank, Fed, Bank of England, European Central Bank and Swiss National Bank announce their final policy decisions of 2017. They collectively set borrowing costs for more than a third of the world economy. At least 10 other central banks also deliver decisions this week.
The Fed will dominate the headlines on Wednesday amid predictions it will raise its benchmark by a quarter of a percentage point. Outgoing chair Janet Yellen is set to signal more increases to come in 2018. On Thursday, the SNB, BOE and ECB will make decisions in quick succession although each is forecast to keep rates on hold.
There will likely be more activity next year as Citigroup estimates the advanced world’s average rate will reach its highest since 2008, climbing 0.4 percentage point to 1 percent. JPMorgan projects its gauge to rise to 1.2 percent, a jump of more than half a percentage point from 0.68 percent at the end of this year.
Citigroup expects the Fed and its Canadian peer to move three times and the U.K., Australia, New Zealand, Sweden and Norway once. JPMorgan is forecasting the U.S. will shift four times. The latest Bloomberg survey also showed three Fed hikes in 2018, but moved forward one of them to March from June.
Behind the shift are expectations that the world economy will expand around 4 percent next year, the best since a post-recession bounce in 2011. Among the accelerators: falling unemployment, stronger trade and business spending, as well as a likely tax cut in the U.S.
The International Monetary Fund predicts consumer prices in advanced economies will climb 1.7 percent next year, the most since 2012, although it remains below the 2 percent most central banks view as price stability.
The global tightening will still leave rates low by historical standards and central banks may ultimately hold fire if inflation stays weak. Neither the ECB nor the BOJ are currently expected to lift their benchmarks next year.
Past and ongoing bond buying will cushion the withdrawal of stimulus elsewhere, as will easing by some emerging market central banks. Russia and Colombia may this week follow Brazil in cutting their benchmarks.
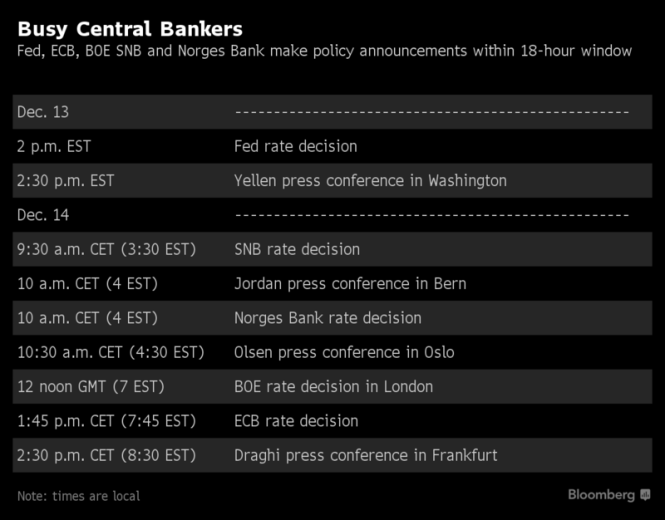
While BOE Governor Mark Carney and ECB President Mario Draghi pivoted away from easy money without roiling financial markets, the calm may not last. The Bank for International Settlements warned this month that policy makers risk lulling investors into a false sense of security that elevates the risk of a correction in bond yields.
| What Our Economists Say…
“Many developed market central banks, led by the Fed, are entering 2018 taking a leap of faith that inflation will return as they move toward normalizing monetary policy. Continued asset purchases by the BOJ and ECB will buy sometime for policy makers to discover the unattended consequences of quantitative tightening without risking a severe market disruption. Nevertheless, too much normalization too fast, risks reversing a relatively upbeat global economic outlook in 2018, especially if central bankers’ assumptions on the Phillips Curve prove to be false.” –Michael McDonough, Bloomberg Economics |
Investors are already less bullish than most economists. In the U.S., where inflation has shown some signs of slowing, the market sees about two quarter-point hikes next year, according to federal funds futures contracts. There is also speculation the bond yield curve may even invert as long-term borrowing costs fall below short-term ones, a trade which sometimes foreshadows a recession.
Torsten Slok, chief international economist at Deutsche Bank AG in New York, is betting that “quantitative tightening” will hit markets in the second quarter. That’s when he assumes U.S. inflation takes off and the ECB signals an end to bond buying.
“We see 2018 as a pretty key year for normalization,” said Victoria Clarke, an economist at Investec in London. “It’s going to be quite challenging for central banks to get the balance right on how much to do.”
— With assistance by Jeff Black, Anooja Debnath, Zoe Schneeweiss, Brett Miller, and Andre Tartar


/arc-anglerfish-tgam-prod-tgam.s3.amazonaws.com/public/FNRH7HTXZBHOBH5TT7Z2IJOT6E.jpg)
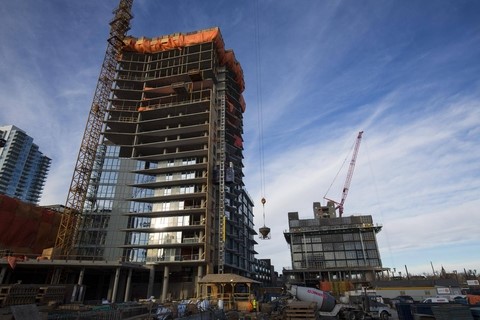


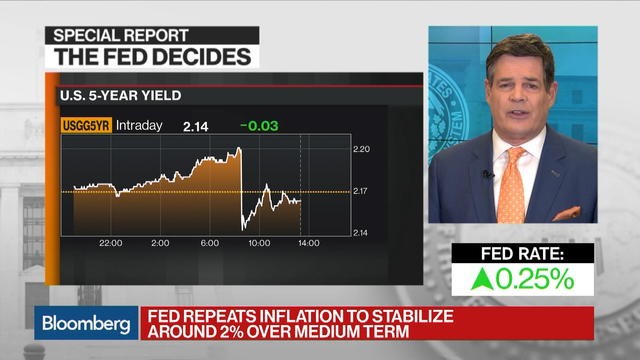


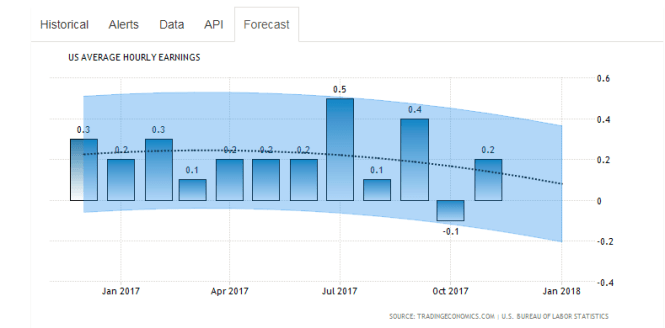


 Svenja Gudell , Contributor