
Canada
CENSUS 2016
Census 2016: Income grows in resource-rich provinces, Ontario and Quebec lag behind
Over the past decade, Canadian median income rose 13 per cent for individuals, with much variation between regions, according to the latest data. Here are the highlights
Median household total income in 2015,

Median household total income in 2015, by 2016 census division
Income
Tavia Grant , Rachelle Younglai and MURAT YUKSELIR
Most Canadians saw their incomes climb over the past decade as the resource sector boomed, though new census numbers underscore the dramatic variation between regions.
The median incomes of individuals in Canada rose 12.7 per cent between 2005 and 2015, to $34,204, adjusting for inflation, Statistics Canada said Wednesday. For Canadians in all household types, median income rose 10.8 per cent between 2005 and 2015, to $70,336. That is an acceleration from the prior decade’s 9.2-per-cent growth and the decline of 1.8 per cent between 1985 and 1995.
The income data is the fourth tranche of information from the 2016 census following releases this year on population, age, language and living arrangements. It’s the first time the agency has linked income data from the Canada Revenue Agency to all census respondents.
The findings paint a picture of growth for most households, though the gains were uneven. Households in the Prairies registered rapid increases in median incomes, led by Saskatchewan where median individual incomes jumped 36 per cent in the decade. Median incomes in Ontario and Quebec, which have the highest populations and suffered steep factory job losses, saw the weakest gains. More seniors are living in low income, while the share of young children living in poverty declined.
As a result of these shifts, Ontario’s low-income rate is now close to the national average. The Atlantic Provinces still have the highest low-income rates in Canada.
“The biggest thing that jumps out, when you look at median household income, is the clustering of growth in provinces and cities,” said Brian Murphy, chief of analysis for census income at Statscan. “The strong growth has been in the West, the North and Newfoundland, so areas related to high resource development, so a lot of construction follows … in the flip side of that, Ontario shows up as having below-normal growth.”
Canadians experienced sweeping economic changes in the 10-year period, with a 2008-2009 recession followed by a recovery and rapid price increases in the housing market, especially in urban areas such as Vancouver and Toronto, where average house prices nearly doubled in the decade. Because it’s based on 2015 incomes, the data does not fully capture the impact of the 2015-2016 oil price collapse that slammed resource-dependent provinces such as Alberta and Newfoundland.
Median income: The big picture
The median income for individual Canadians rose 12.7 per cent to $34,204 over the past decade, with the heftiest gains in the oil-producing provinces.
The median individual income in Newfoundland and Labrador rose 37 per cent to $31,754. In Saskatchewan, it increased 36 per cent to $38,299 and in Alberta it grew 25 per cent to $42,717.
The multiyear boom in commodities prices was responsible for driving up wages in the three resource-dependent provinces. The fastest growth for individuals was in the oil sands region of Wood Buffalo, Alta., where the median income rose 49 per cent. Other areas that experienced rapid wage increases included Yorkton and Estevan in Saskatchewan.
Meanwhile, the loss of factory positions in the country’s manufacturing heartland of Ontario weighed heavily on the province. The median individual income increased 3.8 per cent to $33,359 – the slowest growth in the country.

In areas where manufacturing was a major employer in Ontario, the median income dropped over the decade. Windsor saw the median income fall 1.5 per cent. When looking at households, the median income in Windsor declined 6.4 per cent, Tillsonburg dropped 5.7 per cent and Leamington fell 2.8 per cent.
The release is notable for what it doesn’t contain: the agency compared income trends in 2015 with the 2005 census, skipping over any comparison with the 2011 National Household Survey. That last release on 2011 incomes was controversial as a government-mandated switch to a voluntary survey resulted in lower response rates. Many researchers didn’t use the data, citing it as unreliable.
The release also didn’t contain details on demographics, such as how incomes by ethnicities fared in the 10-year period, how education levels affected income trends or which occupations saw the strongest gains. Nor did it detail how income inequality changed in the past decade, or changes in income distribution.
Which Canadians earned more?
Cities within the oil-producing provinces experienced the steepest increase in the number of people earning more than $100,000, which is considered in the top 10 per cent of all income earners.
In Saskatchewan, the number of these high-income earners more than tripled in North Battleford and Yorkton. In Bay Roberts, Nfld., and Okotoks, Alta., the number of individuals earning at least $100,000 nearly tripled.
Toronto and Montreal continued to be the top two locations for individuals earning a minimum of $100,000 in 2015. But over the 10-year period, Calgary edged Vancouver out of the third spot. Calgary, which is home to major oil companies headquarters, nearly doubled the number of high-income earners while Vancouver increased its ranks by 55 per cent.
In contrast, Toronto’s high-income earners grew by 40 per cent and Montreal rose by 35 per cent.
Which Canadians earned less?
Canada’s low-income rate – as measured by the after-tax low income measure – was 14.2 per cent in 2015 from 14 per cent a decade earlier. The measure counts a household as low income if it earns less than half of the median of households. As of 2015, the low-income threshold for someone living alone was $22,133.
All told, 4.8 million people in Canada were considered as living in low income in 2015, compared with 4.3 million in 2005.
Though the rate was little changed, the poverty shifted among regions and age groups. More seniors are living in low income, while the proportion of children under the age of five in low-income households declined. “While the increase was particularly strong for senior men, overall, senior women were still more likely to be in low income in 2015,” Statscan said.
By province, low income shares fell “sharply” in Newfoundland (to 15.4 per cent from 20 per cent) as well as in Saskatchewan, the agency said; in Ontario, it rose to 14.4 per cent from 12.9 per cent.
More details on low-income trends by demographic groups will come in Statscan’s November release.
Children and low income
Children represent nearly a quarter of people in low-income in Canada, with almost 1.2 million kids under the age of 18 living in poorer households in 2015.
Their share in the low-income population has been falling, helped partly by the introduction of new policies. The average child benefit that families received “has nearly doubled since the 1990s,” the agency noted. Among cities, Windsor, Ont. (hit hard by a manufacturing downturn) has the highest rate in Canada of children living in low-income households. Nearly one in four kids in the city lived in low income.
By province, Alberta has the lowest rate of kids living in poverty, while Nova Scotia and New Brunswick have the highest rates. Quebec – which has lower daycare costs and higher child benefits – is the only province where kids are less likely than adults to live in low-income households.
By household type, single-mother families have the highest incidence of children in low-income, at 42 per cent. Two-parent families have a lower rate, at 11.2 per cent. And households with three or more children tend to have higher child poverty rates.

A tale of two Canadas: Where you grew up affects your income in adulthood A study of millions of Canadians’ income data reveals a country of opportunity, with most children out-earning their parents – but also a country pocked with mobility traps, Doug Saunders and Tom Cardoso explain.

Population: Western provinces are the fastest-growing in Canada As of 2016’s census day, there were 35,151,728 people in Canada, and nearly one in three lived in the West.

Age and gender: The growing generational gap and other key takeaways Statscan’s May release painted a clearer picture of Canada’s aging population and how they live.
Families: More Canadians than ever living alone For the first time in the country’s history, the number of one-person households surpassed all other types of living situations in 2016, Gloria Galloway explains.

Where RBC sees the Canadian dollar heading next

The loonie is pictured in this illustration picture taken in Toronto January 23, 2015.
MARK BLINCH/REUTERS
23 hours agoSeptember 12, 2017
For Subscribers
The strong Canadian dollar has been weighing heavily on U.S. dollar assets held by Canadian investors, but is the pain nearly over?
Here’s one way to look at the issue: The S&P 500 is at a record high in U.S. dollar terms, but if you hold an S&P 500 index fund priced in U.S. dollars, then your holding in Canadian dollar terms is down more than 6 per cent since June. Your U.S. bonds are probably smarting even more.
Add in the lacklustre performance of Canadian stocks – the S&P/TSX composite index is down nearly 5 per cent since February – and your investment portfolio just might be sputtering as we approach the final quarter of 2017.
Currency trends are notoriously difficult to predict, but it helps to arm yourself with an understanding of what’s driving the moves.
The loonie has recently surged above 82 cents (U.S.), up from about 75 cents since the start of the summer. The remarkably sharp increase follows surprisingly strong Canadian economic growth that has pushed the Bank of Canada to raise its key interest rate twice in the past three months – with more hikes likely on the way.
In a report on global currencies by Royal Bank of Canada, analysts now expect Canadian gross domestic product will rise 3.1 per cent in 2017, up from an earlier forecast of 2.6 per cent. Needless to say, they also expect the Bank of Canada will raise its key interest rate again in October.
This might suggest that the Canadian dollar is going to continue to move up, but RBC analysts believe that the biggest moves are behind us and that the loonie should settle back.
That’s because the U.S. dollar, which has been weak against a basket of global currencies, is by no means down for the count: Stronger global currencies are merely adjusting to the fact that the U.S. Federal Reserve is not the only central bank now raising interest rates from ultra-low levels.
“The standard explanation for U.S.-dollar underperformance is that it reflects a reversal of the policy divergence theme that drove previous U.S.-dollar outperformance when the Fed was the only major central bank hiking rates. Now, the Bank of Canada has followed (twice) and markets are priced for varying degrees of policy normalization elsewhere, including the Bank of England, European Central Bank and smaller European countries,” RBC said in its note.
Some observers believe that the U.S. Federal Reserve might even have to delay additional rate hikes given U.S. economic uncertainty, which is also undercutting the greenback. And confusion over the direction of the Trump administration isn’t helping matters.
However, RBC expects that the U.S. economy will continue to power ahead (GDP in the second quarter was revised up to 3 per cent from 2.7 per cent), pushing interest rates higher.
“With just one hike priced between now and mid-2018, it should not be hard for the Fed to over-deliver,” the RBC analysts said in their note.
Changes to U.S. tax laws, which could encourage U.S. companies to repatriate foreign earnings, could provide another bump to the U.S. dollar.
Yes, there are a lot of moving parts here, which underscores the difficulty in making currency predictions. Nonetheless, RBC expects the Canadian dollar will slip below 81 cents against the U.S. dollar in the fourth quarter of this year, and retreat below 79 cents in the first quarter of 2018.
Your U.S. dollar assets, which have struggled this year, might soon provide a tailwind to your results
United States
Hurricanes Harvey & Irma: What They Could Mean for Housing
We cover homes and the real estate marketplace. Opinions expressed by Forbes Contributors are their own.
 Svenja Gudell , Contributor
In the immediate aftermath of Hurricane Harvey, and ahead of the huge potential for danger and destruction still to come from Hurricane Irma, there remains much uncertainty and fear about estimated and actual damage to housing markets in Texas and the Southeast. But based on past and present research, there are several things we can state with confidence about both situations, and more about which we can make educated assumptions.
As more data comes in and official reports are finalized, we will update these facts and figures wherever possible. But here’s what we know now:
Hurricanes, Housing and Our Love of the Ocean
Over the past roughly two decades, a number of destructive hurricanes have had a costly immediate impact on a huge number of U.S. coastal communities – from Hurricane Andrew, through Katrina, Sandy and most recently Harvey. While the immediate impact on housing is immense and often runs in the billions of dollars’ worth of damage, the lasting impact of these kinds of storms on local housing markets is surprisingly minimal.
Our research shows that properties near the coast – those most likely to get battered by the wind, rain and storm surges wrought by large hurricanes – exhibit a consistent pattern:
- They command a significant premium over properties located farther inland;
- They retain that premium even after the danger posed by these storms has become obvious.
The bottom line: Homebuyers love coastal areas. The attraction of living near the sea is too strong to dampen interest simply because of a few hurricanes here and there. Evidently, people either quickly forget the potential dangers, or they place more weight on the upsides of coastal living. Whether or not this holds true in the wake of Harvey and Irma remains to be seen.
Read our research on the premium placed on coastal properties – both before and after large storms.
Hurricane Irma: What Can Miami Expect From a Six-Foot Storm Surge?
Hurricanes pose an immediate danger, through rising seas caused by storm surges and wind-whipped high tides. But a more gradual threat is no less real and potentially much more destructive than localized, hurricane-driven flooding: The threat of rising sea levels caused by climate change.
Given growing evidence of the relationship between climate change and the strength of major hurricanes like Irma and Harvey, this threat becomes doubly important.
Some estimates suggest sea levels will rise six feet or more by the year 2100 if climate change continues unchecked. Using maps from the National Oceanic and Atmospheric Administration (NOAA), in conjunction with our database of information on more than 100 million homes nationwide, we determined which properties were at risk of being submerged (at least their ground floors) in the next century or so, and roughly what they’re currently worth.
Our research found:
- Nationwide, almost 1.9 million homes (or roughly 2 percent of all U.S. homes) – worth a combined $882 billion – are at risk of being underwater by 2100.
- If sea levels rise as much as climate scientists predict by the year 2100, almost 300 U.S. cities would lose at least half their homes, and 36 U.S. cities would be completely lost.
- One in eight Florida homes would be under water, accounting for nearly half of the lost housing value nationwide.
Miami sits squarely in the projected path of Hurricane Irma, which is expected to bring a significant storm surge that could easily exceed six feet or more. For reference, in Miami, a sea level rise of six feet could flood almost 33,000 homes, worth a combined total of $16 billion (as of summer 2016).

Zillow Research
Underwater Homes in Miami
Hurricane Harvey & Houston-Area Housing: What We Know
Based on very preliminary flood data coming out of Hurricane Harvey’s immediate impact zone in Southeast Texas, combined with home value information from our database, we can make some initial estimates about the amount of housing damage sustained in the region.
Hurricanes Highlight Failure to Enforce Flood Insurance Rules
Government-backed mortgage holders in high-risk areas are required to maintain a policy. But federal agencies are playing “not it” over who has to hold them accountable.
By Christopher Flavelle
September 13, 2017, 9:15 AM MDT

A resident of Bonita Springs, Fla., removes her belongings from her home on Sept. 12, 2017, after it was flooded by Hurricane Irma.
PHOTOGRAPHER: MARK WILSON/GETTY IMAGES
As the floodwaters of Hurricanes Harvey and Irma recede, they may reveal more than moldy drywall and fetid trash. They could lay bare the federal government’s failure to police a basic tenet of its own disaster policy: that properties with government-backed mortgages in risky areas carry flood insurance.
The government has known for decades that homeowners in flood zones often don’t have the insurance they should. Just two years ago, the Federal Emergency Management Agency estimated that as few as half of the 1.5 million residential structures required to carry flood insurance actually do. It can’t be sure, though: FEMA isn’t responsible for tracking that kind of data—nor is any other agency.
“This is a huge blind spot,” says Samantha Medlock, a senior adviser to President Obama on flood insurance policy. Homeowners with lapsed insurance could “mistakenly believe that if their luck runs out, the federal government will come in and take care of them,” she says.
The magnitude of the risk is revealed partly by the numbers of uninsured homes in the paths of the recent storms. More than 80 percent of homeowners in the Texas counties hit by Harvey lack flood insurance, according to a Washington Post analysis. In Florida, FEMA estimated in 2015 that as many as 43 percent of those required to have coverage didn’t. And as climate change and coastal development increase the number of homes at risk, it’s becoming harder for the federal government to keep ignoring the problem.

When a mortgage is issued, the lender is supposed to check whether the home is in a flood plain, and if so, it should require the owner to acquire insurance. When that mortgage is sold to investors, the company that services it must make sure the premiums are paid or pay them through escrow. If the coverage lapses, the servicer is supposed to buy coverage on the homeowner’s behalf, then add the premiums to the mortgage payments.
Fannie Mae, Freddie Mac, and government entities own or guarantee 60 percent of U.S. mortgages. Lisa Tibbitts, a spokeswoman for Freddie Mac, says the insurer conducts yearly reviews of its loan portfolio, including rates of flood insurance coverage. “These reviews reveal a very low percentage of noncompliance,” she says.
And yet, since 2012, the Office of the Comptroller of the Currency, which regulates federal banks, has fined at least 27 institutions for failing to meet their obligations on flood insurance. Experts in flood insurance policy say the process appears to break down after the mortgage is made. Homeowners required to carry insurance typically keep paying their premiums for just two to four years, said University of Pennsylvania researchers in a 2012 study.

“There are plenty of areas to pass the buck in the chain of mortgage finance,” says Nela Richardson, chief economist for Redfin Corp. “That’s what makes it ultimately hard to track.” The National Mortgage Servicing Association, a trade group that represents servicers, didn’t respond to a request for comment. Four of the five largest servicers as identified by Inside Mortgage Finance declined to provide information about how many of their mortgages even require flood insurance, let alone how many comply. About 4 percent of mortgages at Wells Fargo & Co., the country’s largest servicer, require the insurance, according to spokesman Tom Goyda. He declined to say how many of those homeowners had stopped paying their premiums or how much time typically goes by between a policy lapsing and Wells Fargo finding out about it.
Mortgage lenders and servicers that are lax about flood insurance tend to be penalized lightly. In March 2013 the OCC, which regulates federal banks, determined that Amarillo National Bank had been making or renewing loans without requiring the necessary flood insurance. The fine? All of $7,250. In July 2015, Sumner National Bank of Sheldon in Illinois was fined just $3,000 for allegedly engaging in a pattern of “making, modifying, or renewing loans” without requiring coverage. First Federal Community Bank in Dover, Ohio, got dinged for $1,800. The banks neither admitted nor denied liability.
Ignoring flood insurance could soon become more costly for the mortgage industry, says Carolyn Kousky, a flood insurance expert at the Wharton School at the University of Pennsylvania. “So far there hasn’t been enough of a default risk to motivate lenders to do more on their own, voluntarily, but we’re seeing worse and worse events,” she says. “After Harvey, we might see a different kind of response.”
That’s because uninsured homeowners with severe damage may decide their only option is to abandon the property and stop making mortgage payments. “If you’ve lost your home and you don’t have insurance, that’s a good time to walk away from your property,” said R.J. Lehmann, an insurance expert at the R Street Institute, a libertarian research organization in Washington.
Fannie Mae and Freddie Mac can force servicers to buy mortgages they’ve sold or had guaranteed if they don’t have the required flood insurance, according to the Federal Housing Finance Agency. Susan Wachter, a professor of finance at Wharton, says that’s true—but it only works if the servicer has the money. And as flood events increase, so does the risk that individual servicers, which increasingly aren’t banks, will run out of funds.
“Servicers may be contractually on the line, but if they don’t have the capital, then they can’t pay up,” Wachter says, adding that taxpayers could be further exposed if clusters of homes default at the same time, reducing the value of houses around them.
Some experts have suggested that the federal government should require all homes to have flood insurance. Another possibility is to have policies last as long as 10 years.
Whatever the fix, Harvey and Irma have given the federal government a brief window to change its policy. “We can capitalize on this,” says Howard Kunreuther, a director of the Risk Management and Decision Processes Center at Wharton. “If you don’t take advantage after a disaster, you’re missing a critical opportunity.” —With Heather Perlberg, Joe Light, and Jeanna Smialek
BOTTOM LINE – The federal government has struggled for decades to enforce flood insurance requirements. Climate change is increasing the cost of that failure.
How a Disaster’s Economic Impacts Are Calculated
Providing an early estimate of a storm’s costs is generally a pretty rough science, and Harvey is a particularly tough case.
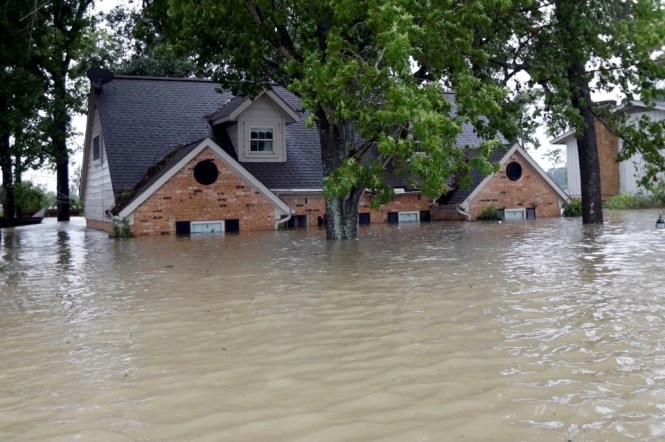
Floodwaters surround a home in Spring, Texas, after Harvey.David J. Phillip / AP
AUG 29, 2017
Tropical Storm Harvey had not stopped raining on Texas before the first estimates emerged as to how many billions of dollars in damages would result from the storm. Initial estimates from insurance companies like Hannover Re put the number at $3 billion. In a note to clients, JP Morgan estimated that the insurance industry could lose $10 to 20 billion from Harvey, making it one of the top 10 costliest hurricanes to hit the U.S. Enki Holdings, a consultancy that calculates the risks and costs of various natural disasters, said Monday afternoon that its estimates for Harvey damages had reached $30 billion. It’s likely, though, that none of these estimates will end up being accurate. “It’s a pretty tough business—you don’t really know what’s on the ground,” Tobias Geiger, a researcher from the Potsdam Institute for Climate Impact Research, told me, about forecasting the impact of disasters. “A good ballpark would be if you’re off by a factor of two.”
There are two different types of damages tallied from natural disasters: direct damages, which are caused by harm to physical structures like buildings and the belongings inside of them, and indirect damages, which are caused by people losing their incomes and jobs. Both direct and indirect damages are best tallied months or years after a storm has taken place because people have made insurance claims, and if they’re not insured, they know how much money they spent rebuilding. But dozens of companies try to predict damages earlier than that, both because it is useful for insurers to know what their potential costs may be, and because government officials may need to offer economic aid for residents.
Every company that predicts damages from disasters has a different method for doing so. Enki, for example, has a computer simulation that uses the laws of physics to estimate what the forces of nature such as wind, waves, and flood waters would do to the properties it is predicted to hit. The company comes up with the values of the properties in a storm’s path using data it has tabulated on what sits on parcels of land across the country. Risk Management Solutions (RMS), a catastrophic-risk-modeling company based in California, has constructed a hurricane model that simulates tens of thousands of potential hurricanes to advise the insurance industry on the likely impacts of Harvey. RMS can use wind speeds to calculate what percentage of the home may be damaged by the storm, said Tom Sabbatelli, a senior product manager with the company. Once it gets information from insurers on the how much particular properties are worth, RMS can estimate the cost of the damages based on those percentages.
These models are pretty accurate when accounting for the damage caused by wind speed and storm surges, which are typically the two factors that cause the most damage from a hurricane. But Harvey was not a typical hurricane. Rather than just hitting the coast and moving on, it crept inland and lingered, causing huge amounts of flooding in Houston and surrounding areas. Watson estimates that 30,000 square miles have seen over 10 inches of rain. Experimental flood models he’s run show that impacts from Harvey are four to five times higher than those of a typical hurricane. “If Harvey had been a normal Category 3 or 4 hurricane, we’d be talking about a $4 billion storm—from a national perspective, it would not have been a huge event,” he said. “The problem is that Harvey moved inland and turned into a big, wet, tropical storm.”
Economists are now trying to calculate how to factor in the flooding damage that Harvey is causing. But damage from flooding is much more difficult to model than damage from wind. While the general wind structure of a hurricane is well understood by scientists, flooding is more circumstantial. Small factors can easily aggravate flooding—a trash can could block a drainage ditch, for example, and flood a block of homes, while the drainage ditch in the next block worked as planned, Watson said. Wind damage also usually harms the outside of a structure, while flood damage is heavily dependent on what’s inside the structure too, which can vary from house to house, Sabatelli said. And while instruments on the ground can accurately measure how fast the wind is blowing during a storm, there are not enough instruments to determine a flood’s extent with great granularity, block to block or home to home. “There will always be uncertainty in flood estimates,” he said.
Still, there are two past storms that can be compared to Harvey when it comes to calculating the amount of damages—Hurricane Ike and Tropical Storm Allison. Ike in 2008 had lower wind speeds than Harvey, but had a high storm surge and a great deal of coastal flooding. It cost $30 billion, which is about $38.4 billion in today’s dollars, according to the National Oceanic and Atmospheric Administration (NOAA). Tropical Storm Allison, which dumped 30 to 40 inches of rainfall in Texas and Louisiana in 2001 and produced severe flooding in Houston, cost about $8.5 billion, which is about $11.9 billion in today’s dollars, according to NOAA. The amount of rain Allison dumped on Houston was catastrophic, but Harvey released as much rain in two and a half days as Allison did in five, Watson said. “It’s probably too early to tell, but my guess is there is going to be parts of Houston that will be uninhabitable for at least months,” said Tatyana Deryugina, a professor of finance at the University of Illinois who studies the economic impact of disasters.
The fact that Houston is the nation’s fourth-largest city will also push the damages up, simply because there were more people and properties in the storm’s path. It is a bigger city today than it was when Allison hit. The city of Houston had 2.3 million residents last year, an 18 percent jump from the population in the year 2000, according to Census data. As more people move to coastal regions, scientists predict that the costs of storms could continue to rise because more people and properties will lie in the path of big weather events.
In addition, economic forecasters have also discovered that each new storm can generate costs that had not been problematic in the past. Hurricane Sandy, for instance, caused tens of millions of dollars in additional damage because of the valuable equipment like servers and financial documents stored in basements of some of the buildings that were affected. The costs of things like road signs and guardrails often add up more quickly than most forecasters anticipate—Watson estimates the costs of replacing street signs and repairing road damage after Katrina reached $800 million.
Still, one bright spot might be that indirect damages from Harvey might not be particularly bad. In a 2014 study, Deryugina used tax-return data to track the long-term economic impact of Hurricane Katrina on its victims. She found that though Katrina uprooted many people from their homes, the storm did not harm their long-term economic prospects. Though incomes of the average Katrina victim were lower than that of counterparts in other cities the year after the storm, by 2008, the average hurricane victims had incomes that were higher than comparable people in other cities. “What we found is that people bounce back pretty quickly,” she told me. On the other hand, New Orleans was a city with declining economic opportunities when Katrina hit, which meant that people forced to relocate often found better opportunities when they moved, she said. Houston was booming economically before Harvey, and if people lose jobs in Houston because of the storm, they might have trouble finding better opportunities elsewhere.
Photographer: Craig Warga/Bloomberg
Homes Are Getting Snapped Up at the Fastest Pace in 30 Years
The typical U.S. home lasted just three weeks on the market, according to a new report.
By
Patrick Clark
October 30, 2017, 8:06 AM MDT
Here’s more evidence that the defining characteristic of the U.S. housing market is a shortage of inventory for sale: Homes are sitting on the market for the shortest time in 30 years, according to an annual report on homebuyers and sellers published today by the National Association of Realtors.
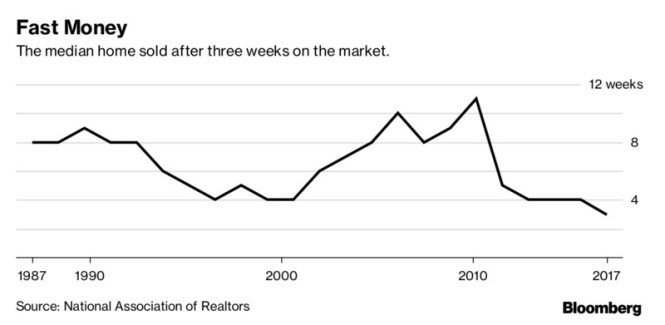
The typical home spent just three weeks on the market, according to the report, which focused on about 8,000 homebuyers who purchased their home in the year ending in June. That was down from four weeks in the year ending June 2016 and 11 weeks in 2012, when the U.S. housing market was still reeling from the foreclosure crisis. It was the shortest time since the NAR report began including data on how long homes spend on the market, in 1987.
Buyers are snapping up homes quickly at a time when for-sale listings are in short supply, forcing them to compete. The number of available properties declined in September, according to NAR’s monthly report on existing home sales, marking the 28th consecutive month of year-on-year decline in inventory.
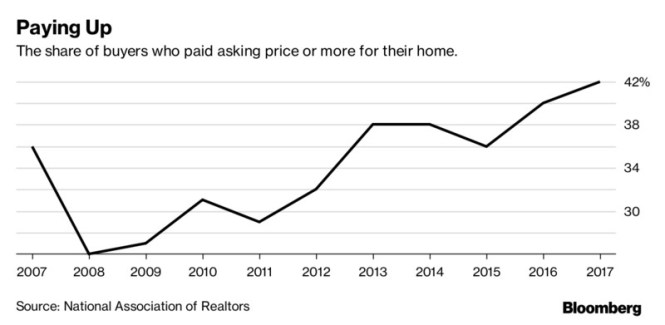
In addition to moving fast, buyers also had to pony up to close the deal. Forty-two percent of buyers paid at least the listing price, the highest share since the NAR survey started keeping track in 2007.
“With the lower end of the market seeing the worst of the supply crunch, house hunters faced mounting odds in finding their first home,” said Lawrence Yun, NAR chief economist, in a statement. “Multiple offers were a common occurrence, investors paying in cash had the upper hand, and prices kept climbing, which yanked homeownership out of reach for countless would-be buyers.”
