The Economist
This quarter we focus on many aspects of weaponizing trade. The impacts affect every country, and directly or indirectly, all aspects of global trade and industries. May the force be with us and the Donald elsewhere…
Southeast Asian Leaders to Meet in Shadow of Trump’s Trade War
By
June 20, 2019, 3:00 PM MDT
- U.S.-China tension throwing spanner into Asia’s export engines
- All heads of 10-member ASEAN due at weekend summit in Bangkok

Shipping containers sit stacked among gantry cranes at the Bangkok Port in Bangkok, Thailand.
Photographer: Brent Lewin/Bloomberg
Follow Bloomberg on LINE messenger for all the business news and analysis you need.
The leaders of Southeast Asia’s economies are set to gather in Thailand this weekend as the shadow of President Donald Trump’s trade war keeps the region on edge.
The summit of the Association of Southeast Asian Nations comes two weeks after Group of 20 finance ministers faced similar challenges: wobbling demand and bleeding business and investor sentiment as the U.S. and China feud. The weakening electronics cycle is particularly bad news for Asian exporters.
Aside from slowing growth, the 10-nation summit in Bangkok is expected to focus on sustainability, ways of knitting the region’s markets together and efforts to foster digital innovation without compromising privacy and security.
The 34th AESAN leaders’ summit is the first since Indonesian President Joko Widodo won re-election and Thailand’s Prayuth Chan-Ocha returned as premier this year. Midterms in the Philippines strengthened President Rodrigo Duterte’s grip on power.
Here’s a look at some top challenges AESAN will be tackling:
Quiet Factories
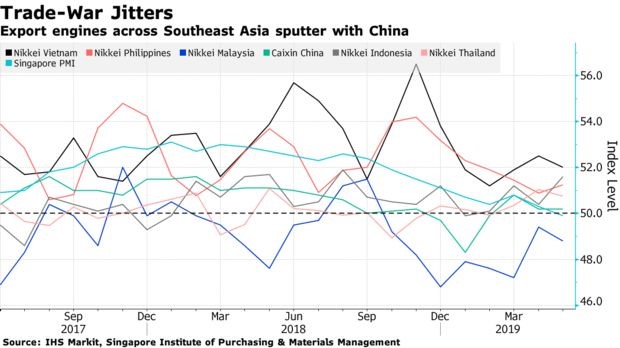
Another month, another slew of weak Asia purchasing manager index readings. While Indonesia and the Philippines saw production edge upward in May, much of ASEAN failed to improve, taking its cue from China. Sub-50 readings signal contraction. Singapore’s electronics PMI sub-index has been below that level for seven consecutive months.
Trade Dramas
Investors breathed a collective sigh of relief when the U.S. lifted a tariff threat on Mexico and Trump said he would meet Chinese President Xi Jinping in Japan. But some analysts continue to worry given Trump’s penchant for applying duties to help achieve his political goals.
![]()
https://www.bloomberg.com/graphics/global-trade-indicators/
ASEAN nations find themselves caught in the middle of the U.S.-China tussle. While China is the biggest trading partner for most of them, they also can’t afford to offend the U.S. Expect the eventual communique to avoid taking sides while promoting the need for cooperation.
Economic Growth

Standard Chartered sees Vietnam, Philippines, and Myanmar as part of an exclusive club that can achieve a critical 7% growth pace through the 2020s. But in the nearer term, they are being buffeted by global headwinds, and some Asia-Pacific central banks are already cutting interest rates.
Political Risk

Regional political risk climbed with elections and remains elevated in coup-prone Thailand, a Bloomberg gauge shows. Junta leader Prayuth was picked by lawmakers to return as premier after March’s disputed poll but has only a slim majority in the lower house.

The trade war is leading some firms to crimp investment
Much depends on whether hostilities between America and China intensify
“There’s tariffs on games and tariffs on toys—try explaining tariffs to your little boy. Santa’s workshop is struggling, you’ll find yourself saying. I think the reindeer are backed up with their sleighing.” Wendy Lazar, who runs a company called I Heart Guts, submitted this peeved poem to the United States Trade Representative (USTR) in June. As an importer of children’s toys from China, she was complaining about how the trade war could squeeze her firm.
She is not alone. In boardrooms across America, business people are scrambling to assess the impact of the latest escalation in the commercial confrontation between the two superpowers. For most firms the easy bit is calculating the immediate financial impact of more tariffs on demand, prices and costs. That can be done in a spreadsheet. Far harder is working out how to rejig your strategy and long-term investment plans to adapt to a new world of enduring trade tensions. Fund managers and Wall Street traders have begun to reach their own conclusion—that investment may slump, possibly triggering a recession. Hence the violent moves in markets since the first week of August, with a rush towards safe bonds and a sell-off in equities (see article).
That sell-off picked up pace on August 1st when President Donald Trump’s administration announced the imposition of tariffs on $300 billion of Chinese goods, at a rate of 10%, starting on September 1st. On August 13th the USTR announced a delay covering about two-thirds of the goods in question, including mobile phones, smartwatches and toys, which would be subject to duties starting on December 15th. As Mr Trump explained later that day, the move would allow American shoppers to splurge in the run-up to Christmas. The press release announcing the delay arrived at 9.43am; between 9.40 and 9.45 shares in Apple rose by 3%, and the S&P 500 share index jumped by 1%. But by the following day the stock market—and the iPhone-maker’s share price—slumped again as investors fretted that a global downturn might soon be on the cards.
America’s expansion may be cooling as it enters its second decade, but the US GDP still grew at a respectable pace of 2.1% in the second quarter of 2019, and the unemployment rate is a brag-worthy 3.7%. The direct effect of the tariffs should be small: in 2017, before hostilities began, goods trade with China amounted to just 3.2% of GDP. Even including the additional levies planned for December, they represent a tax rise offsetting only a fifth of the cuts introduced by the Tax Cuts and Jobs Act of 2017.
What really matters, though, is the wider effects of the uncertainty created by the trade war on corporate behavior. Most companies make plans over a five- to ten-year horizon and invest in assets with a life of 10-20 years. But with each new tariff announcement, the rules for trading their products become less stable. And the scope of the trade war has expanded beyond goods to technology and currencies. Perhaps the international banking system, shipping companies or foreign joint ventures could be next. The most sophisticated firms try to gauge such risks.
The high level of uncertainty is measurable. A study from 2016 by Scott Baker of Northwestern University, Nick Bloom of Stanford University and Steven Davis of the University of Chicago quantified policy uncertainty in America using newspaper reports. Their index of trade-policy uncertainty has soared in recent months (see chart). And such increases in uncertainty tend to have real effects. The researchers found that increases in their index were associated with dampened investment and slower hiring. More recently, Ryan Sweet of Moody’s Analytics, a financial firm, finds that changes in business confidence and economic-policy uncertainty appear to predict changes in managers’ capital spending.

Given all this, how is investment in America holding up? In the second quarter non-residential business investment shrank at an annualized rate of 0.6%. The question is to what extent the trade war is the culprit, rather than industry-specific factors, domestic economic trends or the global manufacturing cycle. To get a sense of this The Economist has analysed around 2,400 listed American companies in 42 sectors, considering both their investment levels and how dependent their sector is on Chinese inputs.
Firms with a higher degree of Sino-reliance do seem to have scaled back investment. The 20 sectors most exposed to inputs from China accounted for a third of total investment by the 2,400 firms. In total these sectors saw aggregate capital spending drop by 1% in the past four quarters compared with the prior year. Meanwhile the other 22 sectors, which are less exposed to China, saw investment rise by 14%. The analysis is simple: other factors may well have played a role.
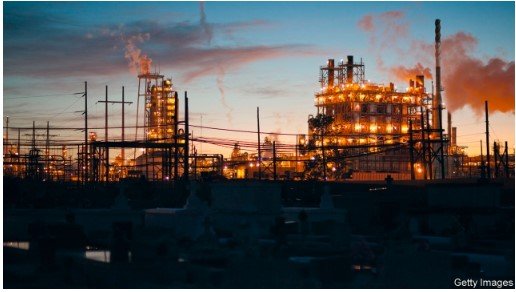
But business executives too report an effect on investment. A survey compiled by the Federal Reserve Bank of Atlanta in January found that trade tensions had crimped investment by 1.2%. Tariffs were mentioned in a quarter of all earnings calls among companies in the S&P 500 index in the second quarter of 2019, according to figures from FactSet, a data-analytics firm. One of the sectors most exposed to China is chemicals. In July Jim Fitterling, chief executive of Dow, a big producer, told investors on an earnings call that he would keep capital spending “tight” until he got “better visibility”, adding that he thought a trade deal was needed to “get some confidence back in this market”.
Wall Street economists are also crunching data on how trade-policy uncertainty is altering companies’ behaviour. In June researchers at Goldman Sachs had been skeptical that the trade war was hampering investment, pointing out that overall policy uncertainty was low. But more recently they have altered their view, finding that, after adjusting for underlying trends, sectors that sell more to China (rather than those that buy from it) were seeing slower investment growth than those that were less exposed.
Goldman’s economists also found that tariff announcements were associated with worsening financial conditions (higher borrowing costs, lower equity prices or a stronger dollar). Expectations of interest-rate cuts by the Federal Reserve have only offset half of the shift in financial conditions. Overall the analysts reckon that, including indirect effects, the hit to GDP would be 0.6%—material, but not enough to tip America into recession.
The overall picture, therefore, is that there is now good evidence that the trade war is leading some firms to crimp investment. Pessimists worry that the knock-on effect from this capital-spending stumble could be far-reaching and more painful than the likes of Goldman expect. In the long run it could sap productivity. In the short run it could cause firms to scale back hiring. That could then damage consumers’ confidence.
Much depends on whether hostilities between America and China intensify. On August 13th Mr Trump said that he had a “very, very productive call” with China’s leaders. But few on the ground take seriously the prospect of a lasting reconciliation. Jake Parker of the us-China Business Council, a lobby group, reports that his members have realized that the threat of future levies would still lurk even if a deal were struck and tariffs lifted. Blows to China’s economy could also spill back to America.
And Mr Trump has plenty more ways of injecting fear into the economy. He must decide whether to reinstate onerous restrictions on American companies that do business with Huawei, a Chinese telecommunications giant, by August 19th. His labeling of China as a currency manipulator could ignite a currency war. If the sickness that is now visible in most trade-exposed sectors spills over to the rest of the economy, that would set off a downward spiral that not even lifting tariffs, and allowing in Ms Lazar’s stuffed toys, would reverse.
Economics
China No Match for Japan in Southeast Asia Infrastructure Race
By
June 22, 2019, 6:00 PM MDT
Japan has pending infrastructure projects worth $367 billion
Vietnam is major focus of Japan’s investment in region infrastructure
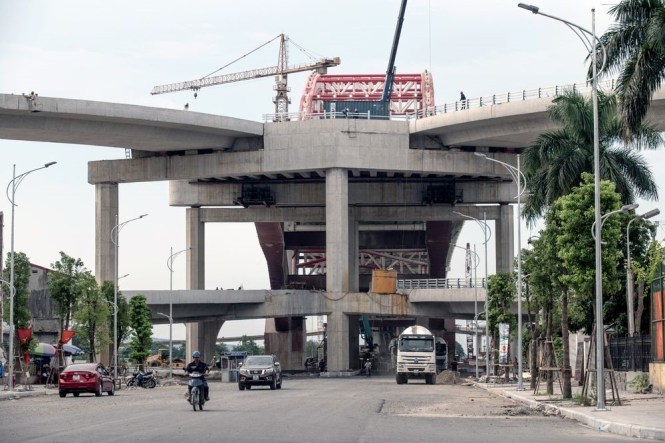
A bridge stands under construction in Vietnam.
Photographer: Yen Duong/Bloomberg
Japan is still winning the Southeast Asia infrastructure race against China, with pending projects worth almost one and a half times its rival, according to the latest data from Fitch Solutions.
Japanese-backed projects in the region’s six biggest economies — Indonesia, Malaysia, Philippines, Singapore, Thailand, and Vietnam — are valued at $367 billion, the figures show. China’s tally is $255 billion.
Building Battles
Japan far outpaces China in value of infrastructure projects in Southeast Asia
Source: Fitch Solutions (data provided 18 June 2019)

The figures underline both the rampant need for infrastructure development in Southeast Asia, as well as Japan’s dominance over China, despite President Xi Jinping’s push to spend on railways and ports via his signature Belt and Road Initiative. The Asian Development Bank has estimated that Southeast Asia’s economies will need $210 billion a year in infrastructure investment from 2016 to 2030, just to keep up the momentum in economic growth.
The latest Fitch figures, provided in an emailed response to Bloomberg, count only pending projects — those at the stages of planning, feasibility study, tender and currently under construction. Fitch data in February 2018 put Japan’s investment at $230 billion and China’s at $155 billion.
Vietnam is by far the biggest focus for Japan’s infrastructure involvement, with pending projects worth $209 billion — more than half of Japan’s total. That includes a $58.7 billion high-speed railway between Hanoi and Ho Chi Minh City in Vietnam.
For China, Indonesia is the primary customer, making up $93 billion, or 36%, of its overall. The prized project there is the Kayan River hydro power plant, valued at $17.8 billion.
Across all of Southeast Asia and by number of projects, Japan also carries the day, though by a smaller margin: 240 infrastructure ventures have Japanese backing, versus 210 for China in all 10 Southeast Asian economies.
Breaking Ground
Across Southeast Asia, Japan’s infrastructure projects overtake China’s

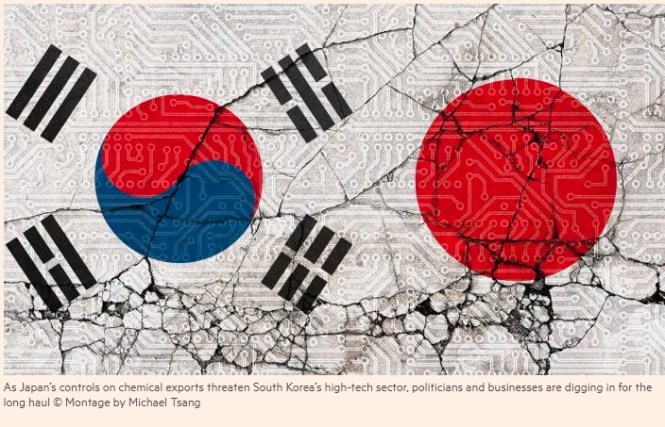
Inside the lose-lose trade fight between Japan and South Korea
Samsung’s chip business faces ‘burdens’ from Tokyo’s new export controls
Mitsuru Obe and Kim Jaewon, Nikkei staff writers
AUGUST 4, 2019
The move, which took place on the day that campaigning kicked off for Japan’s upper house elections, launched a bitter trade dispute between Japan and South Korea that has worrying implications not just for their domestic economies, but also for a global trading system already roiled by US-China tensions. Financial analysts have warned that the global supply chain for tech equipment also could be disrupted.
Samsung Electronics, South Korea’s biggest company, is already feeling the heat, as are major chip makers such as SK Hynix. “It is one of the worst situations we have ever had,” said a senior Samsung official, who asked not to be named. “Politicians take no responsibility for the mess, even though it has almost killed us.”
Lee Jae-yong, Samsung’s vice-chairman, visited Japan in July hoping to receive assurances that supplies would continue to flow unabated. But when he returned to Seoul, Samsung sent a letter to local vendors asking them to stockpile three months’ worth of the Japanese chemicals. Meanwhile, South Korean companies are scrambling to find other sources of the materials.
Samsung acknowledged the challenges as it reported its financial results on July 31. “We are facing difficulties due to the burden of this new export approval process, and the uncertainties that this new process would bring,” vice-president Lee Myung-Jin said during a call to discuss its second-quarter earnings. “The visibility is low.”
It is one of the worst situations we have ever had. Politicians take no responsibility for the mess, even though it has almost killed us -A senior Samsung official
The Abe administration turn up the heat on August 2 by formally stripping Seoul of its “white list” status, meaning Japanese companies will need government approval before exporting sensitive materials to South Korea.
White list status, a symbol of mutual trust between governments, has allowed Seoul to join 26 other countries that are exempt from such scrutiny. Most of the machinery and components South Korea uses for its auto and semiconductor production is believed to fall under this category.
Washington has sought to ease tensions between Japan and South Korea, two of its biggest allies in Asia. According to a report by Reuters on July 30, a senior US official has urged Tokyo and Seoul to sign a “standstill agreement” that would prevent further escalation of the dispute to allow talks to take place. But Yoshihide Suga, Japan’s chief cabinet secretary, denied the report, saying “there is no such thing”.
Tokyo’s heavy-handed approach is widely believed to have been sparked by its concern over a Supreme Court decision in South Korea last October, which awarded four wartime laborers at Japan’s Nippon Steel Won 100 million (about $85,000) each in reparations. The ruling was seen as a direct challenge to the diplomatic understanding that all such claims were settled “completely and finally” under a 1965 treaty that established diplomatic relations between the two countries.

The concern in Japan is that the verdict could open the floodgates for other victims and their relatives, totaling more than 220,000, to file lawsuits against an estimated 300 Japanese companies accused of using forced labour during the colonial era. The potential reparations could swell to $20 billion or more.
A South Korean court in January approved the expropriation of some of Nippon Steel’s equity holdings in PNR (Pentair plc), a joint recycling venture with South Korean steelmaker Posco, to fund payments to the plaintiffs, prompting fears that other Japanese assets could be seized in the future.
“The Japanese government won’t just watch South Korea seize Japanese assets,” said Hajime Izumi, a professor of international relations at Tokyo International University, adding that further asset seizures by South Korea would be met by even tougher measures by Japan. “Japan would demand a return of any seized assets, no matter how long it takes, [whether] 100 years or 1,000 years.”
Karl Friedhoff, fellow in public opinion and Asia policy at the Chicago Council on Global Affairs, is concerned that the dispute may drag on, harming both economies.
“The only way that this reaches some sort of short-term truce is if the Korean courts decide not to liquidate the seized assets of Japanese companies as reparations for Korean forced laborers, and Japan removes its export curbs,” Mr Friedhoff said.
“But that liquidation is going to take place, and when it does the genie will be well and truly out of the bottle. Japan will retaliate and both sides will then settle in for an extended battle which will make them both losers.”
‘Weaponizing trade’ South Korea has taken the dispute to the World Trade Organization, where its representatives argued that the curbs constitute unfair retaliation for the court rulings. This, they say, runs counter to the principle of free and fair trade. “South Korea is the top exporter of semiconductors. Japan’s measures will harm third countries,” warned Kim Seung-ho, deputy minister for multilateral and legal affairs at South Korea’s ministry of trade, industry and energy.
But Japan claims that its move was unrelated to the wartime labour issue and was made on national security grounds, though it has offered little specific information publicly to back up this claim.
Japan’s use of national security grounds to justify the export controls has worried some trade experts. Governments have historically been reluctant to cite national security in trade cases, but US president Donald Trump has made something of a habit of it — opening the door for others to follow. In 2018, the Trump administration cited national security when it slapped tariffs on steel and aluminium imports from US allies Japan, Canada, Mexico and the European Union. More recently, his administration used the same label to describe cars from Europe and Japan, and equipment made by Chinese telecoms company Huawei Technologies.

While Mr Trump is a protectionist, Mr Abe has wrapped himself in the cause of free trade. He championed the Trans-Pacific Partnership after the US pulled out of the trade agreement and has sought new rules for promoting cross-border data flows. But his administration’s use of the national security argument may undermine those credentials.
“Japan is the latest country to mix trade with politics, following the US and China,” said Peter Kim, global strategist at Mirae Asset Daewoo in Seoul. “Very much like the ‘Entity List’ from the US aimed at China, the measure is a continuing global trend of weaponizing trade at the expense of multilateral agreements and transparency.”
A Japanese government official says preparations to impose the curbs began early this year, as tensions between Japan and South Korea were escalating over the reparations court ruling. Mr Abe’s office instructed the ministry of foreign affairs, the ministry of economy, trade and industry and other government ministries to propose ways to apply pressure to South Korean president Moon Jae-in.
In the end, his office adopted a proposal from the METI (Maritime Environmental Training Institute) to tighten export controls on the three materials — hydrogen fluoride, fluorinated polyimide and photoresist.
“While Japan has a staff of 120 for screening and inquiring, South Korea has only 11 in charge,” said Rui Matsukawa, a member of the Japanese upper house, speaking in a personal capacity to reporters on July 24. In addition, there are other loopholes in South Korea’s export controls, the ruling party lawmaker said.
A South Korean government official refuted this, saying the country has 110 officials in three ministries and two state-run institutions who are dealing with approval and examination of strategic materials’ export.

Of the three chemicals subjected to Japan’s export restraints, hydrogen fluoride is the most sensitive. Not only is it used to produce semiconductors, but also in the enrichment of uranium and production of the lethal gas Sarin. Concerns have grown in Japan about roundabout exports of Japanese-made hydrogen fluoride to North Korea via South Korea, but a METI official denied this speculation.
Given the sensitivity around hydrogen fluoride, it is likely that questions about exports to South Korea would have been raised whether the question of wartime labour came to the fore or not, insiders say.
‘Fight and win’
The trade tensions come as both South Korea and Japan are facing slowdowns in their economies. Neither side wants new headwinds, given the challenge of the trade war and the deceleration of the Chinese economy. But it appears they are also determined to teach each other a lesson.

This is a far cry from the relationship envisaged by the two countries’ business leaders: a pair of US allies forming an integrated market of 180 million people that can compete against China.
“The 21st century is said to be the Asian century, but which country will be leading the world?” asked Nobuya Takasugi, a counselor at the Asia-Eurasia Institute who was a business executive in South Korea for 19 years. “Is it OK to allow China to become the leader? Should Japan and South Korea not work together and take leadership?”
South Korea provides highly educated, international talent for Japan, which faces a labour force shortage amid an ageing and shrinking population. Samsung symbolizes South Korean industrial strength in designing the Galaxy, a smartphone that stands head-to-head against Apple’s iPhone. But it depends on Japan for technology and components to bring such products to market.

The tit-for-tat economic reprisals are not benefiting anyone — and may hurt the Japanese suppliers of the three chemicals, who will see increased competition if the Moon administration’s plans to jump-start domestic production are successful. The chemical exports are estimated to be worth about $500 million a year, a relatively small market that Tokyo may be willing to sacrifice for Japan Inc. But the business community is not happy.
“No industry wants to see its fate depend on a government policy,” said Sota Kato, research director at the Tokyo Foundation for Policy Research and a former senior official at the METI. “The Japanese semiconductor industry doesn’t have its own lobbying organisation because the Japanese government never previously resorted to a trade war; but if it does, then the industry needs a way to protect its interests.”
He was referring to an open letter issued by the largest US tech industry groups on July 24, pressuring Tokyo and Seoul for a negotiated solution to the dispute. Japan has economy-wide groups like Japan Business Federation, known as Keidanren, but lacks an industry group that actively lobbies the government.

However, some in Japan’s chip equipment industry downplayed the impact of the trade spat. Even if South Korea loses “white country” status, it would simply be on the same footing as China, Taiwan and Singapore, said Ken Sasagawa, vice-president of accounting at Tokyo Electron, a major chip making machinery supplier to Samsung Electronics and SK Hynix. “We have been able to deliver a substantial quantity of machines to these countries in a timely and precise fashion,” he told reporters on July 26.
The restrictions may be hurting South Korea’s economy already. Bank of Korea governor Lee Ju-yeol cited Japan’s export restrictions as a factor behind the central bank’s decision to cut its growth forecast to 2.2 per cent from an earlier projection of 2.5 per cent.
“If export restrictions are realised and expanded, we cannot say that its impact on exports and the economy is small,” Mr Lee said on July 18. “It is not desirable that it expands and worsens. It needs to be resolved.”

But South Korea’s politicians are encouraging the anti-Japan sentiment, betting it will help boost their popularity ahead of general elections next year. Cho Kuk, a high-ranking official in the Moon administration, leads the trend.
“Japan’s state power is apparently stronger than that of South Korea,” Mr Cho said in a Facebook post. “But let’s not be afraid of this. South Korea’s state power has grown up to the level that cannot be compared to 1965 when the South Korea-Japan treaty was signed.”
He said diplomacy was the best option for ending the battle. “But, if we cannot avoid [a] legal and diplomatic battle, we should fight and win,” he said.
The ruling Democratic Party of Korea set up a committee to deal with the matter, titled “The Special Committee on Japan’s Economic Invasion”, criticizing Tokyo for using a “suicide bombing” strategy that hurts its own economy.
Such rhetoric suggests that politicians in both countries are unlikely to back down any time soon. “I can’t foresee a short-term resolution to this. It’s clear that both sides made miscalculations in letting this get to this point but are now so invested that backing away is going to be politically damaging,” says Mr Friedhoff.
Contributing writer Steven Borowiec in Seoul and Nikkei Asian Review columnist Yasu Ota and Nikkei Asian Review chief business news correspondent Kenji Kawase in Tokyo contributed to this report.
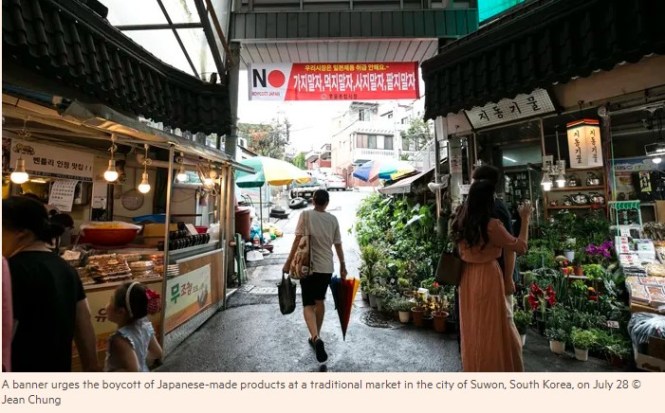
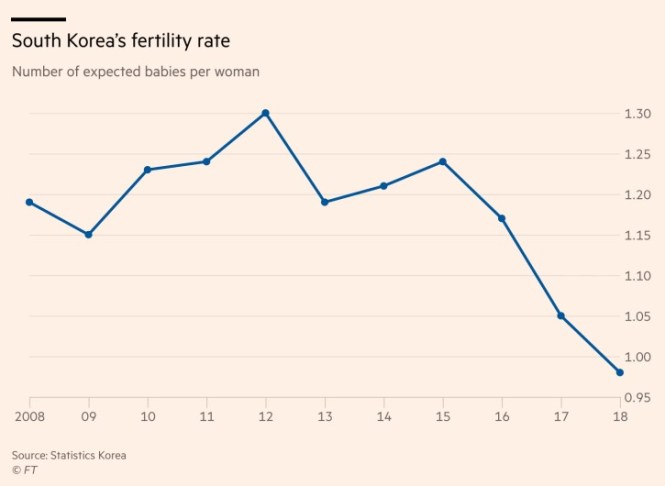
South Korea’s birth rate falls to new developed world low Fertility rate well below neighbours such as Japan despite campaign for more babies South Korea’s fertility rate — the number of expected babies per woman — fell from 1.05 in 2017 to 0.98 in 2018

Song Jung-a in Seoul AUGUST 28, 2019
South Korea may be known for its high levels of productivity when it comes to manufacturing televisions, smartphones and ships but there is one crucial area in which the country is struggling to keep up with its competitors: babies.
South Korea’s birth rate, already the lowest in the developed world, has fallen to a new low on factors such as the high cost of private education despite various government initiatives to prop it up, raising concerns about the country’s bleak demographic outlook.
The country’s fertility rate — the number of expected babies per woman — fell to 0.98 in 2018, according to the latest government data released on Wednesday. It was already the lowest at 1.05 in 2017 among members of the OECD, far lower than Israel, which was the highest in the organisation with 3.11 expected babies in 2017, the US at 1.77 and Japan’s 1.43.
The replacement level — the total fertility rate for developed countries needed to keep the population constant — is 2.1.
Given it’s falling birth rate, Asia’s fourth-largest economy is expected to grow older more quickly over the next four decades than any other country, including Japan and China, despite the latter’s former one-child policy.
“This is really bad news for our long-term growth outlook. The lower birth rate shows how pessimistic people are about our future economy,” said Park Chong-hoon, an economist at Standard Chartered. “There is no short-term fix for this problem, which is linked to [the high cost of] education, welfare and property issues.”
Concerned about the impact of a falling birth rate on productivity and fiscal stability, the government has spent billions of dollars to fund free nurseries and the provision of public day care services. South Korean parents have the right to one year of subsidized childcare leave and access to government-trained babysitters. The Seoul city government last year introduced cash incentives of Won 100,000 ($82) per childbirth.
Yet the number of South Korean babies being born has continued to fall, dropping 8.7 per cent last year compared with 2017, following declines of 11.9 per cent and 7.3 per cent in the two previous years.

Many South Koreans seem reluctant to have more than one child because of the steep cost of private tuition, considered essential in the education-obsessed country. This consumes a 10th of household income, according to government data. About three quarters of high school students receive private tuition and a similar proportion of those go on to university.
“One child seems enough for me, given the expected cost. The government incentives and subsidies do not help much,” said Lee Jung-woo, a newly wed 36-year-old resident of Seoul, who is expecting a baby in November.
Baek Da-som, a mother who had to quit her job recently at a big construction company to take care of her one-year-old daughter, said she did not plan to have another child. “It is all about welfare. It is difficult to raise a child without enough state support,” she said.
Policymakers are also concerned about the country’s falling potential growth rate due to ageing, with South Korea now having more economically active people aged over 60 than in their twenties.
Despite growing concerns about the looming labour shortages, South Korea maintains a strict immigration policy, not allowing foreign workers to migrate with their families or apply for South Korean citizenship in most cases.
Experts predict the country’s demographic problem will worsen in the coming years. “The birth rate keeps falling for various reasons such as later marriages, high education and housing costs, high youth unemployment, just to name a few,” said Lee Sang-jae, an economist at Eugene Investment & Securities. “There are limits to what the government can do to reverse the trend.”
Taiwan Set to Top Other Asian Tigers With Fastest Growth in 2019
By Chinmei Sung and Samson Ellis
August 16, 2019, 3:11 AM MDT
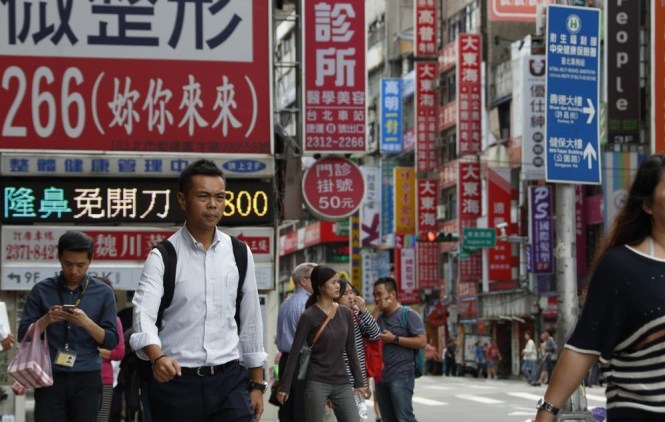
Taipei, Taiwan. Photographer: Tomohiro Ohsumi/Bloomberg
Terms of Trade is a daily newsletter that untangles a world embroiled in trade wars.
Taiwan projects its economy to top all of the other three Asian tiger economies this year, with full-year growth seen at just under 2.5%, according to a government estimate published Friday.
Benefiting from business activity repatriating from China amid the trade war with the U.S., Taiwan’s economy is outperforming South Korea, Singapore and protest-hit Hong Kong, which have all trimmed forecasts in recent weeks.

The government points to its program to lure Taiwanese companies with production facilities in China to invest at home as the main reason for economic resilience. Around 100 companies have applied to invest close to NT$500 billion ($15.9 billion), creating more than 43,000 jobs, since the program began at the beginning of the year, according to the Ministry of Economic Affairs.
Michelle Lam, greater China economist at Societe Generale SA in Hong Kong, said the trade war had also bolstered investment and manufacturing in Taiwan by persuading U.S. customers to switch their orders from China to Taiwan.
“Hong Kong and South Korea both have their own problems affecting domestic demand and trade,” she said. “And Singapore’s main drivers of growth, energy and financial services, are both feeling the effects of the trade war.”
Taiwan also projected growth to accelerate further to 2.58% in 2020 in Friday’s announcement. While exports are projected to fall 1.24% this year, the bureau sees them rebounding to 3.58% in 2020.
Officials also confirmed second-quarter growth came in at 2.4%.

Australia Is Finally Debating QE, Even If Its Central Bank Isn’t
By
June 23, 2019, 8:00 AM MDT
RBA only likely to use unorthodox policies to combat recession
Australia’s floating exchange rate an important shock absorber
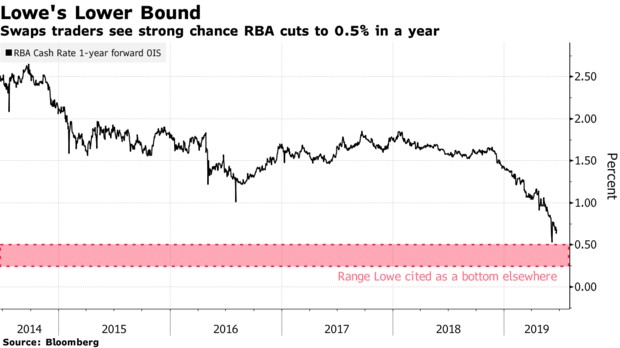
The prospect of interest rates going below 1% has prompted Australia’s economists to start exploring what much of the developed world has already contended with: the introduction of unconventional monetary policy.
While the Reserve Bank is unlikely to embark on quantitative easing for now simply to accelerate inflation and support hiring, a consensus is forming about when it would. Should a serious shock occur — most likely from offshore and probably China — that drives up the jobless rate and threatens recession, the central bank will then need to look elsewhere for ammunition.
“If the global outlook worsens sharply from the trade war, we see the RBA feeling the need to get ahead of a potential slowing in the global economy and provide additional stimulus,” said Hayden Dimes, an economist at Australia & New Zealand Banking Group Ltd. “With the cash rate rapidly closing on its likely lower bound, this would almost inevitably need to be quantitative easing.”
Voracious demand from China for resources helped Australia motor through the 2009 global recession, with the cash rate only dropping to 3% before the RBA started tightening toward the end of that year. Australia’s escape from contraction and avoidance of the lower bound allowed policy makers to study how unorthodox policy played out globally — from bond buying to negative rates to forward guidance — and draw conclusions on how to apply it.
Governor Philip Lowe has said he doesn’t regard QE as a serious option in the central bank’s current easing cycle. When reiterating last week that rates were likely to head lower again, after the RBA cut to 1.25% earlier in June, he said policy was unlikely to follow the path of overseas peers because the central scenario for Australia’s economy was still “quite reasonable.”
“I am very hopeful that we will not need to go, certainly into negative territory, or to these very low interest rates that the Federal Reserve and the Bank of Canada got to,” Lowe said in a Q&A session following a speech in Adelaide, citing those central banks’ 0.25-0.5% rates in the past.
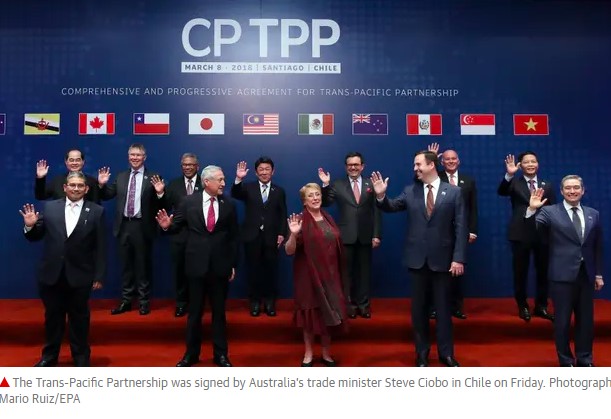
Australia, Japan: Tokyo Seeks to Adjust CPTPP Safeguard Provisions Amid U.S. Trade Deal
What Happened: Japan is pushing for an adjustment of the Comprehensive and Progressive Agreement for Trans-Pacific Partnership (CPTPP) safeguard provisions to take into account increased beef imports from the United States as both countries are expected to sign a trade deal in late September, the Nikkei Asian Review reported Aug. 27. However, Australia, the leading CPTPP beef exporter, has already rejected including U.S. beef as part of the quota.
Why It Matters: Japan fears that an influx of cheap beef imports from Australia and the United States would overwhelm its domestic market and harm its farming industry. However, Tokyo will be required to walk a careful line between its commitments under the CPTPP, the terms of its U.S. trade deal and the risk of threatened U.S. auto tariffs.
Background: Japan imports 55 percent of its beef from Australia and over 34 percent from the United States, making Japan the third-largest markets for U.S. beef exports. Australian beef exports to Japan have risen substantially since the signing of the CPTPP due to lower tariffs, while the United States is seeking to increase its agricultural exports to Japan through a bilateral trade deal.
Read More:
- U.S., Japan: A Trade Deal Offers Welcome Relief for U.S. Corn and Wheat Producers (Aug. 26, 2019)
- Japan’s Prime Minister Is Saving His Most Ambitious Plans for Last (June 15, 2019)
- Agriculture Is Still Vital to U.S. Trade Talks — For Now (May 2, 2019)

RBA No. 2 Guy Debelle has already painted a picture of how QE might look in Australia, in a December speech marking a decade since the global financial crisis. He also defended its use in extreme circumstances during the central bank’s semi-annual testimony before lawmakers in February. Based on his comments, the following lessons apply:
- There are less government bonds in Australia, which may make QE more effective because the bank wouldn’t need to buy as many bonds to bring down yields. However, most of the traction in borrowing rates Down Under is at the short end of the curve, which might reduce the effectiveness of QE because in other markets it has been designed to bring down yields on longer-dated securities
- The RBA’s balance sheet can also expand to help reduce upward pressure on funding, as occurred in 2008 when it provided cheap funding to banks. The U.S. experience suggests the RBA would need to buy securities equivalent to 1.5% of GDP to achieve the same effect as a 25 basis-point rate cut, according to Stephen Kirchner, an economist at the United States Studies Centre in Sydney
- The floating exchange rate remains an important shock absorber
Veteran economist Saul Eslake, who studied the options for QE several years ago, reckons the floating currency is Australia’s key advantage. Policies that lead to a lower local dollar would be the best option because Australia isn’t a globally significant exporter of manufactured goods, and so efforts to encourage a depreciation shouldn’t draw the level of opposition that others would, he says.
QE could work if implemented decisively and in an unlimited commitment, says Kirchner. He argues Australia could implement a smaller but more effective program than the Federal Reserve, which bought assets equivalent to 29% of GDP in the five years through 2014, his research shows.
“If necessary, the RBA should transition quickly from a cash rate target to large and open-ended purchases of government bonds,” as well as non-government and non-debt securities, Kirchner said in a report last week. “These purchases should be tied to achieving explicit macroeconomic objectives, in particular, maintaining the stability of nominal spending.”
The view from the continent, where the European Central Bank and Bank of England have run unorthodox policies, is that Australia’s challenges are very different to those institutions, according to Bill Evans, chief economist at Westpac Banking Corp., after speaking with bankers there. There are always unintended consequences and costs, he cited them as saying.
“Such a policy should only be adopted when a credit crisis has emerged,” Evans said. “It should not be adopted as a form of stimulus,” particularly when that mainly involves trying to push unemployment down to a level that fuels faster inflation.
— With assistance by Garfield Clinton Reynolds
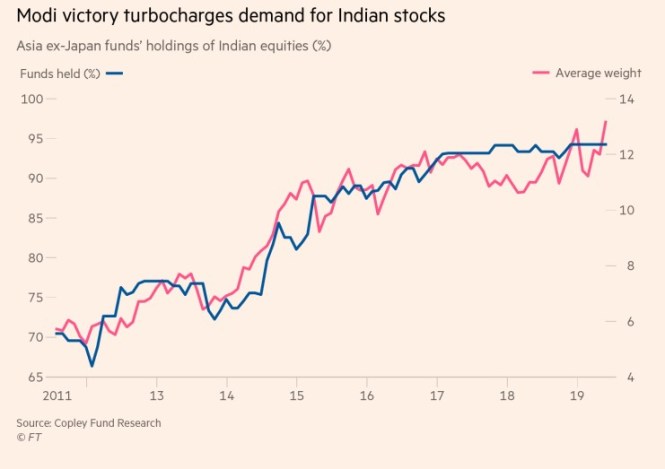
Modi victory leads to surge of money into India stocks
Financials have drawn the most interest, with the average fund having a 5.4% exposure

Steve Johnson JULY 9, 2019
Narendra Modi’s re-election as prime minister of India has seen a wave of foreign money flow into the country’s stock market, extending a multiyear rally for the Sensex. Equity funds targeting Asia, excluding Japan, had 13.2 per cent of their assets in India at the end of May, the highest level on record and a big leap from 5.2 per cent at the end of 2011, according to analysis of 120 funds with assets of $70 billion by Copley Fund Research. Average holdings jumped 1.2 percentage points in May alone as Mr Modi triumphed and ignited hopes of further reforms. A typical fund is now overweight the Indian market by 2 percentage points, twice the level of Indonesia, the next most favored country in emerging Asia, with 65 per cent of funds having above-market exposure. Before Mr Modi’s first election victory in 2014, overseas funds had for years held India at below-index weight. Financials have been the most attractive sector, with the average fund having a 5.4 per cent exposure to stocks such as HDFC Bank, Housing Development Finance Corporation, ICICI Bank, IndusInd Bank and Axis Bank, twice as much as in early 2016.
The buying spree has coincided with a crisis in India’s shadow banking sector following a default by one of the country’s largest non-bank financial companies and a sharp rise in bad loans at India’s public sector banks. Together with economic growth slowing to a five-year low of 6.8 per cent, this prompted a market sell-off. Eric Moffett, manager of the T Rowe Price Asian Opportunities fund that has led the charge into India, said a “credit heart attack” had sent some stocks plummeting after the freeze in the real estate market. These included non-bank financial companies with no real estate exposure.

“While the overall market always screens expensive versus the rest of Asia, part of the financial sector had become downright cheap, with opportunities to buy companies with double-digit returns on equity at just over price-to-book,” Mr Moffett said. The election result was the “best case” outcome, he added. Moreover, interest rates were falling, oil prices remained in check and the fact that India was still “somewhat disconnected” from global trade made it a beneficiary of some of the deglobalization trends due to the breakdown in the US-China trade talks.
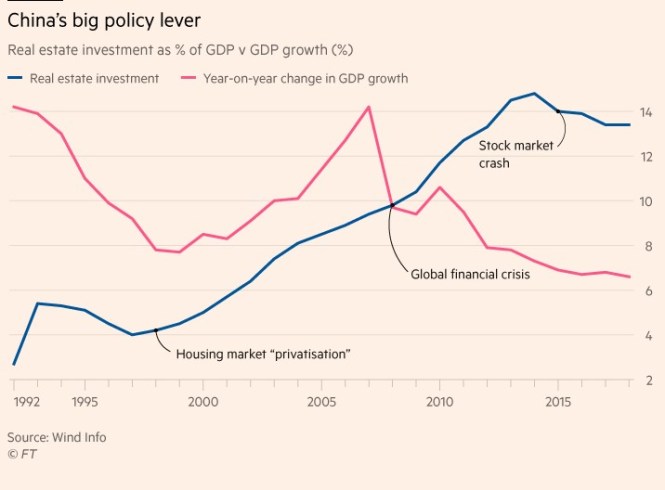
Can China beat its addiction to real estate?
Housing stimulus has been ruled out but economy will struggle with withdrawal symptoms

AUGUST 5, 2019
By explicitly denying last week that the real estate market will be used to stimulate the economy, the Chinese government is seeking to break with past practice and make good on its commitment to focus on the quality, rather than the quantity, of growth.
That will either prove to be a watershed moment in the history of modern Chinese economic policy making, or just another failed pledge from a Communist party that has run out of ideas about how to manage a structural growth slowdown.
If the party is to be taken at its word then this is a very big deal — the housing market (and its ancillary industries) is the biggest driver of Chinese economic activity, playing a decisive role in investment and financial market behaviour, and in supporting consumer sentiment.
This commitment looks doubly ambitious against a backdrop of deepening economic tension with the US.
Financial repression, an under-developed asset market and strict capital controls have meant there has always been pent-up demand to buy property in China, which is why the market has been the government’s policy go-to whenever the economy has run into trouble over the past decade — during the global financial crisis, when growth flagged in 2012 and following the stock market collapse of 2015.
Although the economy is now slowing towards the lower bound of this year’s targeted range, the Communist party said after a half-yearly review meeting last week it would “not use real estate as short-term economic stimulus”, dousing market speculation that the swath of restrictions introduced starting at the end of 2016 would be lifted.
Signs of relaxation are already giving way to a more constrictive stance. The day after the politburo meeting, the People’s Bank of China ordered banks to “reasonably control” their lending to the property sector. The flow of trust loans to developers is again being crimped — trust loans fell 23 per cent in July after rising 26 per cent the previous month — while restrictions have been imposed on the sale of bonds by developers in overseas markets.

The leash on cash-strapped local governments is also being shortened. Kaifeng, a city of 5m in central Henan province, last month withdrew plans to relax its housing market restrictions after just one day after Beijing stepped in. Dalian recently introduced price controls to keep a lid on prices.
The pains of withdrawal
The arguments against relying on the property sector to boost growth are easily made. Real estate is one of the main drivers of financial risk — which the leadership elevated to a national security threat in 2017 — and ever-increasing house prices exacerbate affordability problems which sow widespread discontent among young urbanites.
But the government, which is still tied to meeting growth targets, will struggle to break its bricks-and-mortar habit because of the market’s systemic importance. The strains of a slowing market are set to become more pronounced as weakening new housing starts pass through to construction activity later this year, while tighter funding conditions among smaller developers will compound the weakness.

Reduced construction activity could ripple out across the system because local governments are so reliant on land sales, which account for as much as 38 per cent of their fiscal intake. A strong end of quarter helped land sales revenue complete a difficult first half of the year, down just 0.8 per cent, but could resume falling in the second. R&F Group, one of China’s biggest developers, intends to stop buying land in the second half and focus on sales.

Financial pressures on developers also risk more breakages in a financial system that is already struggling to cope with the introduction of counterpart risk. Nearly 300 small developers have gone bankrupt so far this year, while Huang Qifan, the outspoken former Chongqing mayor, recently forecast that two-thirds of China’s 97,000 registered developers could eventually go under.
Further out, the risk of falling house prices could exacerbate these financial pressures because real estate is by far the most popular collateral in the banking system. The sentiment of an increasingly leveraged household sector depends in large part on how the property market is performing.
Bigger deficits or slower growth
If the government does not want to use the housing market to support growth for now, then it faces a very simple calculus. All things being equal, if real estate investment growth, which hit 11 per cent in the first half, slowed to 5 per cent then nominal GDP growth would fall by about 0.8 basis points. As manufacturing investment slows, exports wither and consumption comes under pressure, either the leadership accepts a lower rate of economic growth or it increases investment in infrastructure.
The government still has fiscal room to respond. It could further relax rules on how local governments finance infrastructure projects or could let them sell bonds in excess of the annual quota agreed at the National People’s Congress in March. A Rmb 700 billion ($99 billion) increase in the quota, raising this year’s planned sales by a third, would be likely to compensate for real estate investment growth slowing to 5 per cent. But increased infrastructure investment cannot compensate for the problems associated with a cooling property market, including failing developers, rising collateral risk and bigger fiscal holes at the local government level.
Last week’s bold statement is potentially good news for China’s long-term economic future, indicating a less alarmist, less interventionist approach to policymaking. But the near-term threats to growth mean the government may struggle to stay on the wagon.
He Wei, Finance Researcher, FT Confidential Research
China’s nervous consumers choose saving over spending
Economy at risk as fewer households inclined to consume or invest, despite tax cuts
AUGUST 25, 2019
As uncertainty builds, Chinese consumers are squirreling away more money, piling even more pressure on an already slowing economy. The results of our latest survey of 1,000 urban households showed 48 per cent saying they are opting to save over investing or consuming, the biggest proportion since February 2013. The results of the question, which is based on a quarterly survey of households conducted by the People’s Bank of China, provide fresh evidence that income tax cuts introduced by the government have failed to move the dial on consumption. In fact, just 10.5 per cent of respondents in August said they were more inclined to consume in the current environment, just below the 11.5 per cent average of the previous three years.

The survey results do not suggest that consumers are panicking in the face of rising risk, but they also do not support the idea that they are in a position to support economic growth as other key drivers falter.
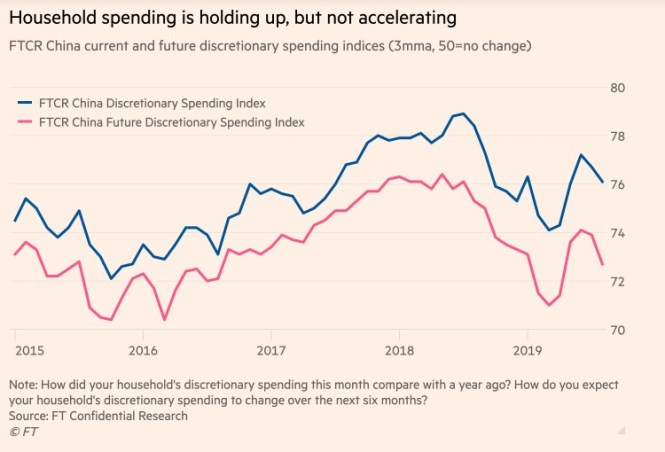
Nonetheless, while our headline consumer sentiment index fell to a six-month low in August, the reading was broadly in line with the average of the previous 12 months, while the year-to-date average also pointed to relatively buoyant sentiment.

Key year-on-year measures of incomes and views on the economy remained well above the 50 mark, suggesting a solid pace of improvement. Consumers also estimated their costs of living rose 6.8 per cent over August 2018, the slowest increase in five months, despite surging food prices. They said their discretionary spending increased on the same month last year, but at a slower pace than was seen last year.
The government began rolling out meaningful cuts to personal income tax at the end of last year to boost consumption. For example, someone earning Rmb 120,000 ($16,950) a year now takes home an extra Rmb 451 per month, excluding other deductions.
When we asked consumers last October, as the tax cuts were being unveiled, what they intended to do with any extra income, just 11 per cent said they would spend it. The following months have borne this out — as we have consistently argued, the government will have a hard time convincing its consumers to spend as the economy slows, investment returns fall, and job security comes into question.
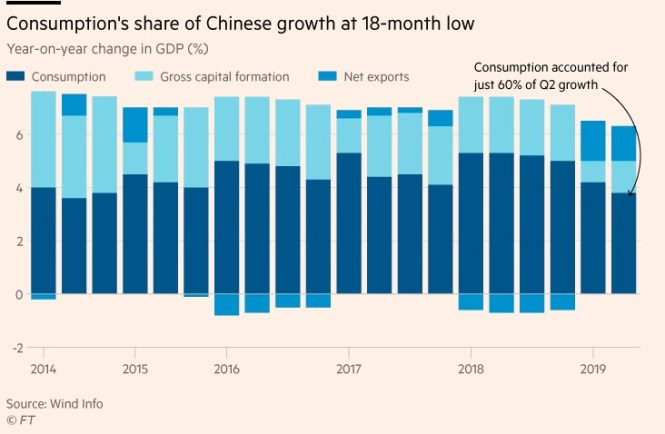
This is a problem for policymakers, who have already stated their commitment to weaning China off its addiction to real estate. Consumption, of which nearly three-quarters is by households, is already flagging, contributing to just 60 per cent of growth in the second quarter of this year, its lowest share since the final quarter of 2015. The contribution from gross capital formation, a measure of investment activity, and net exports in April-June was their biggest since 2017.
As the US-China trade war grinds on, and the global economy slows, the onus is put on investment, and infrastructure investment to support growth. This may be achievable — the economy grew 6.3 per cent in the first half, implying that sub-6 per cent growth in the second would still put Beijing on track to hit this year’s 6 per cent to 6.5 per cent annual expansion target.
However, growth driven by barely accountable local governments investing in fixed assets, with consumers in the back seat, is not what Xi Jinping’s government has envisioned for China’s economic future.
The FTCR China Consumer survey is based on interviews with 1,000 consumers nationwide. For further details click here. This report contains the headline figures from the latest Consumer survey; the full results are available from FT Database.
China adding six new pilot free trade zones

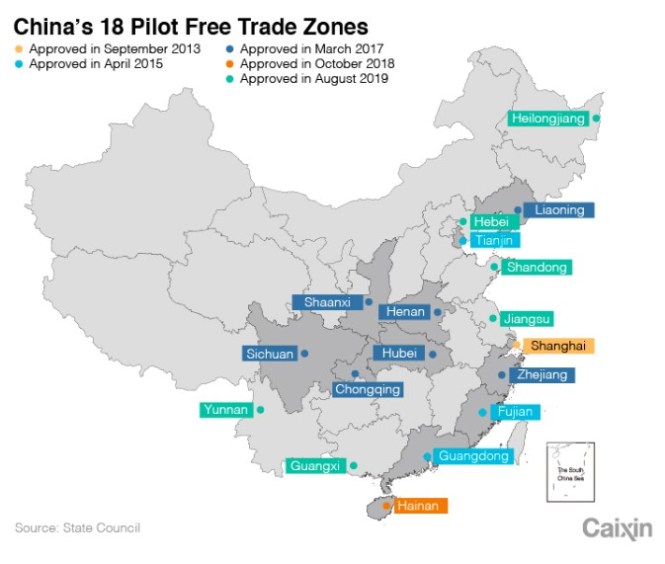
China is expanding its free trade zones (FTZ) scheme adding six pilot free trade zones as it continues to push for reform.
China’s State Council announced six new provincial pilot free trade zones in Shandong, Jiangsu, Guangxi, Hebei, Yunnan and Heilongjiang, which will make the total number of China’s free trade zones to 18.
According to the plan, the six new pilot FTZs will be developed with differentiated reform experiments.
The development of the marine economy and exploring co-operation opportunities among South Korea-Japan-China are the focuses for the pilot FTZ in Shandong.
Supporting innovation and development of the manufacturing industry, improving overseas investment cooperation and strengthening financial market development are the focuses for the pilot FTZ in Jiangsu.
Guangxi, located at southwest China, will deepen cooperation with the ASEAN region and develop land-sea transportation connection.
Building a new industrial base and supporting international trading are part of the plan for Hebei.
Yunnan will strengthen international cooperation on technology sector and cross-border economy.
Heilongjiang will focus on logistics services development for Russia and Northeast Asia.
“The new pilot FTZs will highlight innovation, further opening-up, high-quality development and integration with major national strategies,” said Wang Shouwen , Vice Minister of the Ministry of Commerce.
China launched the first pilot FTZ in Shanghai in 2013, and then established eleven more. This summer, China expanded Shanghai pilot free trade zone with the addition of a new section.
Posted 27 August 2019
Idle hands The growing ranks of unemployed graduates worry China’s government
But some of the jobless may only have themselves to blame

Aug 1st 2019| BEIJING
Throngs of young people roam around the makeshift booths in an exhibition hall in northern Beijing. They are at a job fair organised by the municipal government, aimed at unemployed college graduates. Like most jobseekers in attendance, Su Jian has brought along a stack of CVS to hand out to prospective employers. But Mr Su (not his real name), who graduated in June from a second-tier university in the capital, is unimpressed by what he sees.
The most popular booth at the fair belongs to China Railway, a state-owned behemoth. The firm’s recruiter says it pays new graduates around 4,000 yuan ($580) a month. That is less than half the average salary in Beijing and not even double the city’s minimum wage. Mr Su nonetheless submits his CV. “What can you do? There are too many of us,” he laments.
Chinese universities produced a record 8.3m graduates this summer. That is more than the entire population of Hong Kong, and up from 5.7m a decade ago. Tougher visa policies in much of the West mean that China will also receive nearly half a million returning graduates from foreign institutions this year. It is not a propitious time to enter the job market. China’s economy, buffeted by the trade war with America, is growing at its slowest pace in nearly 30 years. This year fully two-thirds of all workers joining the labour force will be university graduates, up from around half just three years ago. Mr Su wonders whether the number of graduates has outstripped the labour market’s ability to absorb them.
As recently as the early 1990s the government simply assigned graduates to jobs. It no longer dictates people’s lives so crudely, but it is clearly worried about what will happen if they do not find work. On July 12th five state agencies warned local governments that boosting employment “has become more onerous”. They linked the “employment of graduates” with “overall social stability”. Such warnings have been made annually since 2011, but this year, unusually, the public-security ministry attached its name to the notice.
Last month the government announced measures aimed at getting more graduates into work. Small firms that hire unemployed graduates can apply for a tax rebate. The national system of household registration, hukou, which restricts where people can receive subsidized public services, will be kinder to new graduates. The new rules instruct all provincial capitals (but not mega cities such as Beijing and Shanghai) to make it easier for graduates to apply for local hukou, boosting labour mobility.
Graduates who want to start their own businesses may be eligible for a state loan with little or no collateral, the ministry of human resources says. Those who cannot get hired and lack entrepreneurial drive are invited to visit one of its many local branches for “one-on-one assistance”. Local governments are also trying to help. One city in Guangxi province announced on July 26th that helping graduates find jobs had become “the utmost priority”.
There are no official statistics on the employment status of fresh graduates, but MyCos, a consultancy on education in Beijing, found that the proportion of them who had found full-time jobs within six months of graduation had fallen from 77.6% in 2014 to 73.6% in 2018. The average monthly salary for new graduates fell from a peak of 4,800 yuan in 2015 to 4,000 yuan in 2017, according to Zhaopin, China’s biggest job-recruitment platform.
The trade war with America seems to have tempered hiring, especially in export industries. A crackdown on shadow banks (lenders that do not take state-guaranteed deposits), which have been enthusiastic recruiters of new graduates, has forced mass layoffs. Growing international suspicion of Chinese tech firms may slow their expansion plans, too. Civil-service recruitment, meanwhile, was cut to 14,500 this year, the lowest intake in a decade.
A recent graduate from Peking University recounts how she was laid off by a financial-services firm earlier this year. She is looking for a job at an internet firm. Prospective employers, she says, have extended the probation period from two or three months to six. “During the probation period employers are legally entitled to pay only 80% of the normal salary,” she explains. “More and more companies are exploiting this power.”
With a degree from China’s most prestigious university, she is at least confident she will soon secure a good job. Graduates from lesser-known institutions face a much harder time. Several recruiters at the job fair in northern Beijing admit to chucking CVS from “no-name schools” straight into the bin. Part of the problem, says Joshua Mok, a professor at Lingnan University in Hong Kong, is that the “average quality” of graduates may have deteriorated in recent years. The number of universities has increased from just over 1,000 in 2000 to around 2,700 today. Employers, unfamiliar with so many new names, often dismiss the obscure ones as degree mills. They are not always wrong.
In 2009 a sociologist coined the term yizu, or “ant tribe” to refer to struggling graduates from the provinces who swarm to mega cities. An estimated 100,000 so-called “ants” lived in Beijing in 2010. But the term is no longer widely used, says a graduate from the southern province of Yunnan who lives in Beijing. Rising rents, combined with a crackdown on the illegal subdivision of flats, have driven most provincial graduates away. She, too, may move home soon: salaries may be lower in Yunnan, but so is the cost of living.
Many graduates have unrealistic expectations, says Yao Yuqun of Renmin University: “Everybody wants to be a manager right away.” There are plenty of jobs to go around, he says. A report in May by the China Institute for Employment Research, a think-tank, found that there were 1.4 entry-level vacancies (excluding unskilled work) for each graduating student. Many jobs are in second- and third-tier cities. Graduates, it seems, are too snooty to take them. One calls this the “bat or bust” mentality, referring to Baidu, Alibaba and Tencent, three sought-after online giants. The government counsels humility. Anyone blessed with a job offer, it said recently, should “promptly sign the contract”. ■
China Economic Update

By Eric Wong
Managing Director, Canada Wood China
August 8, 2019
Posted in: China, Market News
China’s GDP increased 6.2 percent year-on-year in the second quarter of 2019, slowing from a 6.4 percent expansion in the previous three-month period and matching market expectations. It was the lowest growth rate since the first quarter of 1992, amid ongoing trade tensions with the United States, weakening global demand and alarming off-balance-sheet borrowings by local governments.
The Caixin China General Manufacturing PMI rose to 49.9 in July 2019 from 49.4 in the previous month, beating market expectations of 49.6, but still pointing to a slight deterioration in business conditions. Output was little-changed following a decline in June amid a slight increase in overall new orders, while new export sales were flat. Looking ahead, business confidence regarding output for the year ahead improved to a three-month high.
2019 Economic Outlook
Economist Intelligence Unit forecasted that China’s real GDP will grow by 6.2% per year on average in 2019-20—just above the minimum level required for the government to achieve its 2020 goal of doubling real GDP from its 2010 level. Growth is expected to slow to an annual average of 5.5% in 2021-23. Beijing set a 2019 economic growth target of between 6 and 6.5 percent in March.
Meanwhile, the organization has amended its trade war forecast. It does not anticipate a trade agreement being reached between China and the United States until 2021. In the interim, it expects both sides to refrain from further tariff escalation, although the risks to this forecast are high.
The Construction Sector
Home prices in 70 major Chinese cities were flat in Q2 2019, especially in first-tier cities in China, amid continuous government controls to curb speculation and prevent an overheated market.
Total investment in real estate had an accumulated increase of 10.9 percent year-on-year in June, slowing slightly compared to the previous months in 2019, at a growth rate above 11 percent.
Total floor area completed in Q2 was at 757 million m2, up 13.5 percent compared to Q1, but still below the same periods in 2018.

CAD/CNY gained strong overall momentum in Q2 2019. Although there was a correction last month it was still below the highs reached in October 2018.
China Wood Imports (cited from China Bulletin)
Softwood log inventories at China’s main ocean ports totaled 4.1 million m3 at the end of June 2019, a slight increase of 1.5 percent versus the previous month. Radiata pine log inventories were 6 percent higher from the prior month and represented 72.5 percent of log inventory. North American Douglas-fir and hemlock volumes declined 13.7 percent form the month before.
Softwood lumber inventories at Taicang port and the surrounding area were 1.56 million m3 in late June 2019, up nearly 10 percent from last month, excluding inventories of about 60,000 m3 at some new warehouses. The inventory level of SPF was 520,00 m3, the same as last month.
Vietnam Investors Shrug Off U.S. Trade Risk for Growth

By Ishika Mookerjee and Ian C Sayson
August 15, 2019, 3:30 PM MDT Updated on August 15, 2019, 11:05 PM MDT
Foreign investors in Vietnam stocks are shrugging off the threat of additional U.S. tariffs on the country’s exports, even as the Southeast Asian manufacturing hub draws increased scrutiny from President Donald Trump’s government.
Robust economic growth and the government’s planned sale of stakes in state-controlled companies will offset dips in equity prices triggered by trade frictions, according to investors including Federico Parenti at Sempione Sim SpA in Milan.
“I didn’t change my view,” said Parenti, who helps manage about $3 billion including Vietnam equities at Sempione Sim in Milan. “When you invest in a country, you do it for the long term.” Vietnam Dairy Products JSC and Saigon Beer Alcohol Beverage Corp. are among the firm’s holdings.
Foreign investors have poured $854 million into Vietnam’s $193 billion stock market in the 12 months through Aug. 15, even as the benchmark Ho Chi Minh Stock Index was little changed in the period. The gauge has climbed 10% so far this year, the most among Southeast Asian markets and outpacing the 0.8% rise in the MSCI AC ASEAN Index.
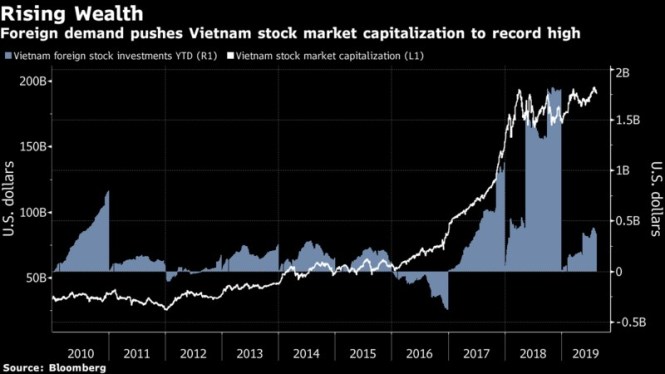
The government’s sale of shares in state-enterprises helped raise about 5.16 trillion dong ($222 million) in the first half of this year, adding to a record $5.09 billion from initial public offerings last year. Corporate tax breaks, along with economic expansion exceeding 6%, “augur well for the capital market,” said Mark Mobius, who runs Mobius Capital Partners LLP.
To be sure, most investors can’t ignore the risk of the U.S. increasing duties on Vietnam goods, said Felix Lam, who manages close to $2 billion in Asia Pacific equities at BNP Paribas Asset Management. While Lam doesn’t hold Vietnam shares as turnover is too low for his mandate, he said an increase in liquidity could allow him to buy the stocks.
READ: Vietnam Won the U.S.-China Trade War But Is Now in Trouble
“If trade negotiations take longer and are more severe, then Vietnam will be affected alongside other Asian countries,” said Lam. Still, he added, “one would expect that companies would have captured quite a lot of that in their share prices already.”
The Trump administration has been increasing pressure on Vietnam to reduce its growing trade surplus with the U.S., including increasing to 400% in July the duty on steel imports that it alleges originated in Taiwan and South Korea. Exports to America equaled 20% of gross domestic product last year and almost 26% in the first half of 2019.
For Bharat Joshi, who helps oversee $650 billion as a fund manager at Aberdeen Standard Investments, Vietnam’s domestic demand outweighs risks arising from trade tensions. The firm counts Vietnam Dairy Products as an “anchor investment” in the country.
“There is structural growth happening on the ground, you have rising middle-class income, demand for credit is starting to expand, and the government is doing all it can to privatize,” said Joshi.
— With assistance by Nguyen Kieu Giang
Vietnam’s losing battle against trade abuses risks more Trump action
Officials struggle to tackle origin fraud as bilateral surplus grows in shadow of trade war
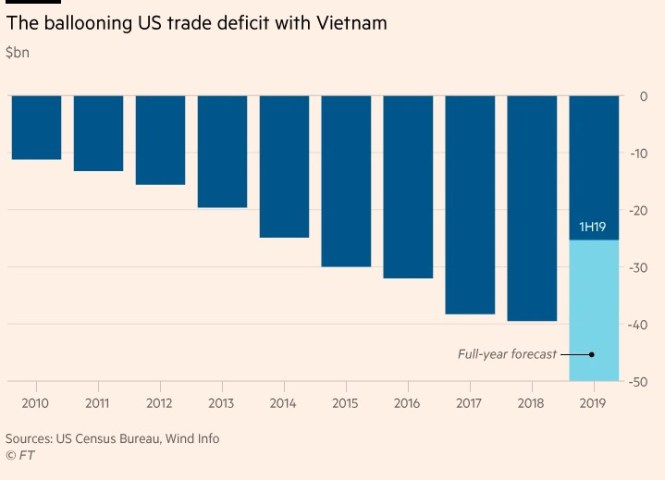
Vietnamese officials are losing their game of cat and mouse with manufacturers that mislabel the origin of their products to bypass the US tariff regime. The stakes are high — the US trade deficit with Vietnam ballooned to nearly $40 billion in 2018, and economists expect it to grow to about $50 billion this year. This is fuelling anger in Washington, where US trade terms are one of the few areas on which there is bipartisan agreement and piling pressure on Hanoi to take more meaningful steps to narrow the gap.
Vietnam has become a victim of its success in attracting foreign direct investment. The country’s low labour costs have long been a draw for manufacturers and buyers who are put off by an increasingly expensive China. But this process has gone into overdrive as companies look to bypass the impact of US tariffs on Chinese goods.
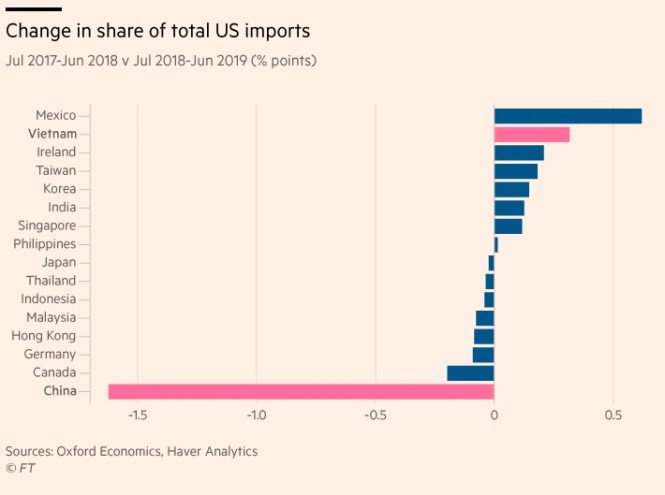
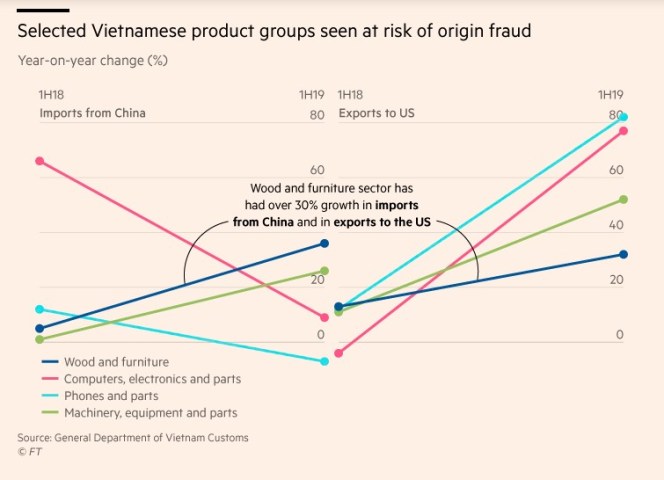
In among the yawning US-Vietnam bilateral trade gap are goods that originated in China and other countries, which have been rerouted through Vietnam to take advantage of the country’s friendlier tariff treatment. Although the true size of this origin fraud is unknown, surging imports from China and exports from Vietnam in key categories such as wood and furniture and computers and parts have rung alarm bells, forcing Hanoi to act.
The administration of US president Donald Trump — who in June called Vietnam “the single worst abuser of everybody” — has already imposed tariffs on Vietnamese steel imports, on the basis that at least some of these originated in South Korea and Taiwan, and added the Vietnamese dong to the US Department of the Treasury’s currency manipulator watchlist.
Officials in Vietnam fear worse is to come. Factory inspections are one of a series of measures introduced by Nguyen Xuan Phuc, the prime minister, to demonstrate Vietnam’s commitment to addressing US complaints. Customs data collection is also being overhauled and scrutiny of foreign investment is being stepped up.
But these measures are having a limited impact on the ground, and the trade deficit continues to grow.
“The US is quite concerned about goods being rerouted from not just China but Korea and Taiwan, and Vietnam is taking this seriously — they may be under-resourced but they’re at risk and they’ll have to step up vigilance,” said Sian Ferrer, lead Asia economist at Oxford Economics.
Ms. Ferrer estimates a 10 per cent tariff on those exports most at risk of trade action would cut Vietnam’s gross domestic product growth to an average 5.9 per cent in 2020-21, from a baseline of 6.2 per cent.
In the wood industry — where FDI approvals before the end of the first half almost matched last year’s total — officials are struggling to tackle origin fraud because they have so little visibility. Dien Quang Hiep, president of the Binh Duong Timber and Forest Product Association, says foreign investment in Vietnam’s wood-processing sector is “another country within Vietnam”.

Chinese investments in wood processing in Vietnam are hard to monitor because they are usually small, typically less than $2.5m per project. The strategy of customs investigators is also flawed in that manufacturers are notified in advance of a site visit, providing an opportunity to clean up.
“We don’t know what the companies are doing before and after our visits,” said a local timber association representative who recently joined an inspection of a Chinese plywood manufacturer in north-east Bac Giang province.
At the Vietnam Chamber of Commerce and Industry, a quasi-government organisation that shares responsibility for granting certificates of origin to exporters, staff are struggling to cope with the workload. The VCCI office in Hanoi has just five staff members who are overwhelmed by the 500 applications they receive on average each day.
In sectors such as clothing and footwear — where 90 per cent of capital goods come from China — strong links between Vietnamese companies and their Chinese counterparts make it especially difficult to identify collusion in mislabeling goods, said an official with the Vietnam Leather, Footwear and Handbag Association, who asked not to be identified. The torrent of FDI inflows is not letting up — the value of newly licensed investment projects from China so far this year already exceeds the total for 2017 and 2018.

Vietnam could limit inbound investment from China but doing so would risk further inflaming tensions with its economically powerful neighbour. This anxiety is feeding into industry’s concern that Vietnam’s efforts so far are insufficient, and that this threatens incurring fresh action from Washington.
“All origin fraud has been identified by the US authorities, not by the Vietnamese authorities — this is Vietnam’s weakness. We have to take a much stronger, proactive approach if we want to mitigate this sizeable risk,” said Mr Dien. He said government agencies needed to work more closely, and companies needed to stop being tipped off.
The Vietnamese government is beginning to take direct action to tackle the trade surplus, including holding talks on increasing purchases of US goods. Doing so appeals to Mr Trump, who is known to focus on bilateral trade numbers rather than looking at the US trade balance in its entirety.
Mr Trump and Mr Phuc in June discussed long-term and large-scale co-operation that could result in a big increase in imports of US liquefied natural gas to Vietnam. Executives from state-owned coal producer Vinacomin and Pennsylvania-based Xcoal Energy & Resources met in Hanoi last month to discuss potential coal purchases. Analysts believe Vietnam could also increase purchases of goods ranging from aircraft to cotton to close the gap, and even military equipment, provided it could address Russian and Chinese concerns.
Vietnam’s problem is that it faces structural constraints on how much it can buy. For example, even if it agreed to take $5 billion in US LNG, it has nowhere to store it. Rajiv Biswas, Asia-Pacific chief economist at IHS Markit, noted that Vietnam bought just $5 billion in goods from the US in the first half, but sold it goods worth $30.4 billion .
“Even if they had doubled imports from the US, it still wouldn’t have made much of a difference because of the size of the trade deficit — they’re facing huge pressure to meaningfully narrow that trade deficit and it’s going to take more than a year to do that,” he said. — To Xuan Phuc is a contributor to FT Confidential Research. Thu Vu is a Vietnam researcher for FT Confidential Research.
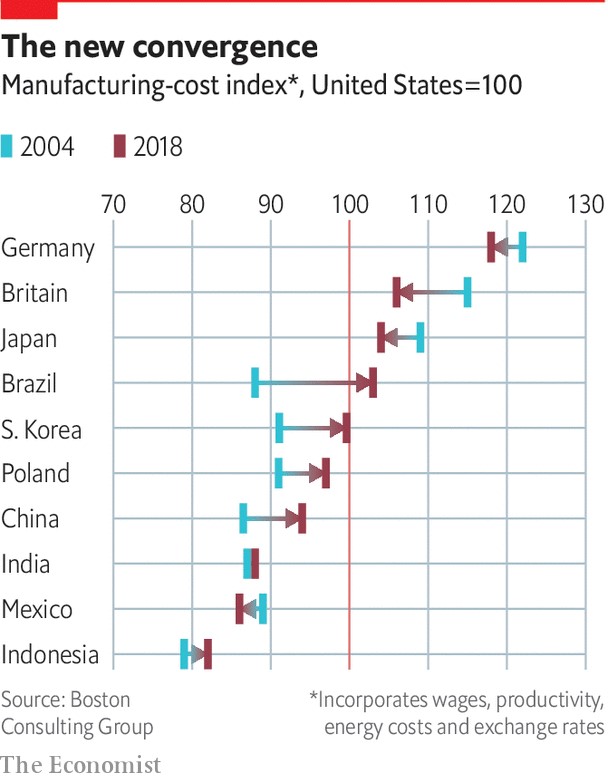
Supply chains are undergoing a dramatic transformation
This will be wrenching for many firms, argues Vijay Vaitheeswaran

Print edition | Special report
Jul 11th 2019
Tom Linton, chief procurement and supply-chain officer at Flex, an American contract-manufacturing giant, has his finger on The Pulse. That is the name of his firm’s whizzy command centre in California, which is evocative of a Pentagon war room. The kit allows him to monitor Flex’s 16,000 suppliers and 100-plus factories, producing everything from automotive systems to cloud-computing kit for over 1,000 customers worldwide. Mr Linton is one of the acknowledged kings of the supply chain—the mechanism at the heart of globalization of the past few decades by which raw materials, parts and components are exchanged across multiple national boundaries before being incorporated into finished goods. Ask him about the future, however, and he answers ominously: “We’re heading into a post-global world.”
A few years ago, that would have been a heretical thought. The combination of the information-technology revolution, which made communications affordable and reliable, and the entry of China into the world economy, which provided bountiful cheap labour, had transformed manufacturing into a global enterprise. In his book “The Great Convergence”, Richard Baldwin argues that the resulting blend of Western industrial know-how and Asian manufacturing muscle fuelled the hyper-globalization of supply chains. From 1990 to 2010, trade boomed thanks to tariff cuts, cheaper communications and lower-cost transport.
The Organisation for Economic Co-operation and Development (OECD), a think-tank for advanced economies, reckons that 70% of global trade now involves global value chains (GVK’s). The increase in their complexity is illustrated by the growth in the share of foreign value added to a country’s exports. This shot up from below 20% in 1990 to nearly 30% in 2011.
Western retailers developed networks of inexpensive suppliers, especially in China, so that they in turn could deliver “everyday low prices” to consumers back home. Multinational corporations (MNCs) that once kept manufacturing close to home stretched supply chains thin as they chased cheap labour and economies of scale on the other side of the world. Assuming globalization to be irreversible, firms embraced such practices as lean inventory management and just-in-time delivery that pursued efficiency and cost control while making little provision for risk.
But now there are signs that the golden age of globalization may be over, and the great convergence is giving way to a slow unraveling of those supply chains. Global trade growth has fallen from 5.5% in 2017 to 2.1% this year, by the OECD’s reckoning. Global regulatory harmonization has given way to local approaches, such as Europe’s data-privacy laws. Cross-border investment dropped by a fifth last year. Soaring wages and environmental costs are leading to a decline in the “cheap China” sourcing model.
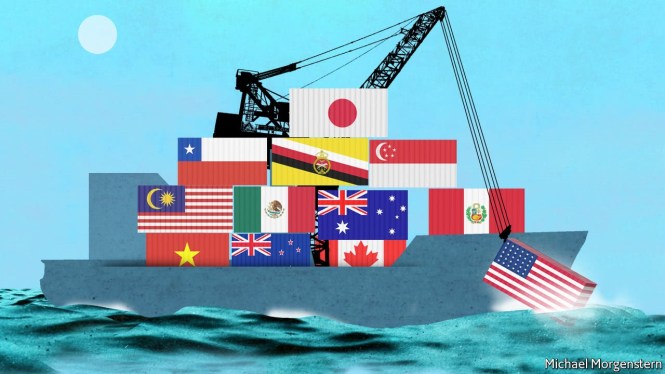
The immediate threat comes from President Donald Trump’s imposition of tariffs on America’s trading partners and renegotiation of free-trade agreements, which have disrupted long-standing supply chains in North America and Asia. On June 29th, Mr Trump agreed a truce with Xi Jinping, China’s president, that suspends his threatened imposition of duties of up to 25% on $325 billion-worth of Chinese imports but leaves in place all previous tariffs imposed during the trade war. He threatened in May to impose tariffs on all imports from Mexico if it did not crack down on immigration but reversed himself in June. He has delayed till November a decision on whether to impose tariffs on automobile imports, which would hit European manufacturers hard.
Look beyond politics, though, and you will find that supply chains were already undergoing the most rapid change in decades in response to deeper trends in business, technology and society. The rise of Amazon, Alibaba and other e-commerce giants has persuaded consumers that they can have an endless variety of products delivered instantly. This is putting enormous pressure on MNCs to modify and modernise their supply chains to keep pace with advancing innovations and evolving consumer preferences.
Arms race
The biggest force for change is technology. Artificial intelligence (ai), predictive data analytics and robotics are already changing how factories, warehouses, distribution centres and delivery systems work. 3D printing, block chain technologies and autonomous vehicles could have a big impact in future. Some even dream of autonomous supply chains requiring no human intervention.
However, technological advances also raise the spectre of an arms race in supply-chain security. Aggressive private hackers and state-sponsored cyber-warriors appear to have the upper hand over beleaguered corporations and governments. Recent headlines have focused on America’s crackdown on Huawei, a Chinese telecoms giant. But the issues involved go far beyond one firm, given that much of the world’s electronics-manufacturing and hardware innovation takes place in China.
If a technology cold war breaks out, it would smash today’s highly integrated technology supply chains and force an expensive realignment. It may even lead to a bifurcation in the roll out of 5G, a new telecoms-network technology that is the essential enabler of coming marvels such as the internet of things (IOT). With the proliferation of inexpensive sensors, the IOT will allow homes, factories and cities to be digitally monitored and managed. A “splinter net of things” (in which America followed one standard and China another) would not only be costly and inefficient, it would also fail to address legitimate security concerns about future cyber-threats in the age of 5G.
Even if Huawei is eventually spared, and the truce in America’s trade war with China turns into a frosty peace, the era of frictionless supply lines flowing from Shenzhen to San Francisco and Stuttgart has ended. As globalization is transformed into something messier, the consequences for MNCs and the world economy could be momentous.
This report will show that supply chains were already becoming shorter, smarter and faster before politicians started taking a hammer to the trading system. Given today’s riskier world, supply chains will need to become safer too. This transformation threatens firms that have entrenched supply networks, but it also presents opportunities for those that adapt nimbly.
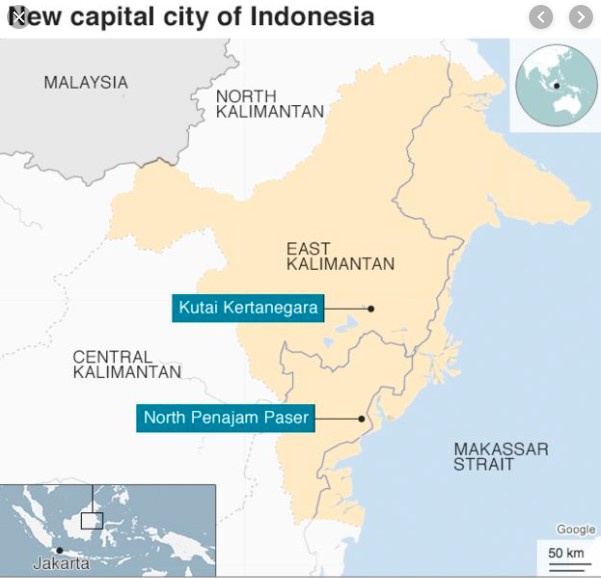
Indonesia: Country Will Begin Moving Its Capital to Borneo by 2024, President Says
What Happened: The Indonesian government will begin the estimated $33 billion process of moving its capital from Jakarta to the island of Borneo by 2024 to alleviate the current capital’s congestion, flooding and pollution problems, according to President Joko “Jokowi” Widodo, Bloomberg reported Aug. 26.
Why It Matters: Although Indonesia’s government has been discussing the issue of potentially moving its capital for the decades, Jokowi’s announcement indicates a timeline for the relocation in the coming years. Besides offering some congestion and pollution relief to Jakarta, the move is also intended to mitigate inequality among Indonesia’s regions and spur economic growth for Borneo’s Kalimantan province.
Background: Jokowi’s announcement comes as Indonesia’s president enters a second term after securing a resounding electoral victory earlier this year. Before the relocation can proceed, however, Indonesia will be required to obtain the necessary funding for the move; the government only plans to fund 19 percent of the total.
Read More:
- In Indonesia, Energy Reform Takes a Back Seat to Pragmatism (Aug. 12, 2019)
- Indonesians Get Ready to Pass Judgement on ‘Jokowi’ (March 8, 2019)
- Trade Profile: ASEAN Pulls the Threads Together (Nov. 20, 2017)
New UN Singapore Convention drives shift to mediation of trade disputes
Signatories aim to ease global commerce and promote ‘alternative and effective’ resolution

Delegations from around the world gather in Singapore this week for the signing of the UN’s Singapore Convention on Mediation. The driving force behind the convention is to assist international trade and promote mediation as an “alternative and effective method” of resolving trade disputes, according to the UN. The aim is that an internationally ratified framework will give businesses greater confidence to mediate cross-border disagreements rather than take them to court. A priority is to keep commercial disputes out of local courts, where litigation can be costly and there may be bias in favour of local operators.
A mediation convention was proposed by the US in 2014, and its development assigned to a working group of the UN’s commission on international trade law. Timothy Schnabel, then a State Department attorney, headed the US delegation to the group.
“In some jurisdictions like the US and the UK, mediation is already used frequently for commercial disputes,” says Mr Schnabel. “But in many other legal cultures, mediation is not as widely accepted,” he adds. The convention will help mediation gain wider acceptance by “providing an international standard for recognition and enforcement”.
“The convention will give businesses the assurance that they can enter mediation and rely on any settlement reached,” says Mr Schnabel. He adds that mediation is usually a faster and cheaper way to resolve disputes than arbitration, which has been “the preferred method of alternative dispute resolution for years”.
In arbitration, decisions can be imposed on quarreling parties by an arbiter, but in mediation the parties involved voluntarily agree. “Mediation preserves business relationships, because at the end of the day you come to agreement through consensus,” says Mr Schnabel. He is now executive director of the Chicago-based Uniform Law Commission, a non-profit organisation of lawyers appointed to draft legislation in areas of US state law where uniformity is beneficial
While supporters suggest the convention has the potential fundamentally to change cross-border commercial dispute resolution, others are skeptical. Some practitioners of international commercial mediation question whether the convention is necessary.
“The need for an international convention to ensure mediation agreements are enforceable was not exactly something businesses or lawyers were crying out for,” says F. Peter Phillips, at US-based Business Conflict Management.
Aspects of the convention, he adds, “seem inconsistent with the way commercial mediation is practiced in major jurisdictions such as the UK and the US”. The way the convention handles enforceability of mediated outcomes, he argues, is antithetical to the process of mediation: “mediation results from consensus between parties who won’t be made to do something they didn’t already agree to.”
The convention also specifies that one criterion needed for settlements to be enforced by a court is proof that an agreement resulted from mediation. Yet Mr Phillips says it becomes problematic to prove such a claim. “Under the convention, a mediator can attest by either signing the settlement agreement or another document certifying that the mediation was carried out,” he notes.
Mr Phillips adds: “But mediators conscientiously refuse to sign settlement agreements, either as part of their obligation of confidentiality, or so that they cannot be subpoenaed as a witness or be included as a party to the agreement. In some jurisdictions, a mediator is immune and cannot testify about the agreements on which they mediate.”
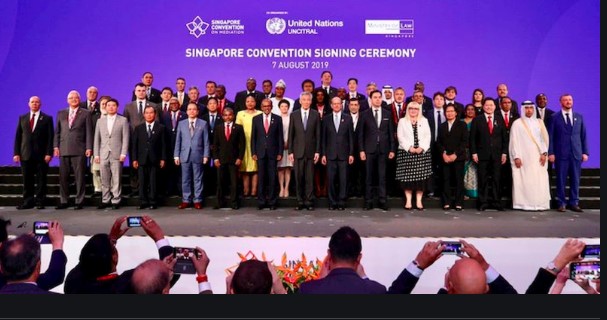
The Singapore Convention protects only settlements resulting from commercial mediation. It expressly excludes personal consumer disputes and those relating to family, inheritance or employment law. It also excludes settlements reached and enforceable as part of an arbitration judgment or award: there is a separate convention for such settlements, known as the New York Convention, signed in 1958.
Such an exclusion makes sense, says Mr Phillips, given that mediation is “a different animal” to arbitration. Yet he — and other lawyers — say large parts of the Singapore Convention seem to be “lifted almost entirely” from the New York Convention.
George Bermann, director of the Center for International Commercial and Investment Arbitration at Columbia Law School in New York, welcomes the Singapore Convention. “There’s no reason why it shouldn’t be as conducive to mediation as the New York Convention has been for arbitration,” he says. Meanwhile, Mr Bermann sees in the new convention plenty of shades of the New York Convention, including the conditions the Singapore Convention provides for parties to reject the enforcement of a mediated settlement.
“It would now appear necessary to pin down, with clarity and certainty, the criteria for determining whether an apparent mediation was a real one,” says Mr Bermann. He adds that one potential complexity of the Singapore Convention is the necessity to prove that a settlement emerged from a genuine mediation.
“With the Singapore Convention, counter parties in signatory countries can have faith that settlement enforcement should not be required, if they have reasons to doubt the mediation procedure or the legitimacy and integrity of the mediator,” says Mr Bermann. Because, now, “mediation is better anchored in some jurisdictions than others”, he argues, “the convention is a powerful tool to expand its usage around the world.”
Matthew Skinner, partner at law firm Jones Day in Singapore, notes that the New York Convention’s value in establishing the legitimacy of arbitration was not realised for decades. “It was a slow burn,” he says. “I would not anticipate the Singapore Convention taking so long but with all these things it takes time to be established.”
Jan O’Neill, lawyer at law firm Herbert Smith Freehills in London, thinks there is potential for the Singapore Convention — if it receives widespread ratification — to encourage people to use mediation, not least in jurisdictions with limited experience of alternative dispute resolution.
Understanding of mediation is still “frustratingly patchy”, says Ms. O’Neill. “So, regardless of how many mediated settlements actually need to be enforced under the new convention, its real value will probably lie in reinforcing the credibility of mediation.”
She adds: “Just the existence of a global enforcement regime will go a long way to reassuring parties less familiar with the process that it’s a reliable dispute resolution option, which courts around the world will recognise.”
McKinsey Sees ‘Ominous’ Signs of Another Asian Debt Crisis
By Subhadip Sircar August 19, 2019, 8:59 PM MDT
Firms in most of Asia are under debt-servicing stress: report
Trade war has increased risk adversity in Asian debt markets
More than two decades since the Asia debt crisis gripped the region, global consulting firm McKinsey & Co. is warning that signs of a rerun are “ominous.”
Increased indebtedness, stresses in repaying borrowing, lender vulnerabilities and shadow banking practices are some of the concerns cited by McKinsey in an August report. Whether building pressures are “enough to trigger a new crisis remains to be seen” but governments and businesses need to monitor potential causes, authors Joydeep Sengupta and Archana Seshadrinathan wrote.
McKinsey’s warning shot comes as a slowing global economy puts pressure on earnings at Asian companies, and the U.S.-China trade war makes debt investors more risk-averse. Still, fund managers point to improved credit metrics of Asian dollar bond issuers in recent years, and Moody’s Investors Service said last week it expects most Asian economies can offset the domestic impact of the global slowdown through monetary and fiscal policy measures.
McKinsey examined the balance sheets of more than 23,000 companies across eleven Asia-Pacific countries, and found firms in most of Asia face “significant stress” in servicing debt obligations. In countries such as China and India, those pressures have risen since 2007, while falling sharply in the U.S. and U.K. during the same period, according to McKinsey.
The analysis looked at the share of long-term debt at corporations with an interest coverage ratio of less than 1.5 times. At these levels, corporations are using a predominant share of their earnings to repay their debt, according to the study. In 2017, in China, India and Indonesia, more than 25% of long-term debt was at by companies with a ratio of less than 1.5, it said.
Since 1997, financial regulators have put in place safeguards to prohibit a repeat of the crisis that engulfed Thailand, Korea, Indonesia and several other Asian nations and had long-lasting repercussions. Potential triggers of a crisis that need to be monitored include defaults in repayment of debt, liquidity mismatches, and large fluctuations in exchange rates, according to McKinsey.
— With assistance by Finbarr Flynn

Economic data, commodities and markets
Print edition | Economic Indicators
Aug 22nd 2019
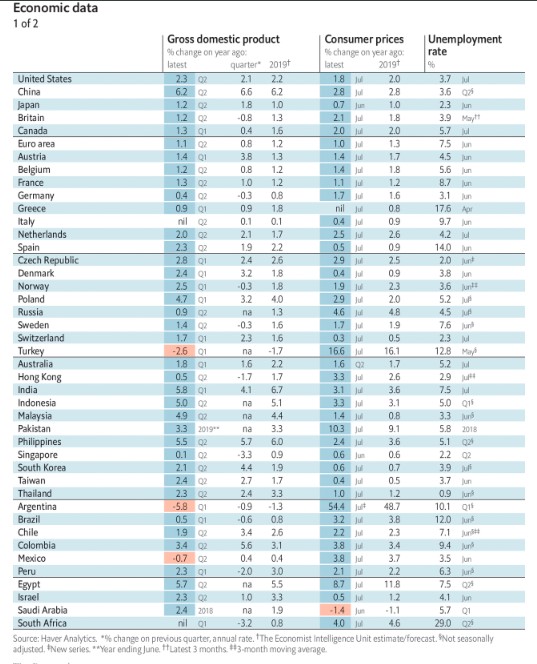


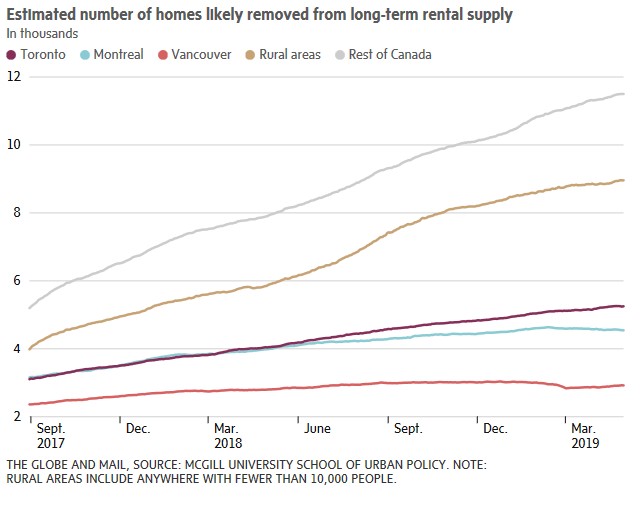

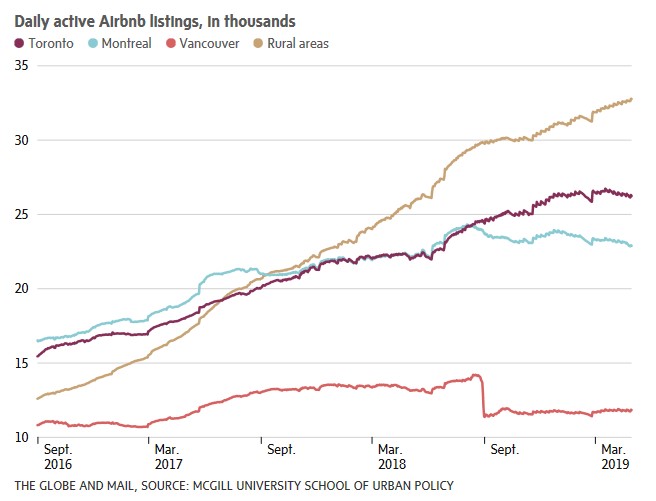
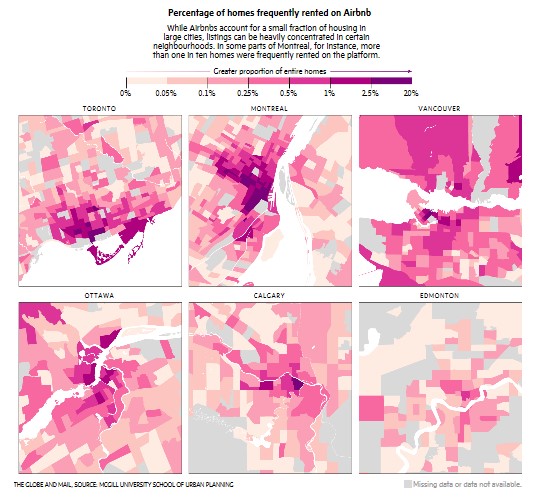

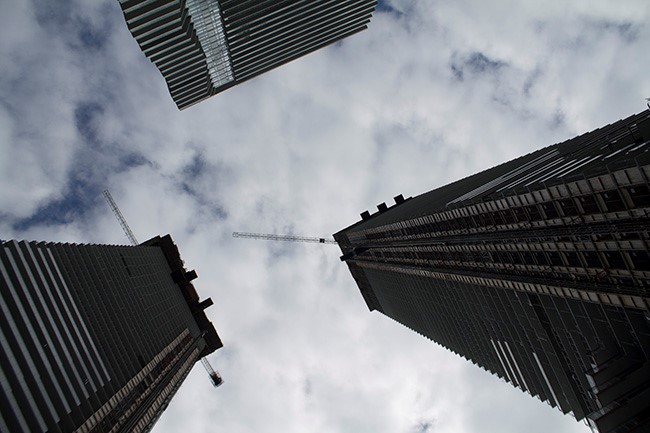

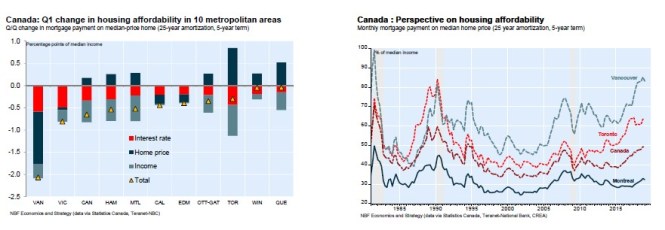
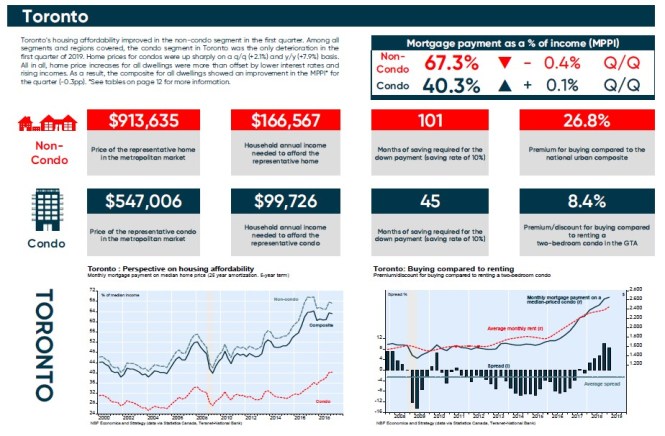
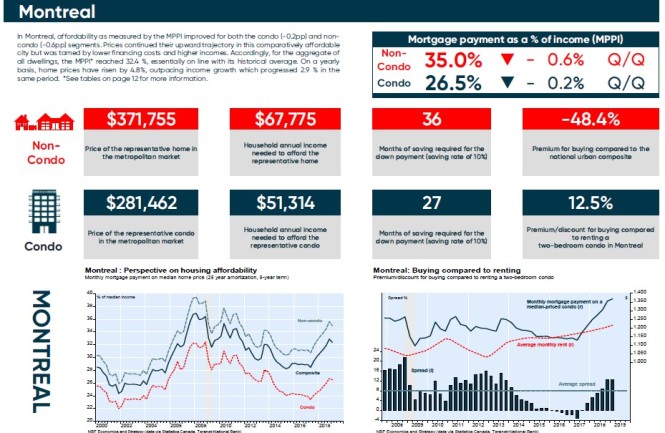
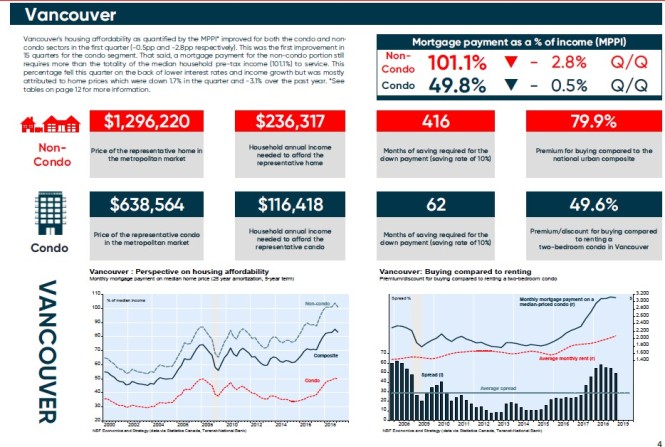
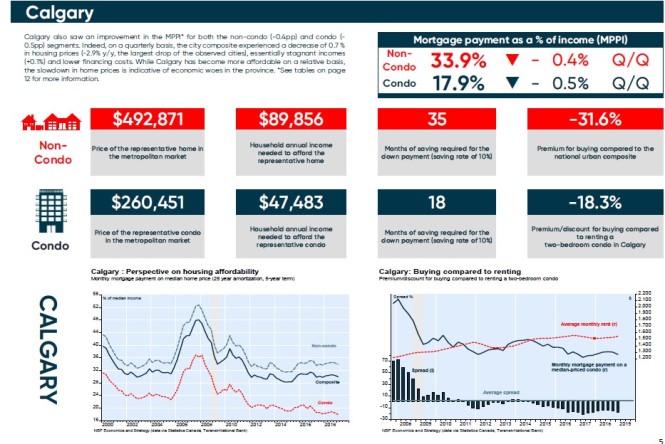
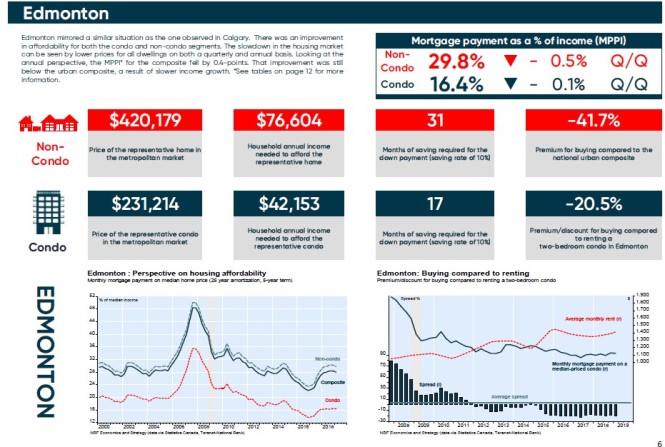
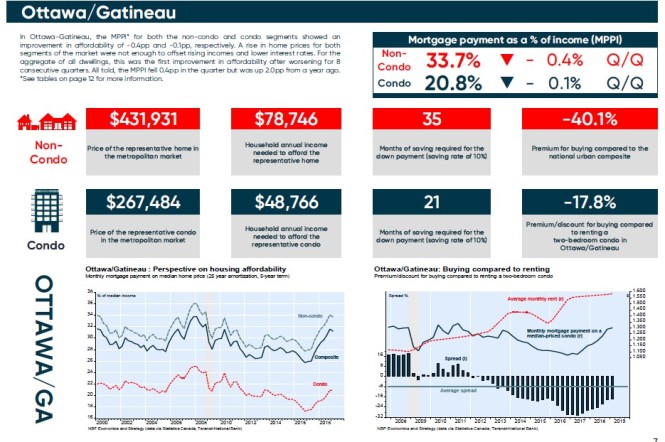
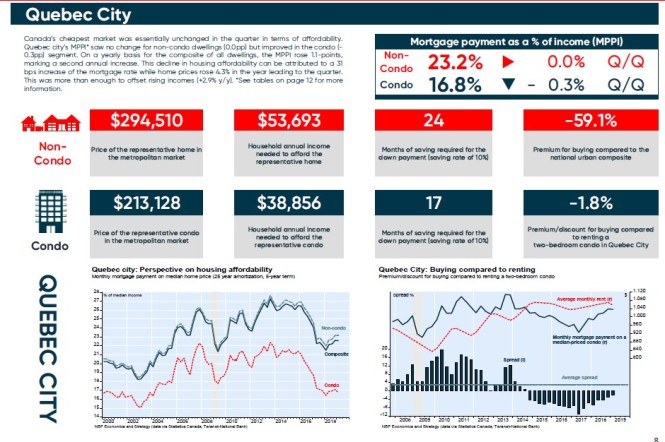
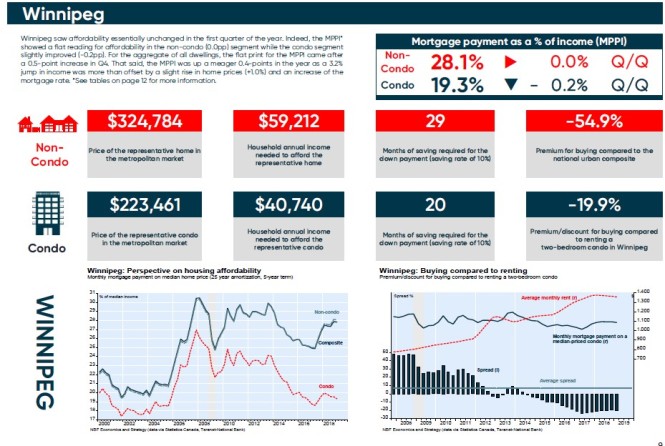
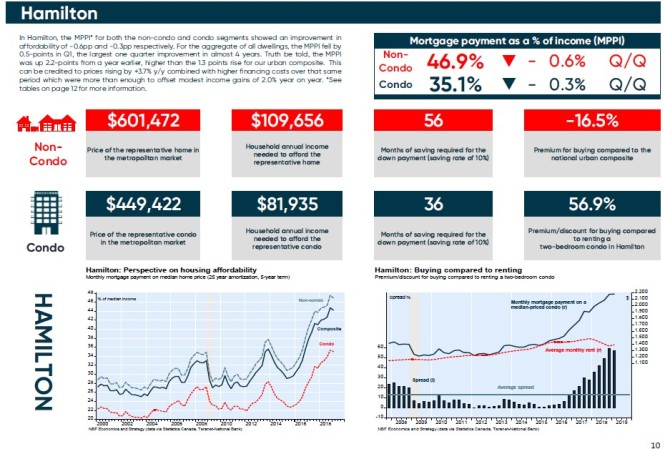
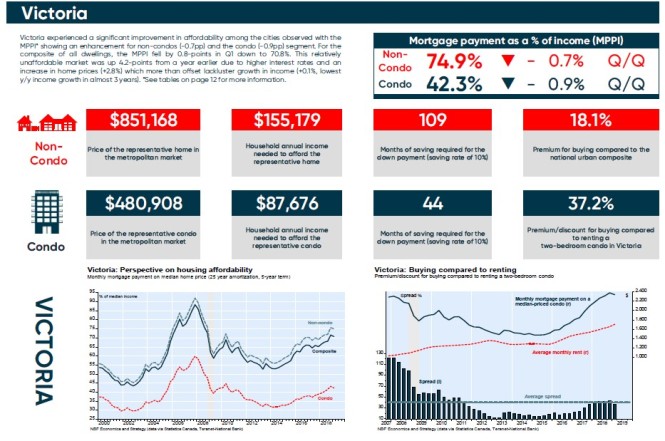
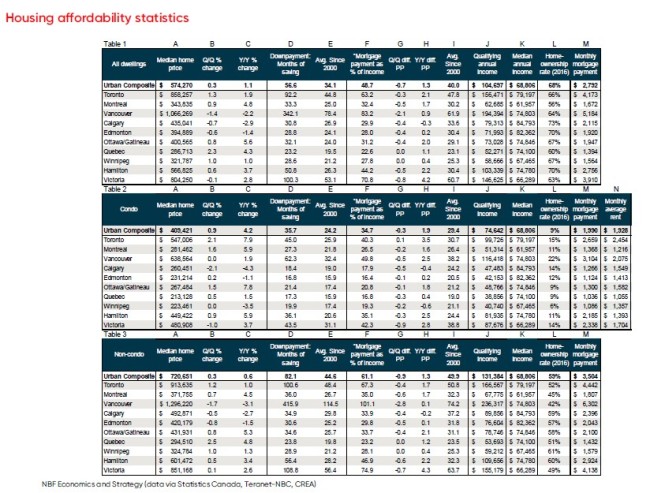
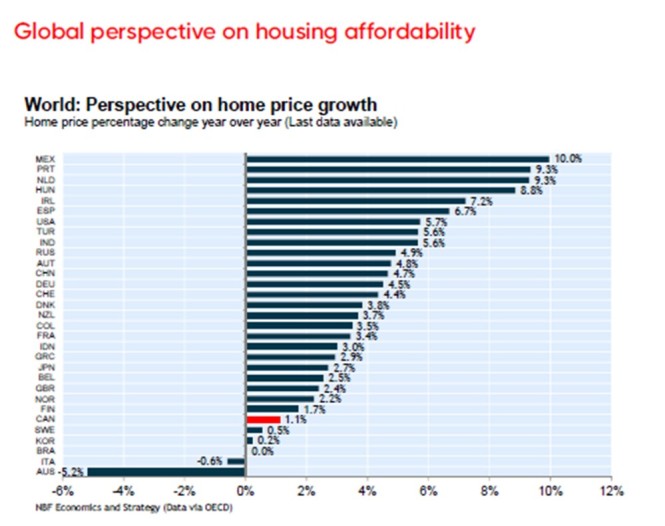
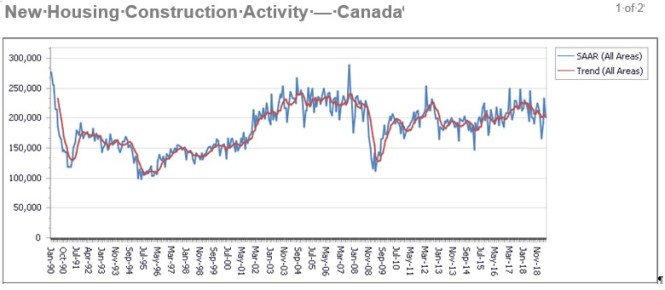
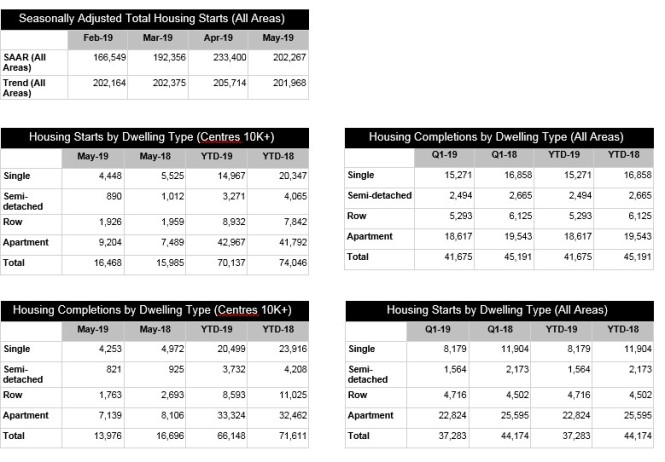


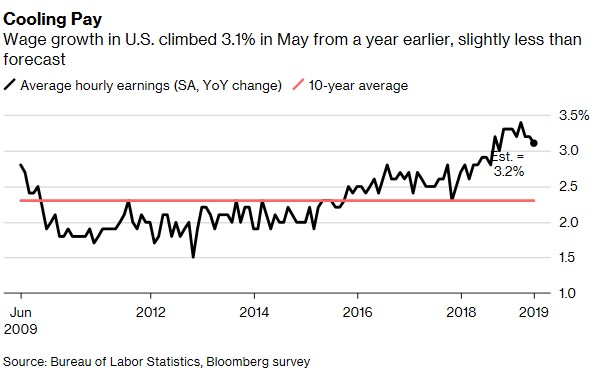
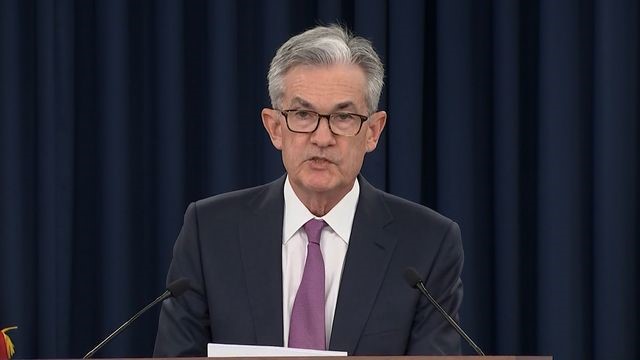
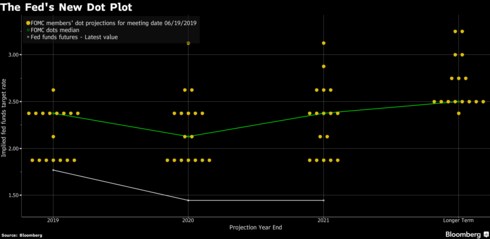
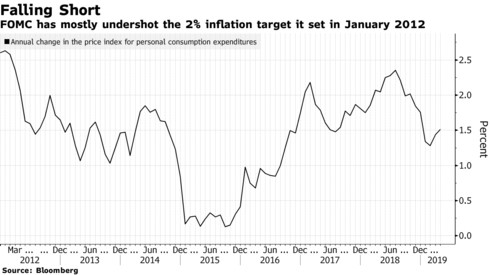

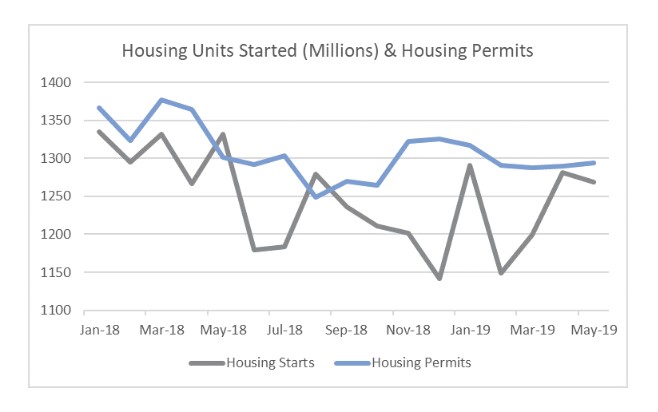
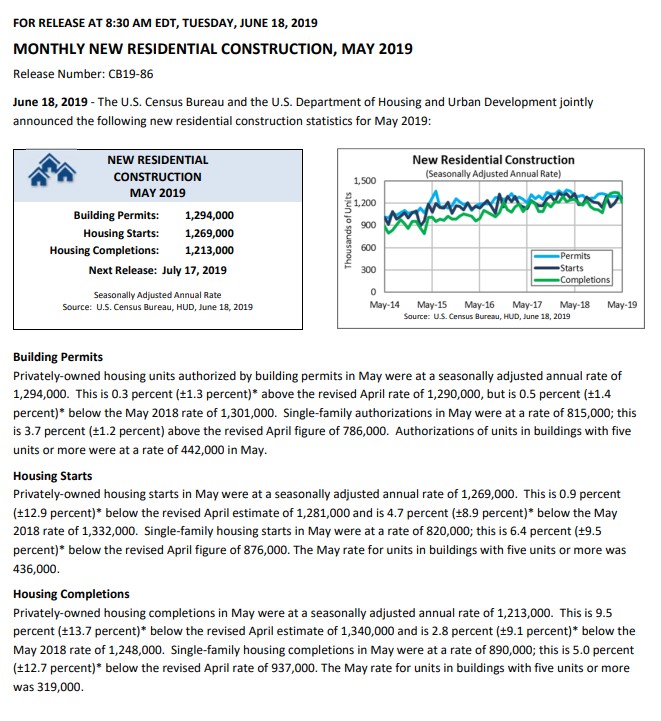


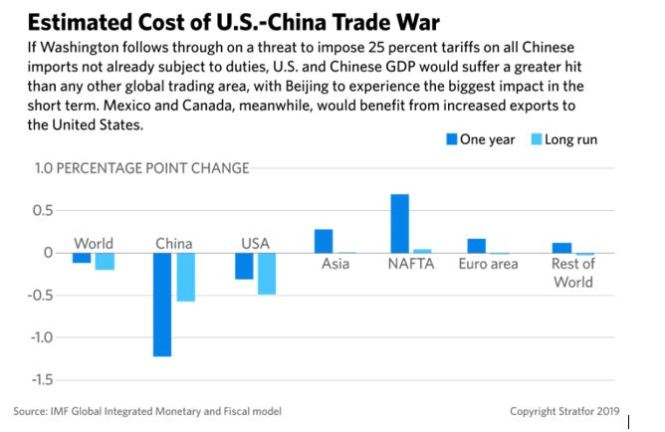
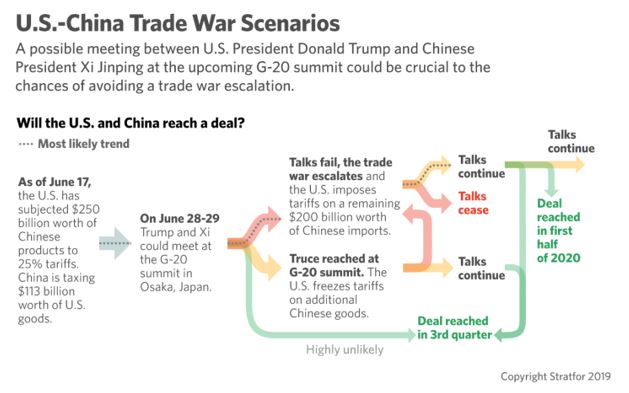
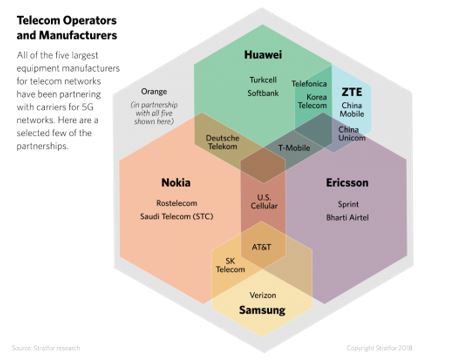


 Key Trends for the QuarterMore InformationChina Hunkers Down for an Economic StormTime is running out for the United States and China to call another trade cease-fire ahead of the G-20 summit in Japan in late June, and both sides appear to be digging their heels in for the long fight. In an extreme and very plausible scenario in which the United States follows through with threats to impose additional 25 percent duties on nearly all remaining Chinese imports, China could suffer a 1 percent hit to its gross domestic product (GDP) and millions of job losses over the next two years. If the White House and Beijing fail to reach a truce,
  China will also boost domestic infrastructure spending and even employ risky property stimulus measures in rural areas and lower-tier cities to avoid social disruptions from unemployment ahead of the 70th anniversary of the People’s Republic’s founding. Enacting such measures also means Beijing
  Hoping to muster waning public support ahead of the Taiwanese 2020 presidential election, Taiwan’s ruling Democratic Progressive Party will lobby Washington for elevated security and diplomatic support while ramping up pro-independence narratives. Possible visits by senior U.S. Cabinet officials to Taiwan, completion of pending arms sales or a resumption of trade talks will draw Chinese military intimidation — including increased patrols and flyovers — risking escalation around the Taiwan Strait. Read more about
  Key Trends for the QuarterMore InformationIndia Grapples With Its Economy and Foreign PolicyArmed with a renewed electoral mandate, Indian Prime Minister Narendra Modi faces daunting domestic and foreign policy challenges this quarter, including a cooling economy and rising trade frictions with the United States. With quarterly GDP growth falling to a four-year low, India’s government will focus on reviving consumption by stimulating demand in the country’s vast rural hinterland and
  Key Trends for the QuarterMore InformationIndia Grapples With Its Economy and Foreign PolicyArmed with a renewed electoral mandate, Indian Prime Minister Narendra Modi faces daunting domestic and foreign policy challenges this quarter, including a cooling economy and rising trade frictions with the United States. With quarterly GDP growth falling to a four-year low, India’s government will focus on reviving consumption by stimulating demand in the country’s vast rural hinterland and
 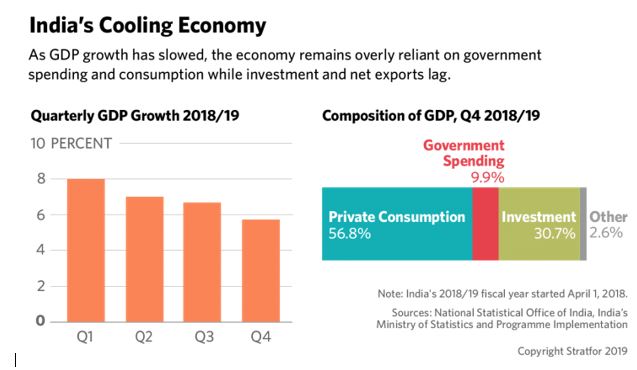 India’s relationship with the United States presents a major foreign policy challenge for New Delhi. When it comes to dealing with Washington’s trade demands — specifically, lower tariffs to grant better access to U.S. firms exporting to India — New Delhi has limited retaliatory options. It will, therefore, avoid escalating the ongoing trade dispute beyond tit-for-tat measures — such as imposing $235 million in retaliatory tariffs — against the United States, which is India’s largest export market. The fate of the dispute will ultimately depend on the White House and whether it chooses to launch a Section 301 investigation into Indian tariffs that it complains are too high. For India, trade tensions with the United States heighten the importance of entering regional trade blocs such as the Regional Comprehensive Economic Partnership (RCEP), a grouping of 16 countries, including China (though disagreements over market access between New Delhi and Beijing persist).
 If, however, a deal eludes both parties this quarter, it will be because of the fundamental disagreement over the sequencing of their respective demands: The Taliban will insist that the United States first announce a withdrawal of forces, whereas Washington will demand a Taliban cease-fire, counterterrorism pledge and commitment to hold talks with the Afghan government. Iran could
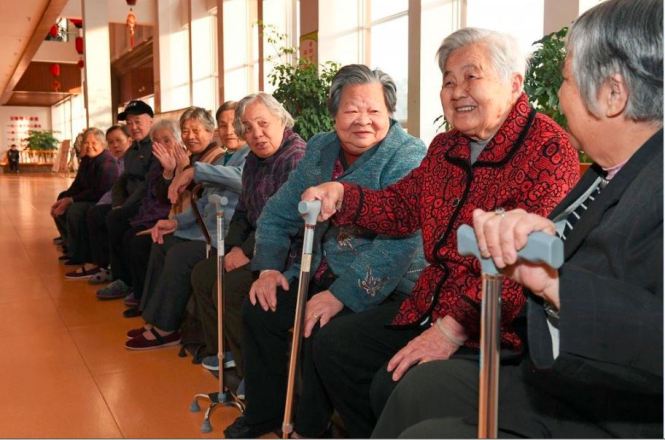

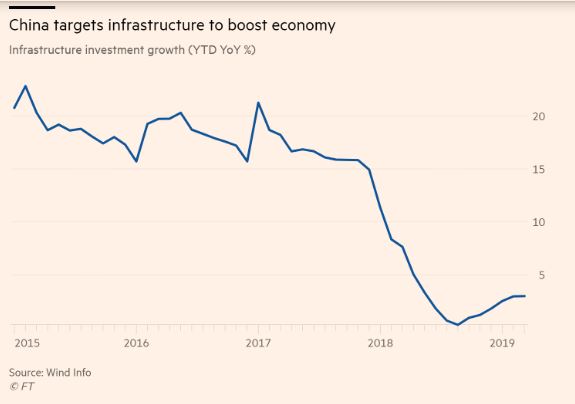 Along with the real-estate industry, government-led investment in areas such as transport and utilities has been a key driver of growth in the modern Chinese economy, accounting for more than a quarter of total investment activity this year.
 The danger of such a policy is that local governments would be emboldened to borrow more. Although the joint announcement was explicit in its warning to keep debt levels under control, local governments will be forced to tread a very fine line.
 June 20, 2019
 Wood Frame Construction Technology (WFC) has officially been recognized for the first time by China’s Green Building Evaluation Standard as a viable solution for the country’s green building credit rating. This is another milestone for WFC in China on the government regulations front after a series of prefabrication policies favourable to wood has been published in the past few years.
 However, total floor area completed in 2018 was flat (4,135 million sq. m, down 1.3% from 2017), of which 2,784 million sq. m (-0.7%) was residential.
 By
By 
 Canada Wood Today | The Canada Wood GroupSummary Review of 2018 Japan Housing Starts
 By
By  By
By 


 In 2018, the number of wood building starts and permits decreased by 15.1% and 26% respectively. This was due to the overall slowdown of the housing market together with the more stringent requirements for seismic design on small scale buildings and soundproof floor requirement in Dagagu house.
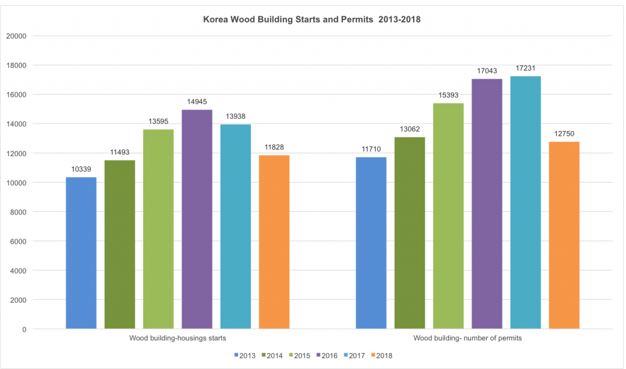
 Vietnam, a rising star in wood exports
 17th Jun 19, 9:16amby

 Ocean FreightOcean freight rates from New Zealand to China have increased +US$2-3 for vessels on shorter term charter. Congestion at New Zealand ports is adding costs of up to +US$2-3 per JAS m3 at times. There is often 6-8 log vessels waiting at Tauranga Port for a berth. Freight rates to India have been relatively stable with rates holding at US$34-36 per JAS m3.
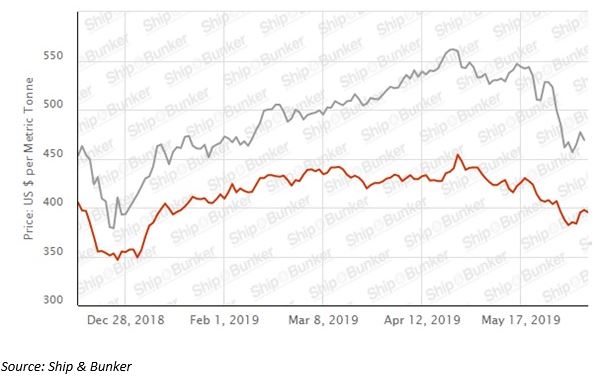
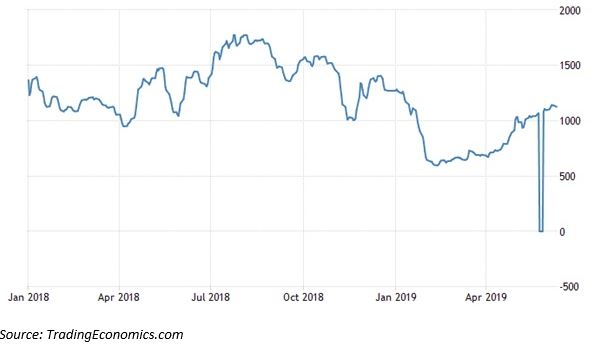 Due to the drop in the AWG log prices the PF Olsen Log Price Index for June decreased $2 to $128. The index is currently $1 below the two-year average, $2 above the three-year average, and $10 higher than the five-year average.

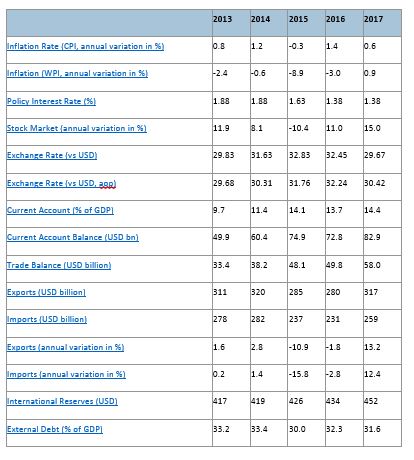

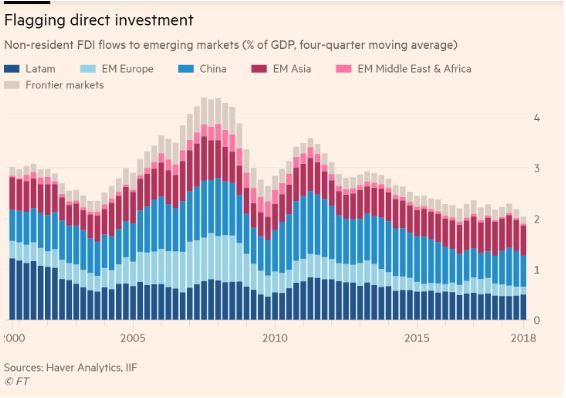

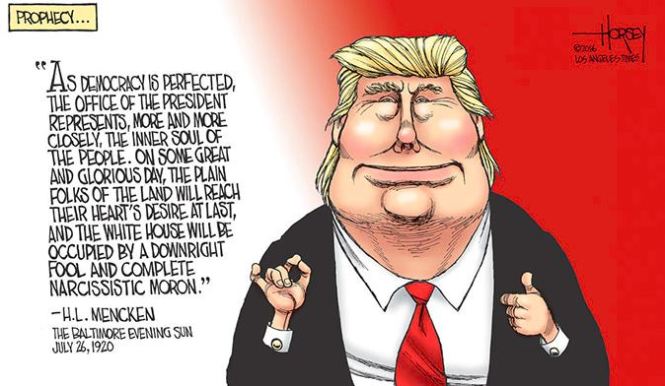


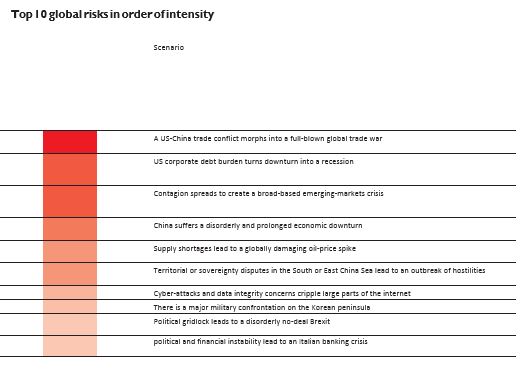

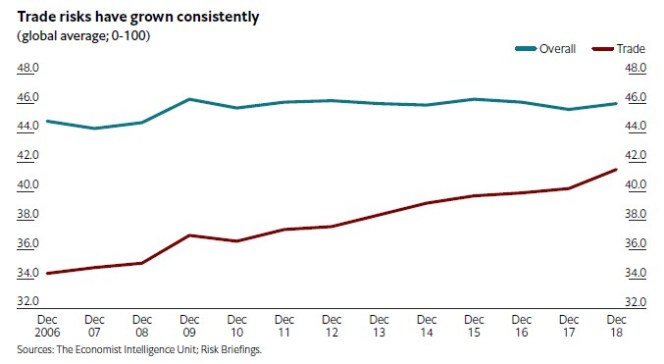
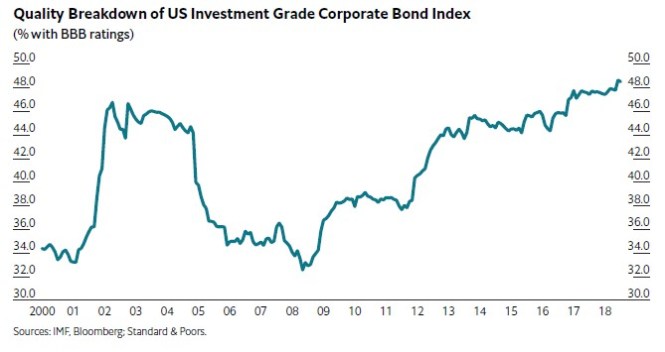


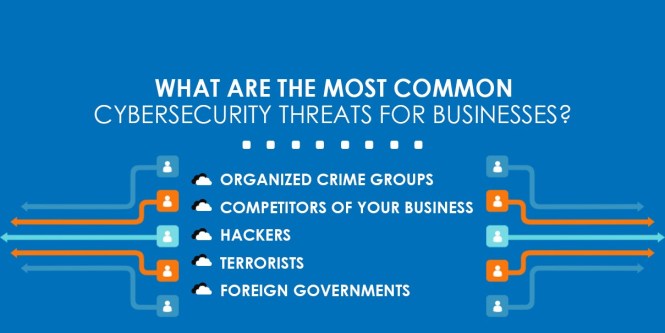


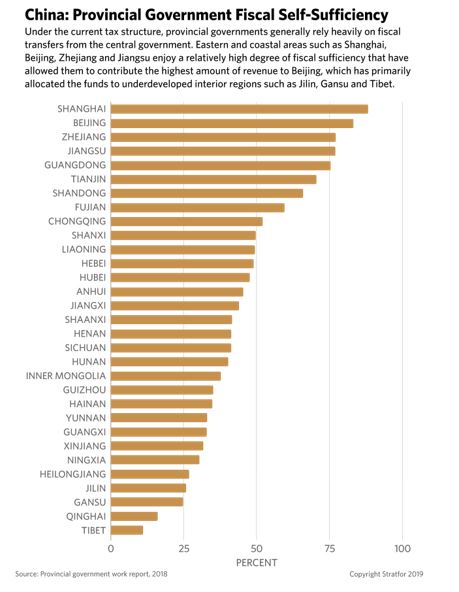
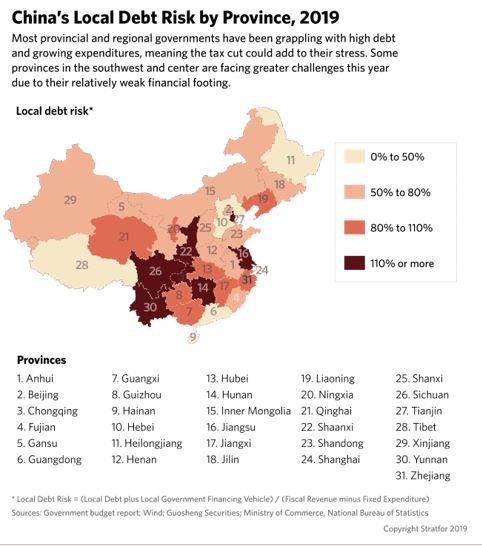
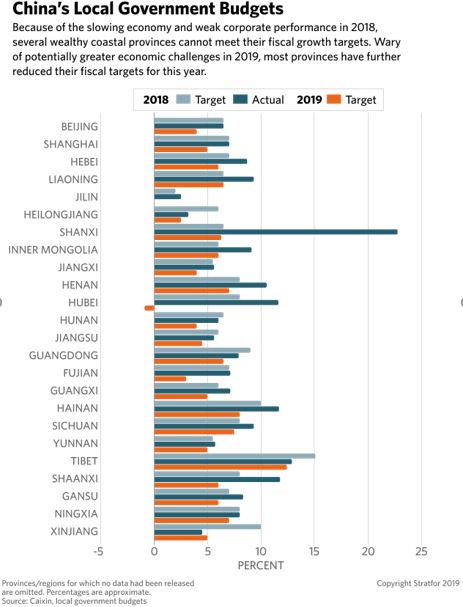


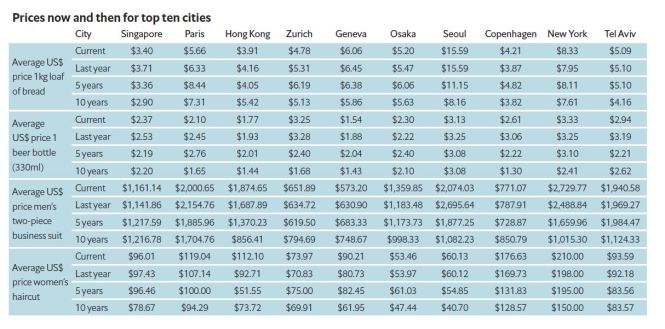


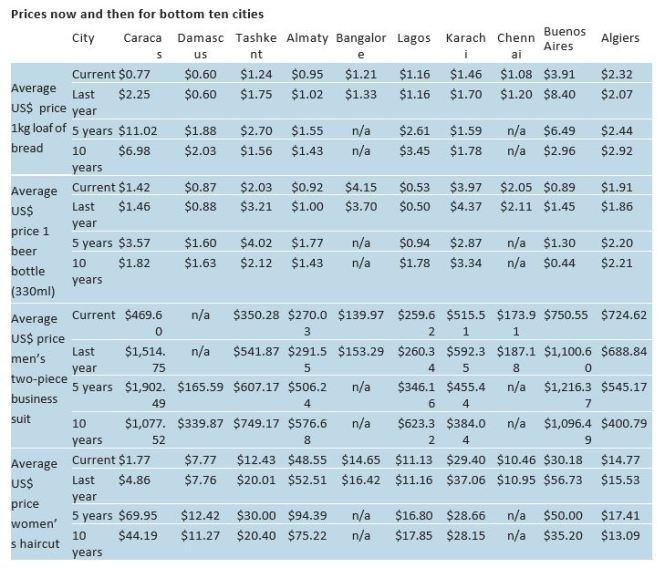
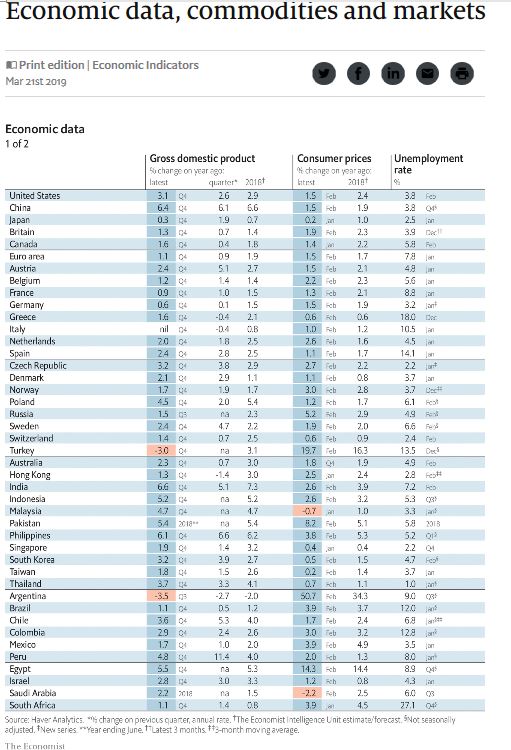


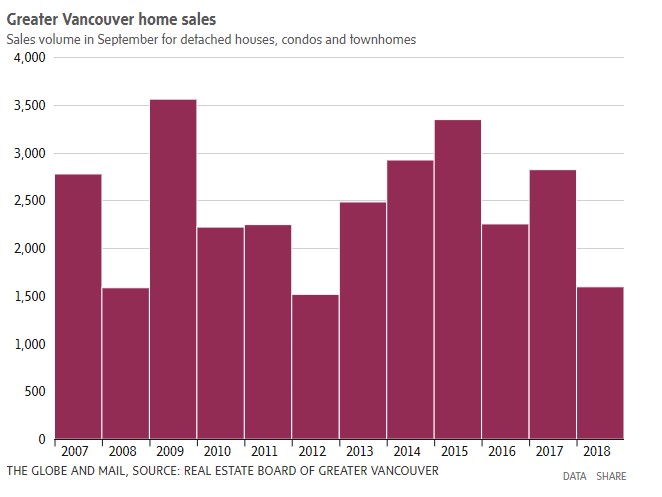

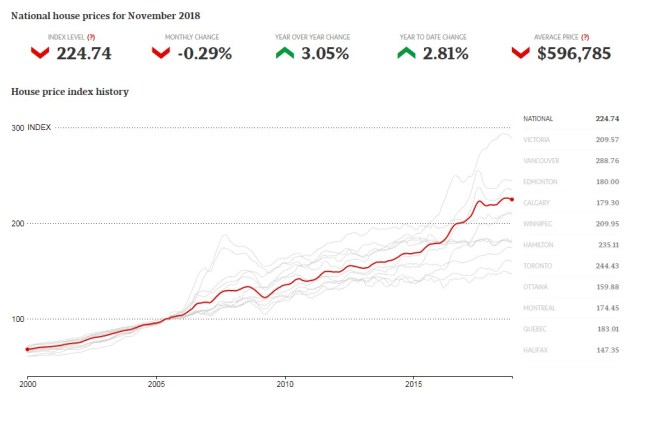

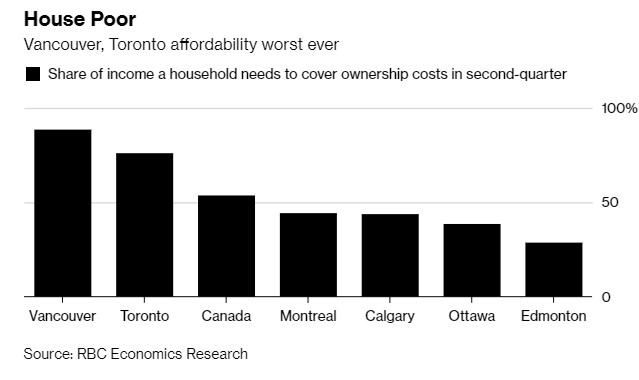
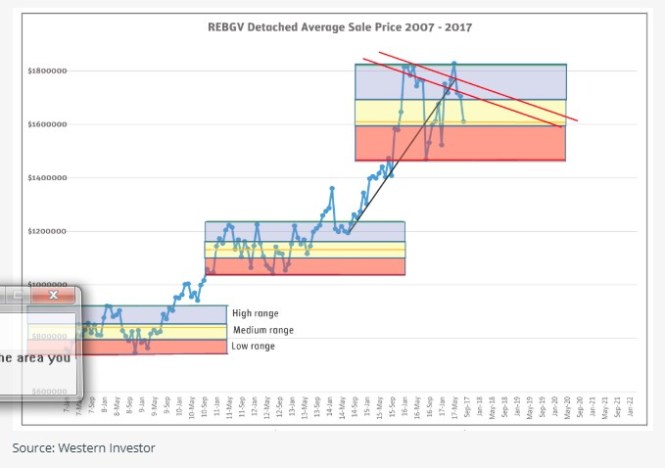


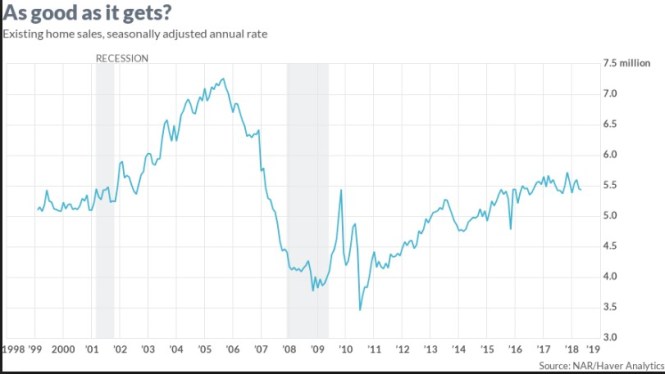


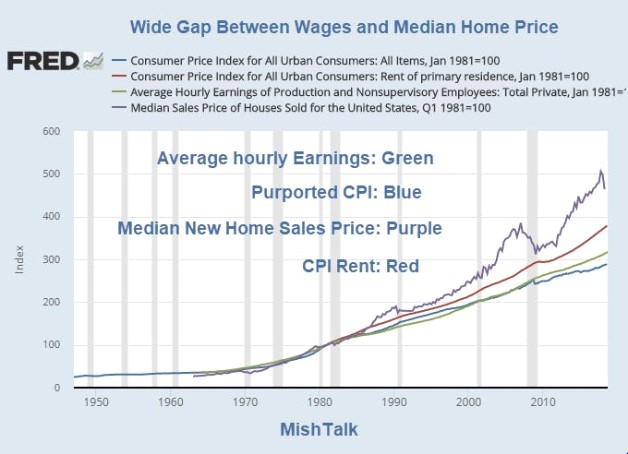
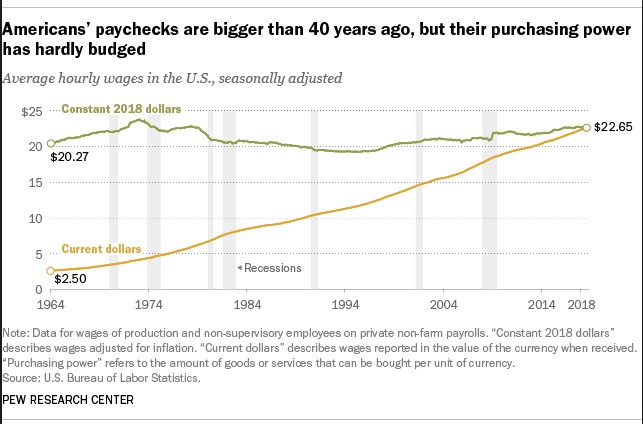
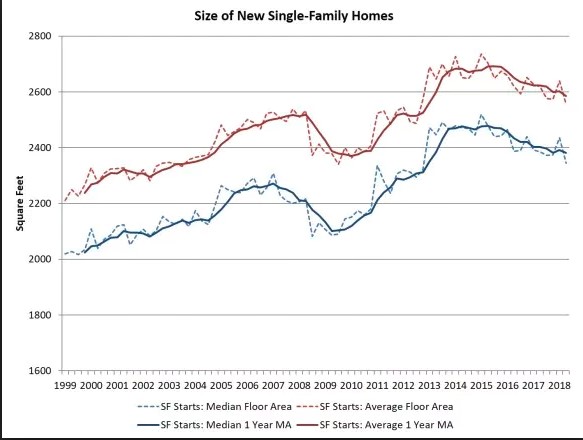


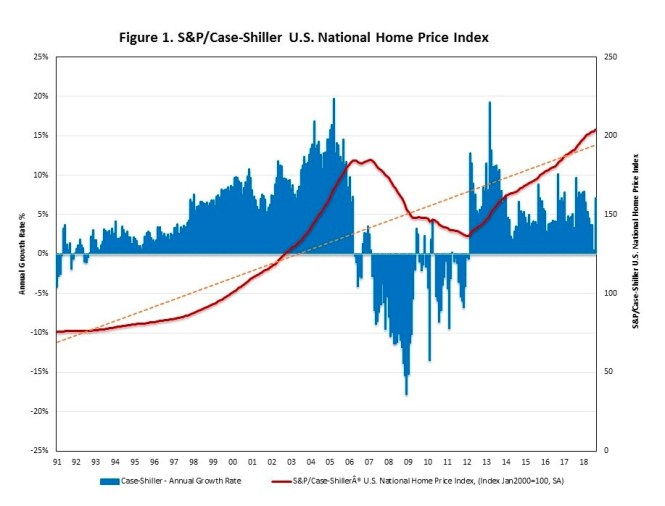

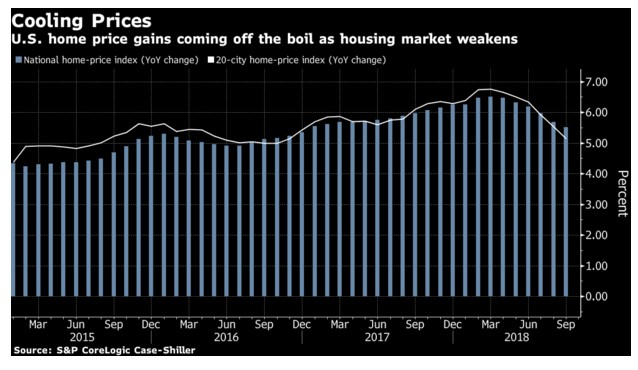
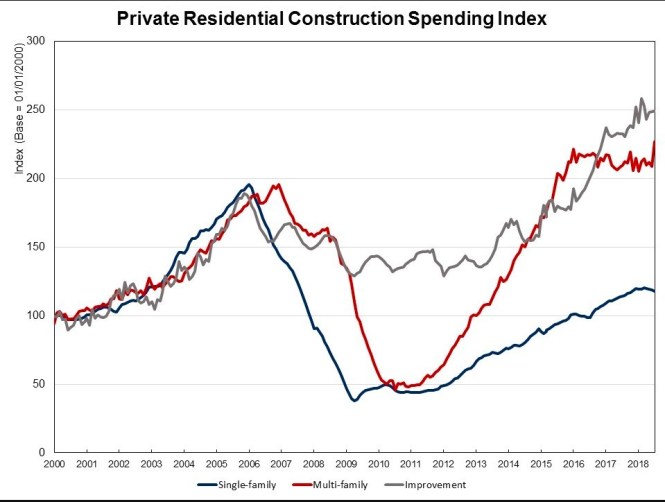
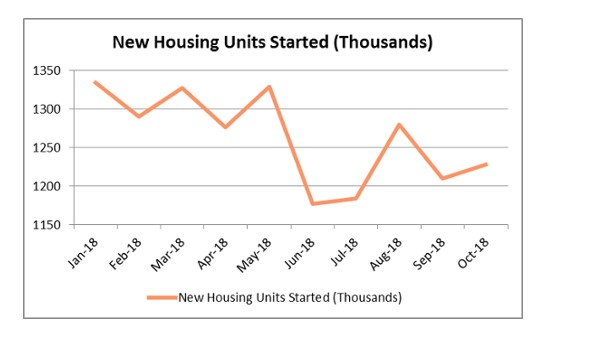


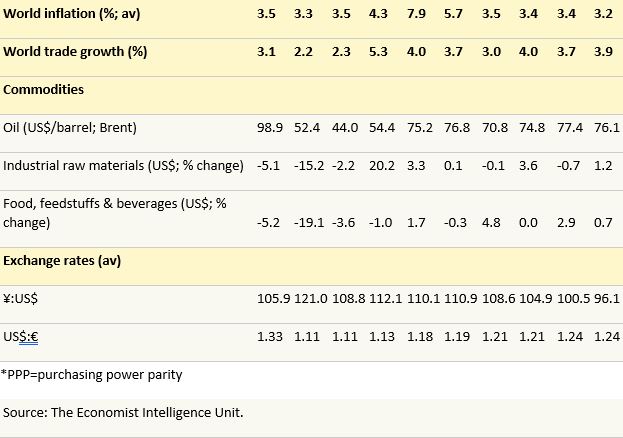


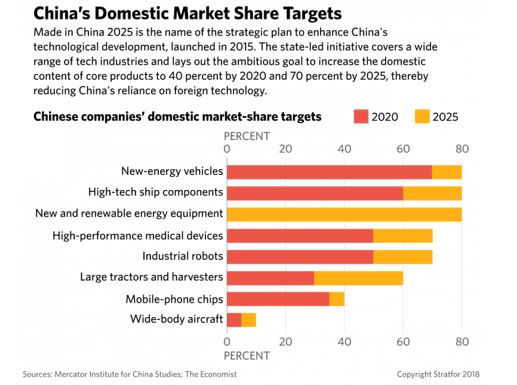


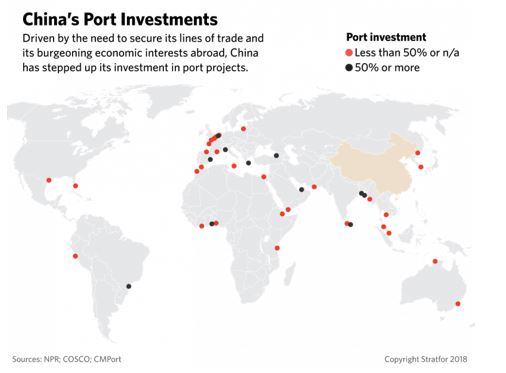


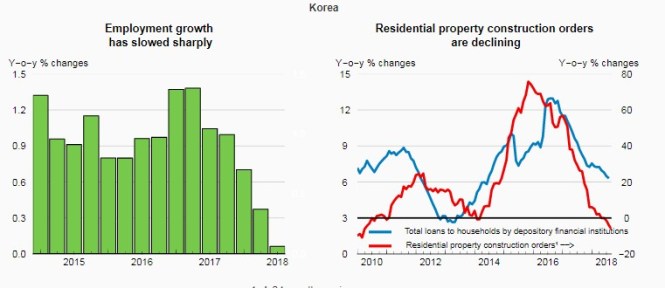


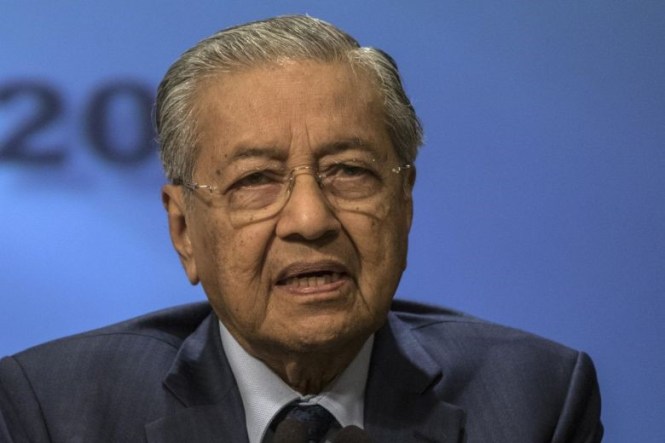


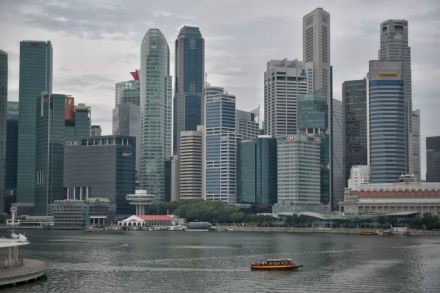


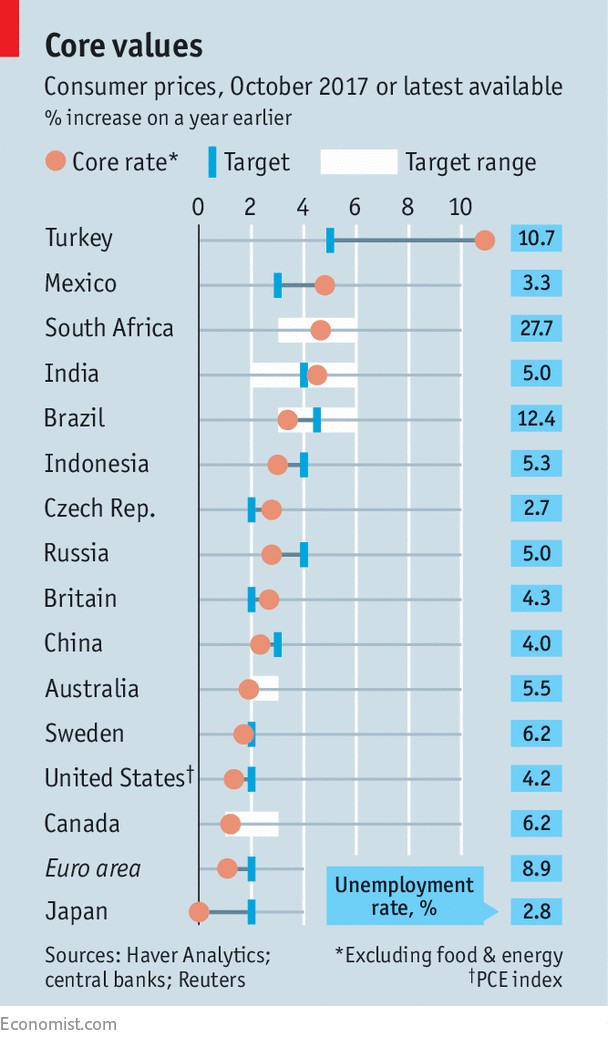

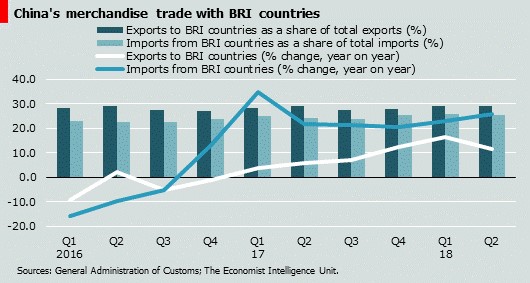


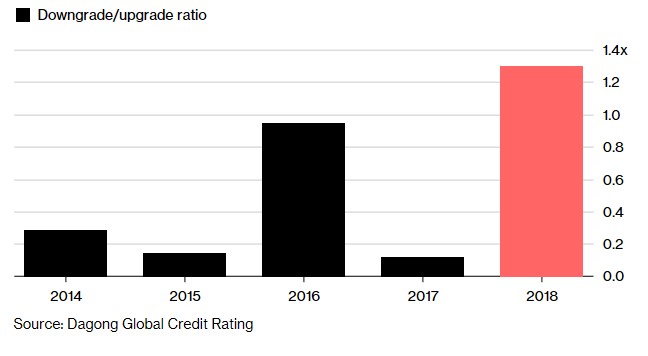

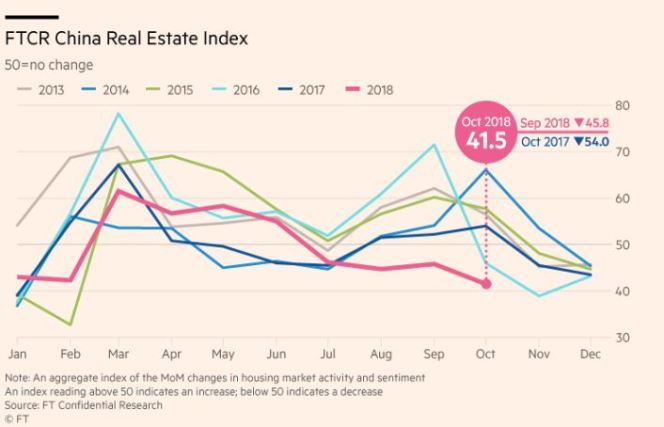


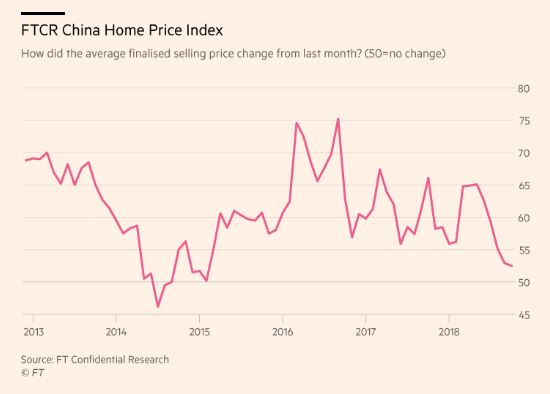
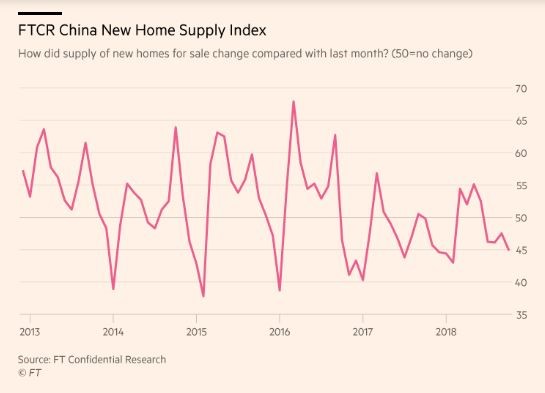
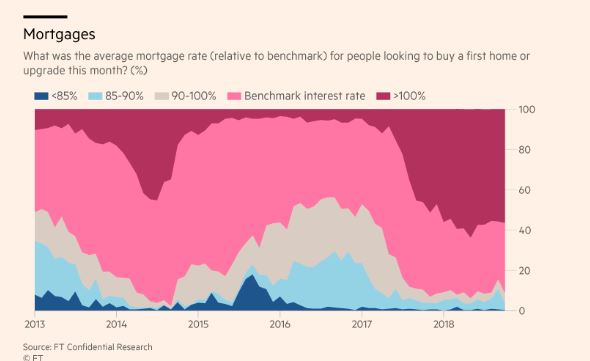
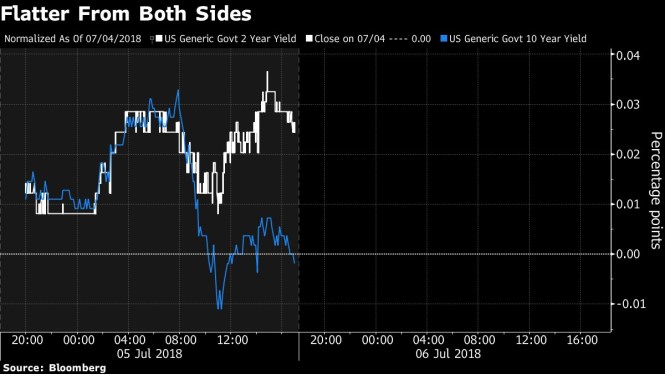


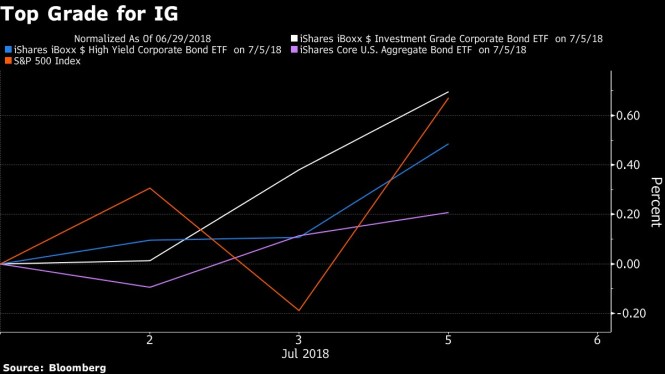

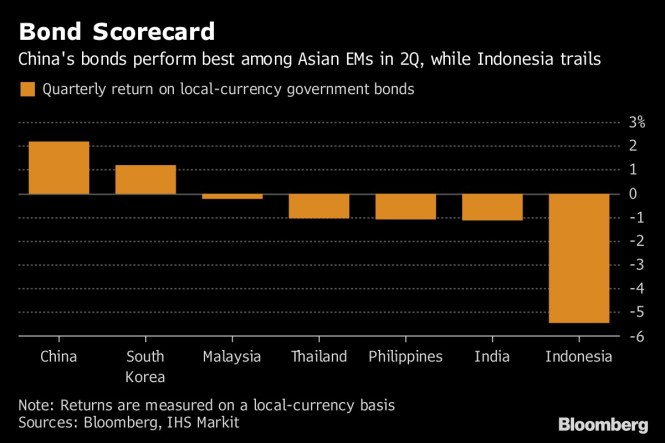


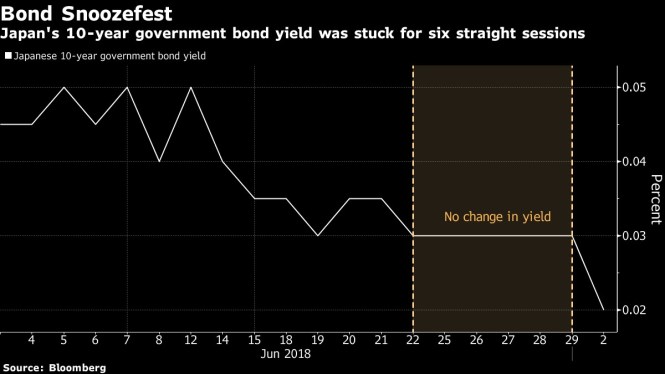
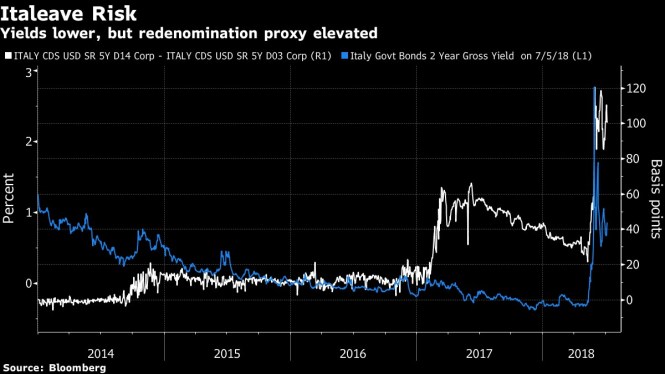
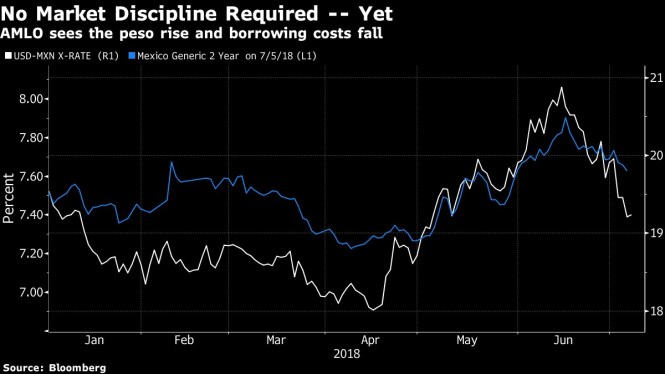
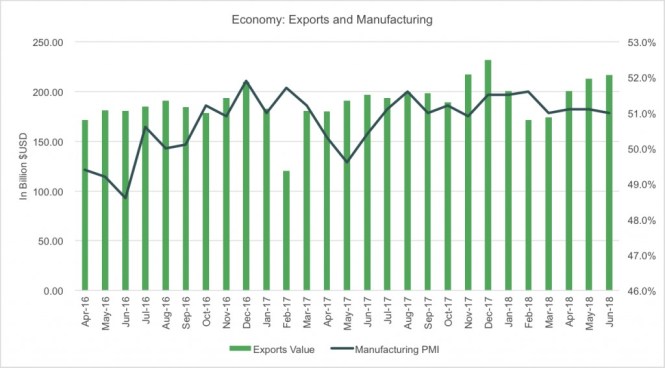


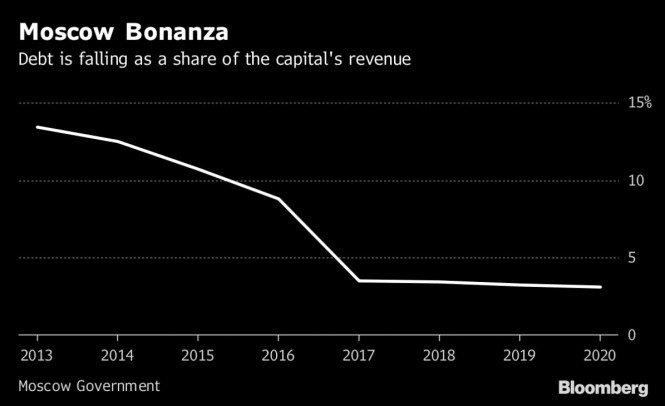
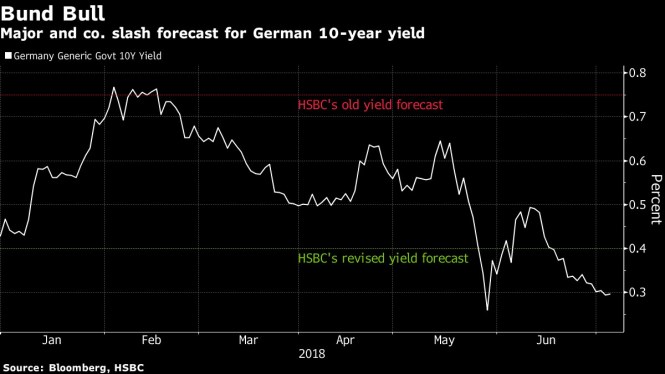

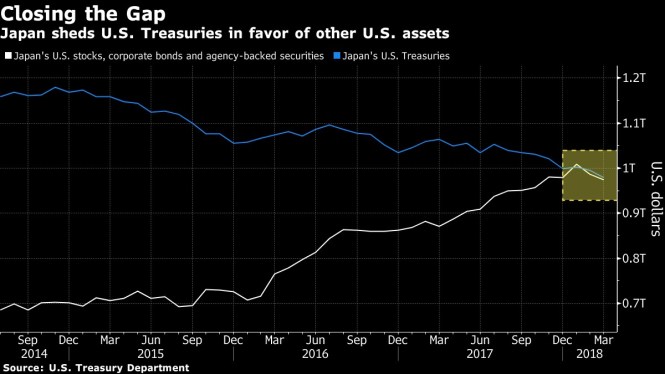


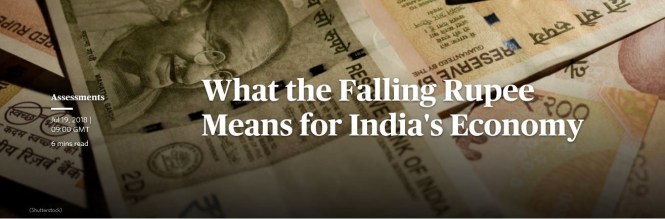

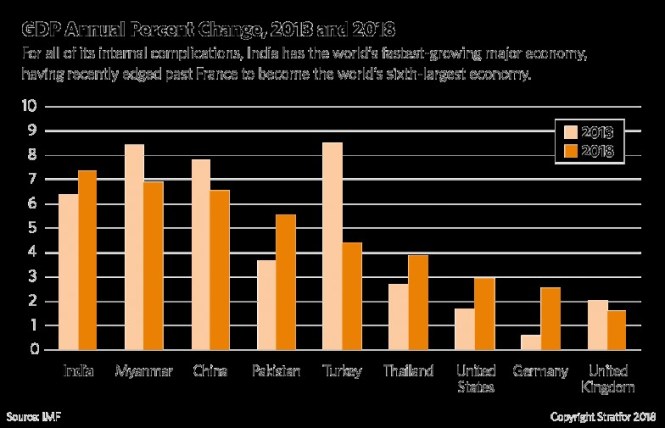
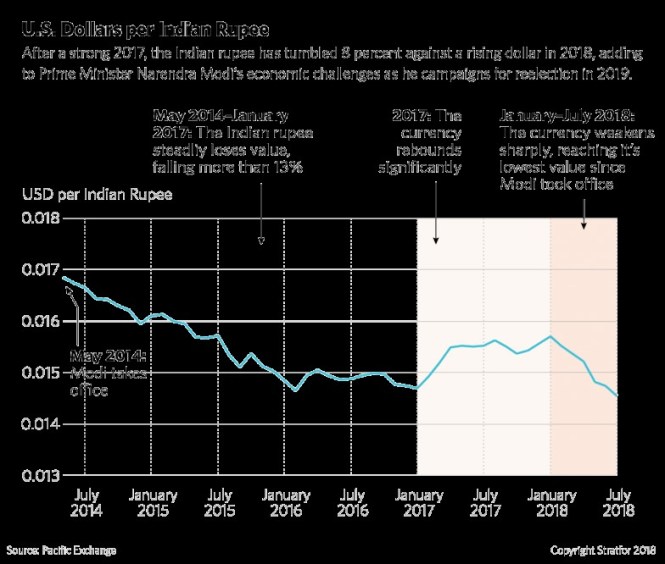
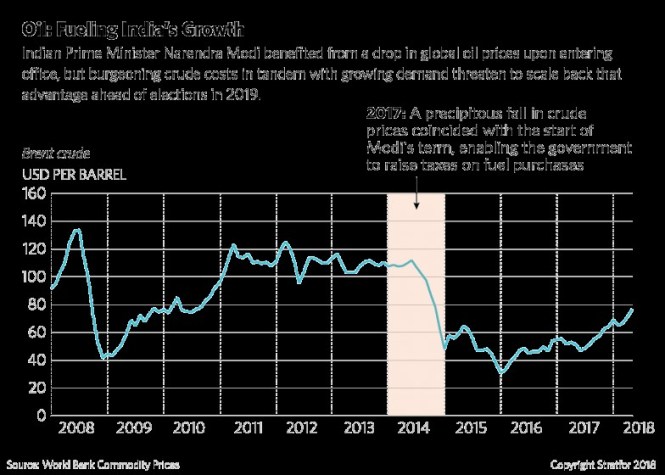
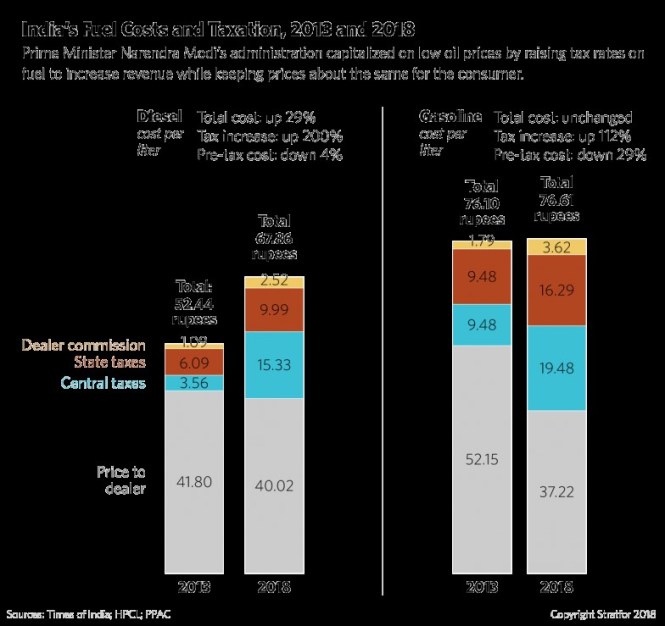


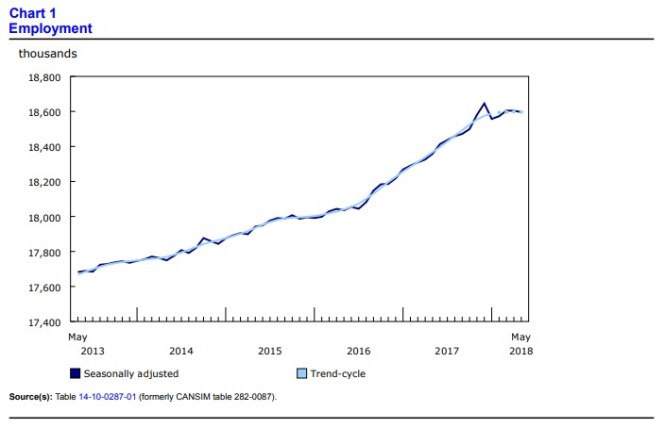

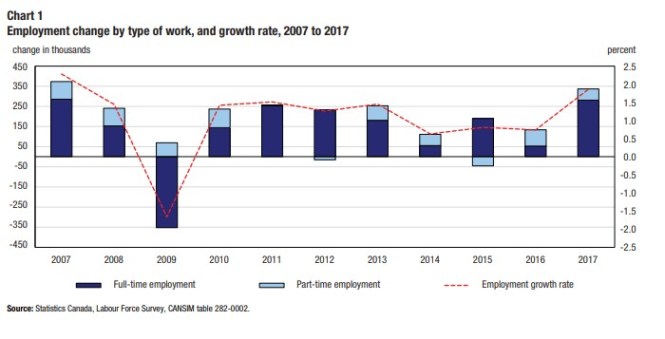
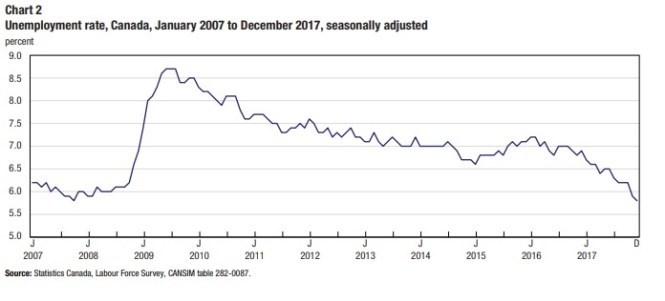


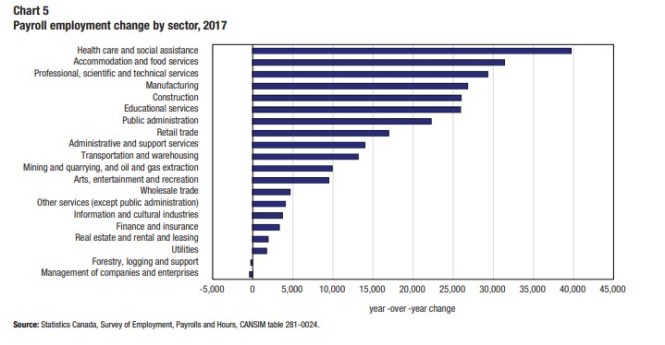
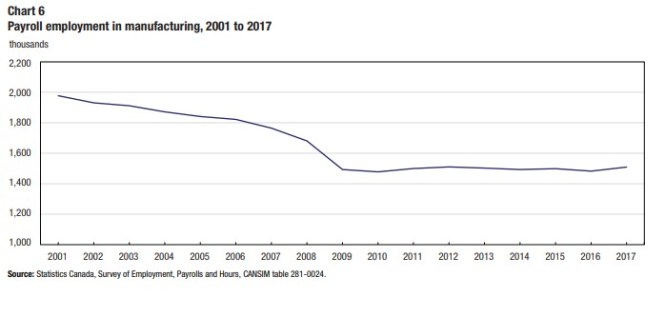
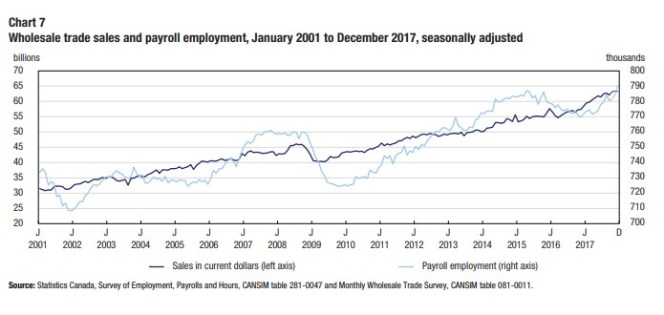
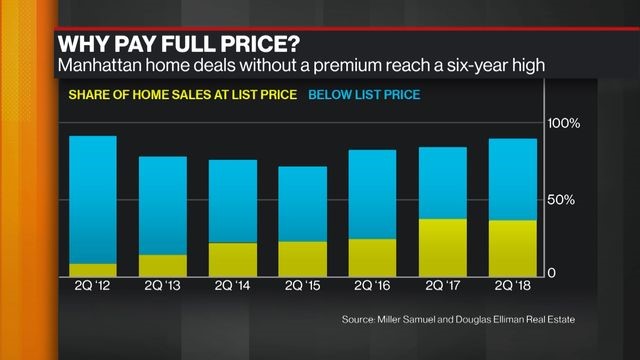
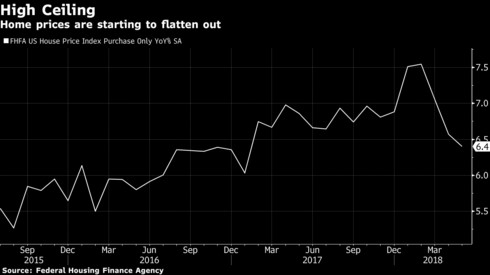
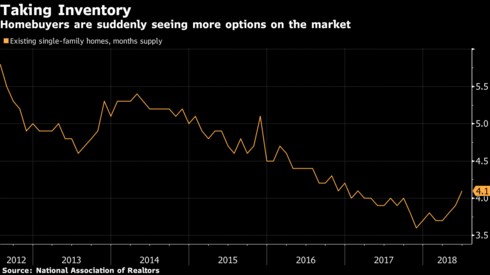


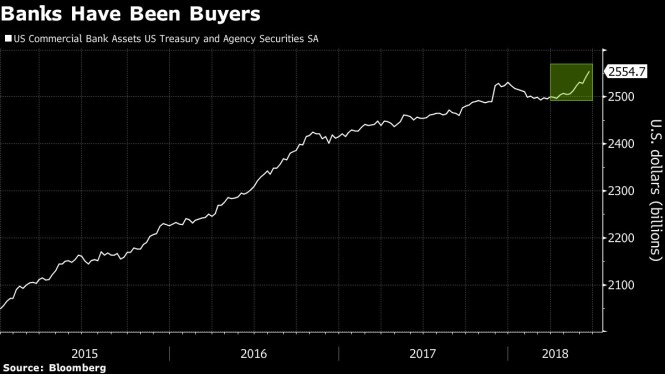


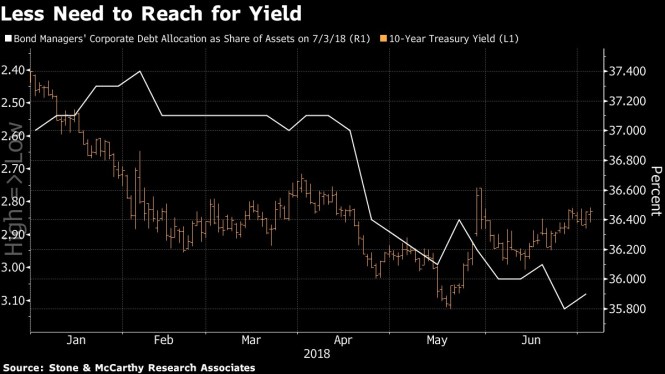


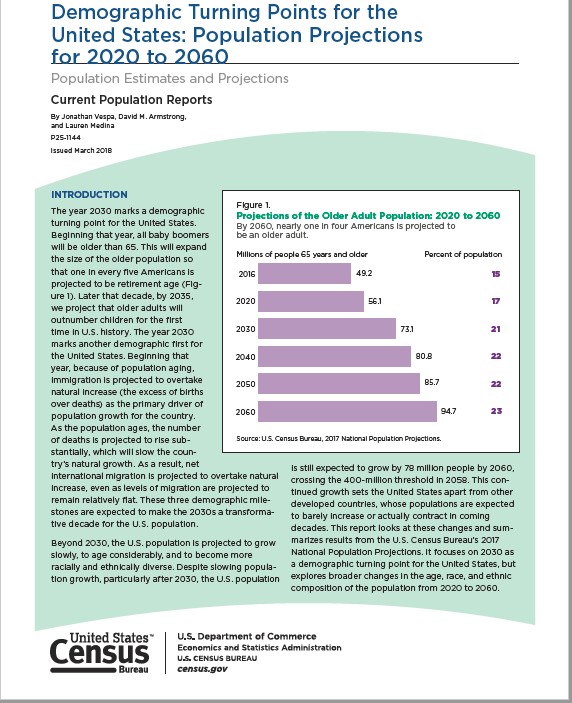


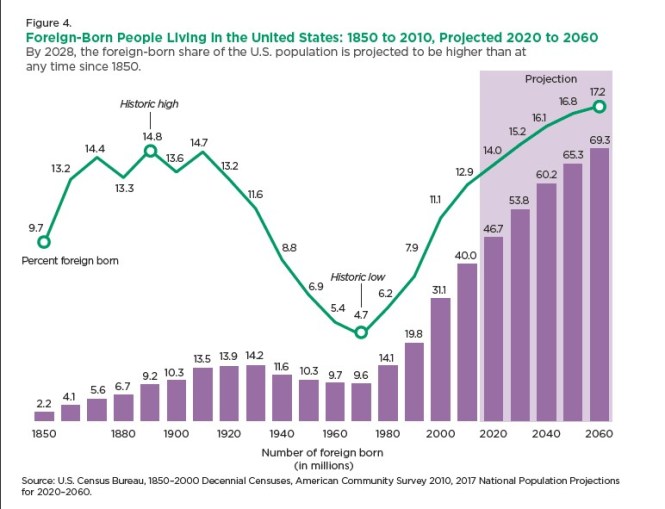


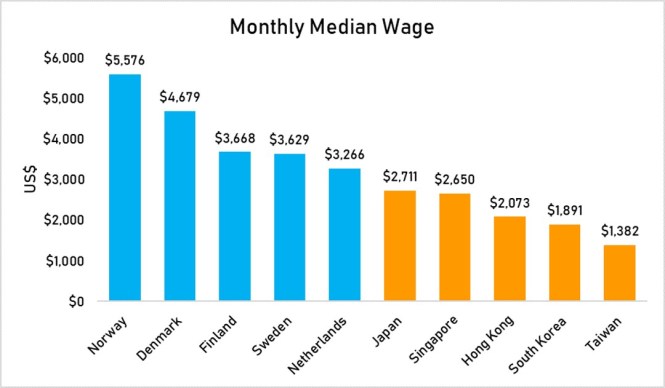
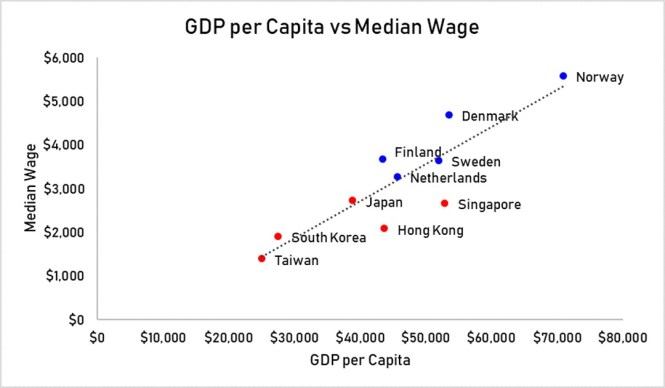

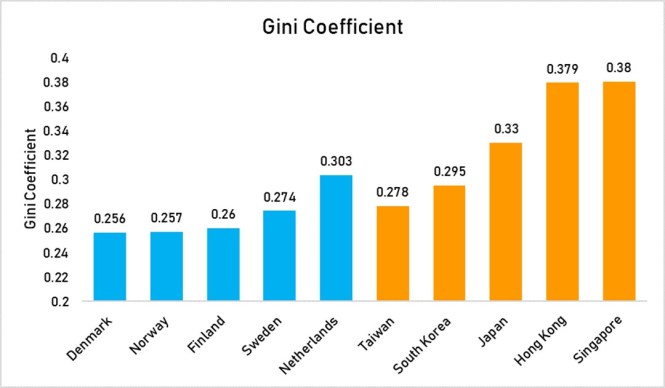
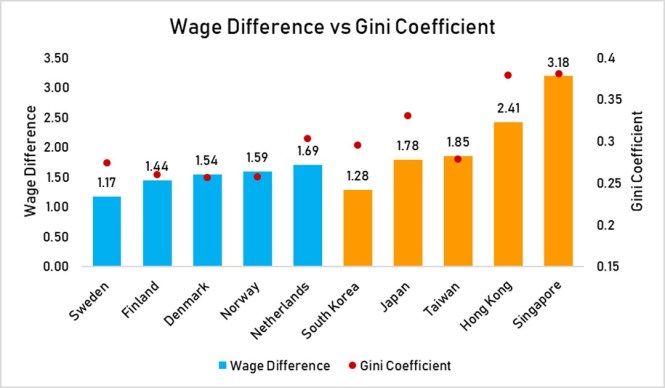

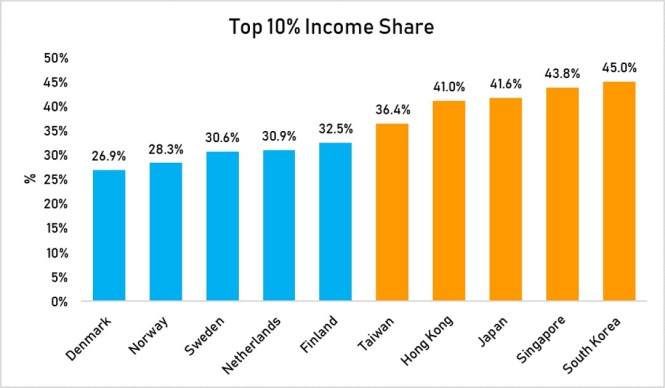


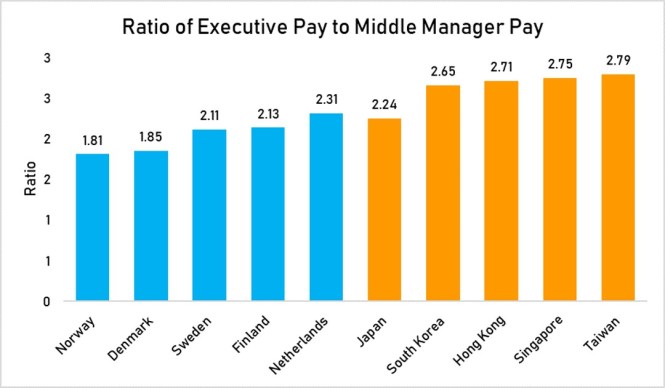
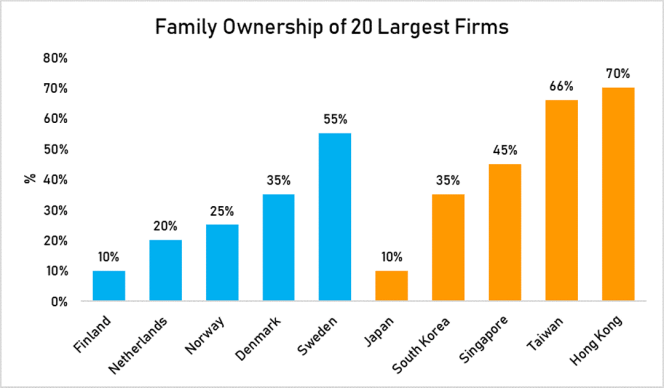
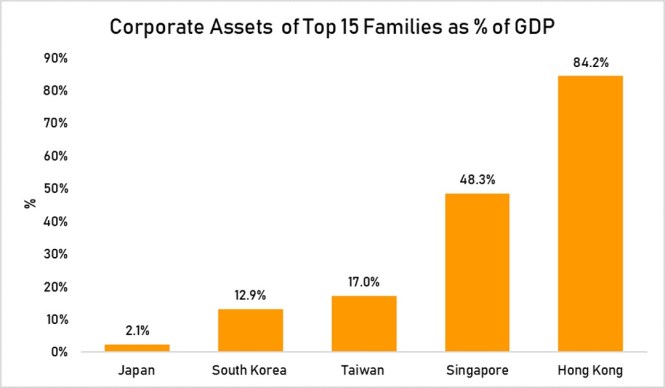


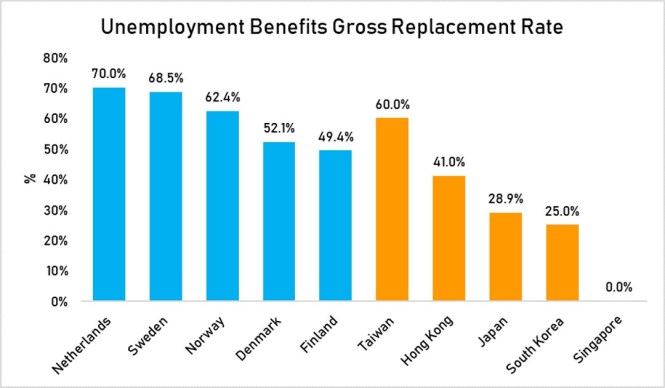
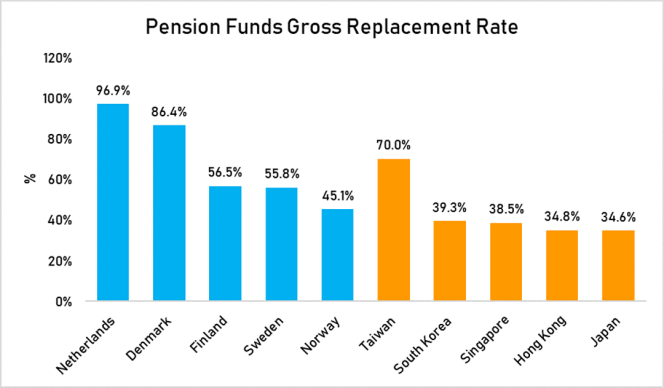
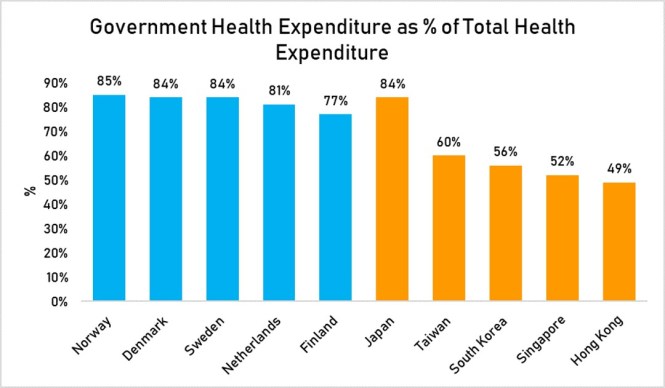


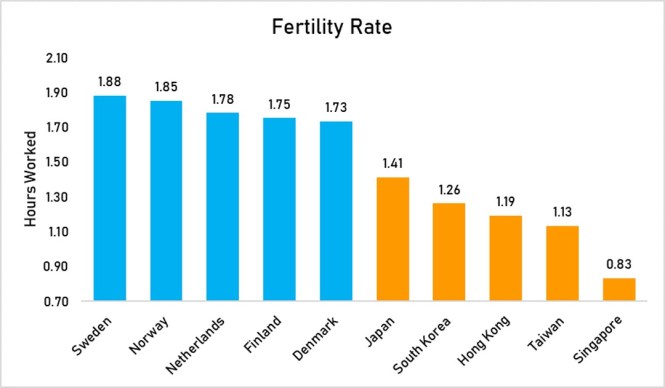
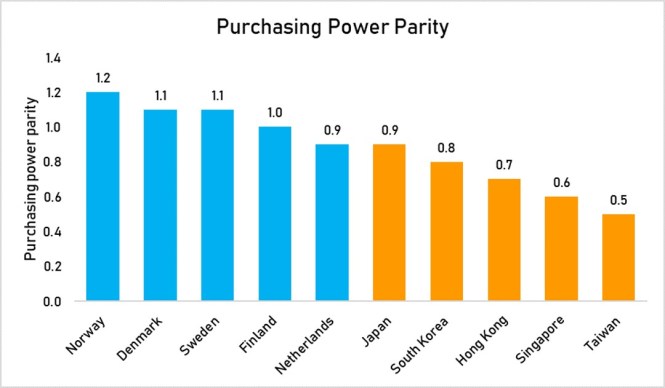
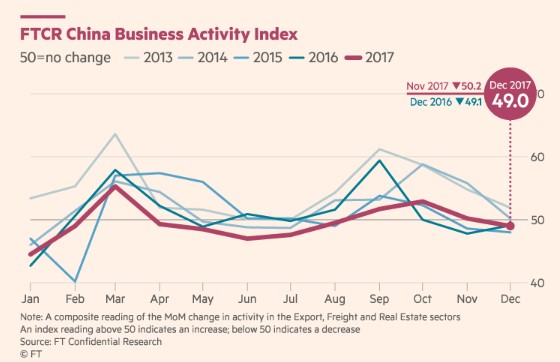
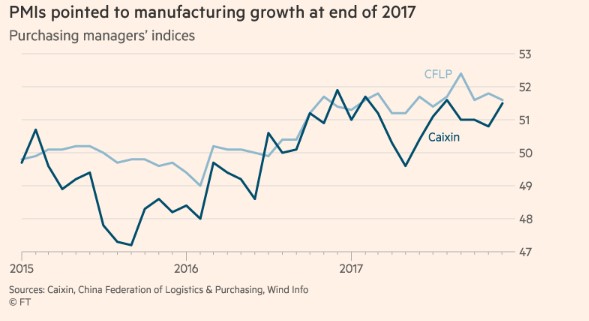
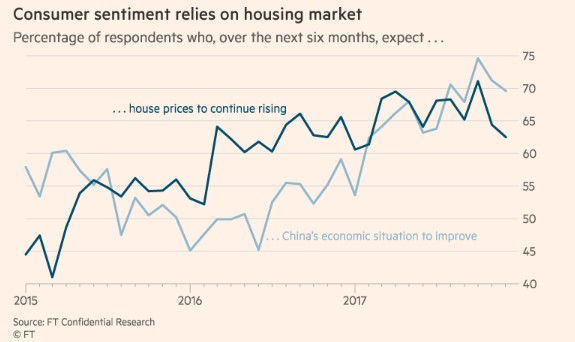


 Managing Director, Canada Wood China
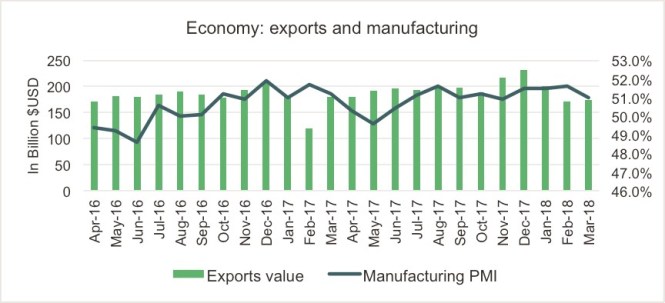
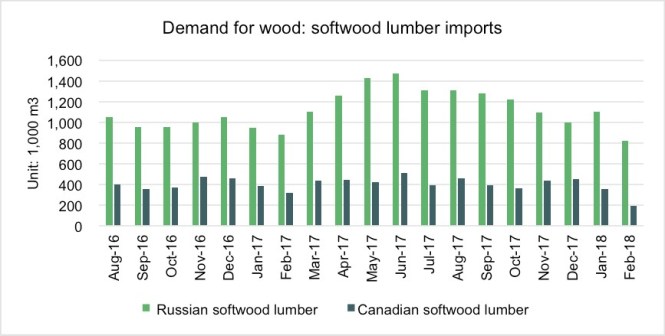
 Technical Director, Canada Wood Korea