Canadian Housing News
CREA cuts home sales forecast, May sales fall 16.2 per cent from year before
The Canadian Press
Published June 15, 2018 Updated June 15, 2018
The Canadian Real Estate Association is lowering its national home sales forecast for this year because of weaker sales in B.C. and Ontario.
The industry association, which represents about 100,000 real estate agents across Canada, said Friday it now expects home sales this year to fall 11 per cent compared with a year ago to 459,900 units in 2018. The prediction compared with a forecast for a 7.1-per-cent decline the association released in March.
“The decrease almost entirely reflects weaker sales in B.C. and Ontario amid heightened housing market uncertainty, provincial policy measures, high home prices, ongoing supply shortages and this year’s new mortgage stress test,” the association said in a statement.
The updated forecast came as CREA reported actual home sales in May hit a seven-year low as they fell 16.2 per cent compared with a year ago.
The national average price for homes sold in May was slightly more than $496,000, down 6.4 per cent from a year ago. Excluding the Greater Toronto and Greater Vancouver areas, the average price was a shade more than $391,100, down 2 per cent.
This drop in sales activity capped off a lackluster spring home-buying season, as March, April and May are typically the most active months in any given year. National home-sales activity in March and April were down 22.7 per cent and 13.9 per cent, respectively, according to CREA numbers.
Combined sales for the three-month period fell to a nine-year low, CREA said Friday.
Factors weighing on home sales include new government measures introduced in B.C. and Ontario, such as a foreign-buyers tax, as well as interest-rate hikes by the Bank of Canada.
The association on Friday again pointed the finger at a new stress test introduced at the beginning of the year for uninsured mortgages, which has cut the amount that certain home buyers are able to qualify for.
“The stress test that came into effect this year for home buyers with more than a twenty per cent down payment is continuing to suppress sales activity,” said CREA president Barb Sukkau, in a statement. “The extent to which it is sidelining home buyers varies among housing markets and price ranges.
As of Jan. 1, the Office of the Superintendent of Financial Institutions requires buyers who don’t need mortgage insurance to prove they can make payments at a qualifying rate of the greater of two percentage points higher than the contractual mortgage rate or the central bank’s five-year benchmark rate.
The bar was raised even higher in May, when the central bank’s five-year benchmark rate rose from 5.14 per cent to 5.34 per cent. The Bank of Canada uses the posted five-year fixed mortgage rates at the Big Six banks to calculate the benchmark rate. The central bank’s benchmark rate increased, in turn, after all the Big Six banks raised their posted five-year fixed mortgage rates in the preceding weeks, reflecting the higher borrowing costs associated with a recent rise in government bond yields.
“This year’s new stress-test became even more restrictive in May, since the interest rate used to qualify mortgage applications rose early in the month,” said Gregory Klump, CREA’s chief economist, in a statement Friday. “Movements in the stress test interest rate are beyond the control of policy makers. Further increases in the rate could weigh on home sales activity at a time when Canadian economic growth is facing headwinds from U.S. trade policy frictions.”
CREA’s latest figures support the notion that markets are stabilizing after the volatility at the beginning of 2018 related to the tightened mortgage rules introduced on Jan. 1, said TD economist Rishi Sondhi.
“On balance, this was a better-than-expected report. Sales were effectively flat during the month – their best turnout so far this year. Meanwhile, listings increased for the third time in four months, pointing to somewhat improved confidence on the part of sellers as prices edged higher for the second straight month.”
- Summary
- National data
- City and neighbourhood data
Canada’s home prices gain a little ground
Canada’s home prices gained ground in June with a 0.9 per cent increase from May, according to the latest data from the Teranet-National Bank House Price Index.Marc Pinsonneault, senior economist at National Bank of Canada, says that, while impressive at first glance, the gain was the third smallest for June in the past 14 years.
The composite index of 11 metropolitan markets is now barely above its previous peak in August of 2017, the economist points out.
In June, prices rose compared with May in 10 of the 11 markets surveyed. The leader was Ottawa-Gatineau with a two per cent jump, followed by Hamilton with a 1.8 per cent gain, and Edmonton with a 1.5 per cent increase. The Victoria index rose 1.3 per cent; Toronto added 1.2 per cent; and Halifax, one per cent.
The average sale price of all the housing types in the cross-country index was $546,562 last month.
The composite index, which charts price trends based on a large sample of the property deals registered at land title offices, now stands at 223.82.

Mr. Pinsonneault adds that when seasonal patterns are stripped out, the index has essentially remained stable in the past three months. Carolyn Ireland

Canadian Housing Snippets

Labour Force Survey, May 2018 Released at 8:30 a.m. Eastern time in The Daily, Friday, June 8, 2018
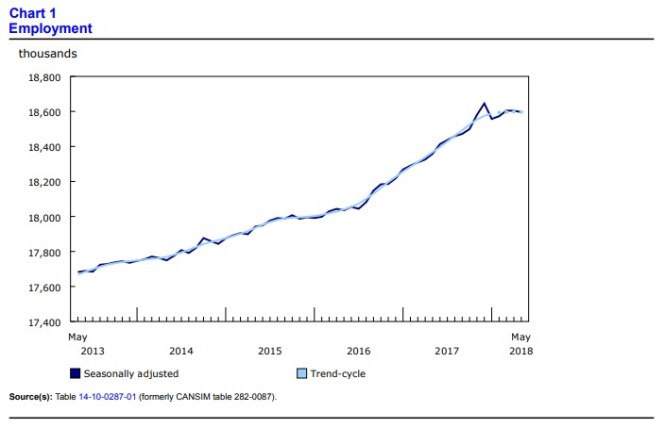
Employment was little changed in May, and the unemployment rate was 5.8% for the fourth consecutive month. On a year-over-year basis, employment grew by 238,000 or 1.3%, due to gains in full-time work. Over the same period, total hours worked were up 2.0%.
Highlights In May, employment decreased for people in the core working ages of 25 to 54. It increased for people aged 55 and older and was little changed among youth aged 15 to 24. Employment increased in Prince Edward Island, while it decreased in British Columbia and Nova Scotia. There was little change in the other provinces. There were employment increases in four industries in May: accommodation and food services; professional, scientific and technical services; transportation and warehousing; and finance, insurance, real estate, rental and leasing. At the same time, employment declined in health care and social assistance, manufacturing, construction, and “other services.” There was little change in the number of employees in both the private and public sectors, as well as the number of self-employed workers

Employment decreases for core age population
For people in the core working ages of 25 to 54, employment fell among both men (-19,000) and women (-19,000).
The unemployment rate for men in this age group held steady at 5.0%, while it increased by 0.2 percentage points to 4.9% for women.
In the 12 months to May, employment among core-aged men grew by 33,000 (+0.5%), the slowest year-over-year growth for this group since November 2016. Employment increased by 40,000 (+0.7%) for core-aged women on a year-over-year basis.
Among people aged 55 and older, employment increased by 29,000 in May, bringing year-over-year gains to 173,000 (+4.5%). The unemployment rate for this age group fell 0.2 percentage points in the month to 5.1%.
Employment was little changed among youth aged 15 to 24 on both a monthly and year-over-year basis. The unemployment rate for this age group held steady at 11.1% in May.
Employment little changed in most provinces
Employment in Prince Edward Island increased by 800 in May, while the unemployment rate fell by 1.9 percentage points to 9.3%. Compared with 12 months earlier, employment in the province was little changed.
In British Columbia, employment fell by 12,000 in the month. For the first time since May 2015, employment in British Columbia recorded virtually no growth on a year-over-year basis. The unemployment rate was little changed compared with the previous month, at 4.8% in May.
The number of workers in Nova Scotia was down by 3,600 in May, and the unemployment rate Increased by 0.5 percentage points to 7.2%. On a year-over-year basis, employment was little changed.
Employment in Quebec was little changed in May, as a decrease in full-time work was offset by more people working part time. The unemployment rate was little changed at 5.3%. In the 12 months to May, employment in the province increased by 65,000 (+1.6%).
In Ontario, there was virtually no change in the number of people working in May, and the unemployment rate was 5.7%. On a year-over-year basis, employment in the province was up by 126,000 (+1.8%).
The remainder of he provinces showed minimal change year to year.
Industry perspective In accommodation and food services, employment rose by 18,000 in May, driven by growth in British Columbia. Employment gains in April and May accounted for more than half of the year-over-year increase (+56,000 or +4.7%) in this industry.
Employment in professional, scientific and technical services rose by 17,000 in May, entirely due to gains in Ontario. On a year-over-year basis, employment in this industry was up by 31,000 (+2.1%).
There were 12,000 more people working in transportation and warehousing in May, bringing the year-over-year increase to 42,000 (+4.5%).
Employment in finance, insurance, real estate, rental and leasing rose by 12,000, almost entirely in Quebec. Despite this increase in the month, the number of people working in this industry was like that observed 12 months earlier.
There were 24,000 fewer people working in health care and social assistance in the month, while employment was little changed on a year-over-year basis.
Manufacturing employment was down by 18,000 in May, and was virtually unchanged compared with 12 months earlier. Employment in this industry reached a five-year peak in December 2017, and has been trending downward in 2018.
Employment in construction fell for the second consecutive month, decreasing by 13,000 in May. Employment was little changed from 12 months earlier, with recent declines offsetting gains observed in late 2017. Employment in “other services” fell by 12,000 (-1.5%) in May and was little changed on a year-over-year basis.
“Other services” includes services related to civic and professional organizations, and private households. There was little change in the number of employees and the self-employed in May. On a year-over-year basis, there were increases in the number of public sector (+84,000 or +2.3%) and private sector (+105,000 or +0.9%) employees, while the number of self-employed was little changed.
Summer employment for students From May to August, the Labour Force Survey collects labour market data on youths aged 15 to 24 who were attending school full time in March and who intend to return to school full time in the fall. The May survey results provide the first indicators of the summer job market, especially for students aged 20 to 24, as many younger students are still in school. Data for June, July and August will provide further insight into the summer job market. Published data are not seasonally adjusted, therefore comparisons can only be made with data for the same month in previous years. Compared with 12 months earlier, employment among 20- to 24-year-old students was virtually unchanged in May. The employment rate (57.0%) and unemployment rate (13.6%) for this group of students were also little changed compared with May 2017.
Annual review of the labour market, 2017 Introduction and overview
This article analyses the Canadian labour market in 2017. The focus is on national trends as well as key provincial and industrial sector changes.
In general, consistent signals across key labour market indicators pointed to a tightening of the labour market, including the fastest total employment growth in a decade and a downward trend in the national unemployment rate.
At the same time, average weekly earnings increased notably, the number of regular Employment Insurance (EI) beneficiaries declined, and the job vacancy rate increased. All these changes coincided with stronger economic growth, as the real gross domestic product grew 3.0% in 2017, following growth of 1.4% in 2016.1
The analysis in this article uses a combination of major labour market indicators from different sources. All analysis is based on annual averages, unless otherwise noted. The Labour Force Survey (LFS) is used primarily for data on unemployment and employment details for demographic groups.
The Survey of Employment, Payrolls and Hours (SEPH) is used for payroll employment by industrial sector as well as average weekly earnings and hours for employees. Data from the Job Vacancy and Wage Survey (JVWS) and from EI statistics are also used.
Fastest employment growth rate in a decade, driven by increases in full-time work
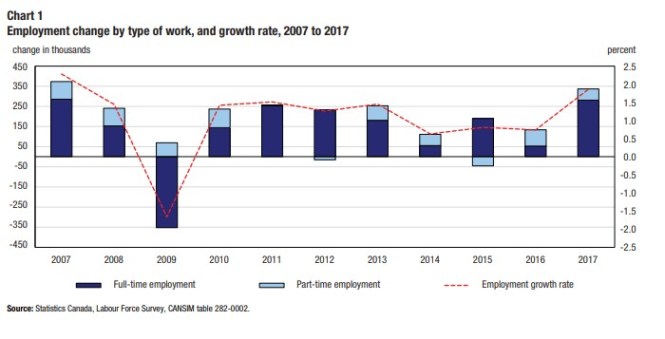
Between 2016 and 2017, total employment rose by 336,500 or 1.9%, the fastest annual rate of growth in a decade.2 This follows three years of increases below 1.0%. Most of the growth was in full-time work (+280,600 or +1.9%). Employment gains were spread across several provinces, led by Ontario, Quebec and British Columbia. At the same time, there was a notable decline in Newfoundland and Labrador. At the national level, the largest increase was among people in the core working age group (25 to 54). This contrasted with 2016, when core age employment was virtually unchanged.
Unemployment rate trends down, participation rate edges up
Using annual data, the unemployment rate was 6.3% in 2017, down 0.7 percentage points compared with 2016. This was the largest decline since 2000. The unemployment rate fell among every major demographic group in 2017.
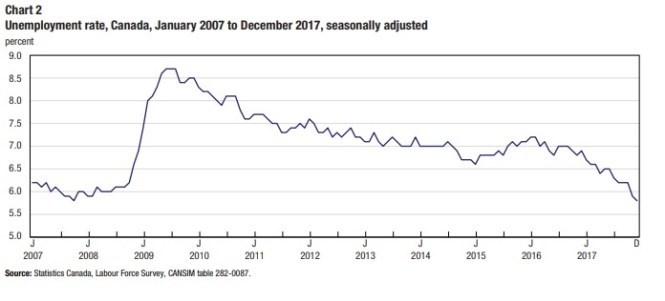
Provincially, the lowest unemployment rate was in British Columbia (5.1%), and the highest was in Newfoundland and Labrador (14.8%). On a monthly basis, the unemployment rate trended down throughout 2017, reaching 5.8% in December— matching a record-low previously observed in October 2007.3 The unemployment rate at the end of 2017 was 1.1 percentage points lower than 12 months earlier.
For most OECD (Organization for Economic Co-operation and Development) countries, the unemployment rate 4 also trended down in 2017, as economic conditions strengthened for this group of countries.
In December 2017, the unemployment rate in Canada was in line with the total OECD harmonized average unemployment rate of 5.5%. The participation rate—the proportion of the population either working or looking for work—rose for the first time since 2008, increasing by 0.1 percentage points to 68.5% in 2017.5 This was driven by increased participation among the core age population, particularly for women in this age group, which brought the core age participation rate to a record high of 87.0% (+0.5 percentage points compared with 2016). Labour force participation among people aged 55 and older continued its long-term upward trend, which is associated with the aging of the population as well as other social and economic factors
Employment Insurance recipients decline, job vacancies rise The number of people receiving regular EI benefits was 529,700 in 2017, down 6.0% from 2016.6 This follows two years of increases. The declines were most notable in Alberta and Quebec, while the number of beneficiaries rose the most in Newfoundland and Labrador. At the same time, there was a higher number of vacancies among employers—the average number of job vacancies over the four quarters of 2017 rose 18.2% in comparison with the average of 2016.7 The average job vacancy rate—the number of job vacancies expressed as a percentage of all occupied and vacant jobs—over the four quarters in 2017 was 2.8%, up from 2.4% in 2016. The unemployment-to-job vacancy ratio—the number of unemployed people divided by the number of job vacancies—declined in 2017.8 There were 2.8 unemployed people for each job vacancy (down from 3.6 observed in 2016).9 This is a due to a combination of fewer unemployed people as well as a rise in the number of vacant positions being reported by employers
- Labour Force Survey estimates (LFS), by sex and age group, seasonally adjusted and unadjusted, monthly (282-0087). “Record-low” using comparable data starting in 1976.
- OECD (2018). Harmonised unemployment rate (HUR) (indicator). doi: 10.1787/52570002-en (accessed on 4 April 2018), https://data.oecd.org/unemp/harmonised-unemployment-rate-hur. htm#indicator-chart.
- Labour Force Survey estimates (LFS), by sex and detailed age group, annual (282-0002).
- Employment Insurance program (EI), beneficiaries by province, census metropolitan category, total and regular income benefits, declared earnings, sex and age, unadjusted for seasonality, monthly (276-0033). Calculated using the annual average of the calendar year.
- Job Vacancy and Wage Survey (JVWS), job vacancies, job vacancy rate and average offered hourly wage by economic region, unadjusted for seasonality, quarterly (285-0001). Calculated using the annual average of the four quarters.
Average weekly earnings increase in most provinces Following a record-low annual earnings growth of 0.5% in 2016, average weekly earnings of non-farm payroll employees increased by 2.0% to $976 in 2017.10 This growth rate was similar to the one observed in 2015 (+1.8%). Average weekly earnings trended upward in the second half of 2017. As a comparison, the annual average increase in the Consumer Price Index (CPI) was 1.6% in 2017.11 In general, changes in weekly earnings reflect a number of factors, including wage growth; changes in the composition of employment by industry, occupation and level of job experience; and average hours worked per week.

Average weekly earnings grew in almost all provinces; and in the majority, the growth rate was higher in 2017 than in 2016. Growth in average weekly earnings was above the national average in Quebec (+2.8% to $903), British Columbia (+2.5% to $943), Manitoba (+2.5% to $911) and Saskatchewan (+2.2% to $1,010).12 Alberta saw the most notable change in the growth rate in comparison with 2016, with average weekly earnings increasing 1.0% to $1,130 in 2017, after declining 2.4% in 2016. In Prince Edward Island, average weekly earnings were little changed in 2017
- The ratio is often used to describe how tight or slack the labour market is. Lower values of the ratio imply that there are fewer unemployed persons per job vacancy and possibly greater ease of finding a new job, suggesting a tight labour market. Conversely, higher values of the ratio imply that there are more unemployed persons per job vacancy and possibly greater difficulty finding a new job, suggesting a slack labour market. For more information, see “Linking labour demand and labour supply: Job vacancies and the unemployed.” Insights on Canadian Society (75-006-X), http://www.statcan.gc.ca/pub/75-006-x/2017001/article/54878-eng.htm.
- Labour Force Survey estimates (LFS), by sex and detailed age group, annual (282-0002); and Job Vacancy and Wage Survey (JVWS), job vacancies, job vacancy rate and average offered hourly wage by economic region, unadjusted for seasonality, quarterly (285-0001). Calculated using the annual average of the four quarters.
- Survey of Employment, Payrolls and Hours (SEPH), average weekly earnings by type of employee, overtime status and detailed North American Industry Classification System (NAICS), annual (281-0027).
- Consumer Price Index, annual (2002=100) (326-0021).
- Survey of Employment, Payrolls and Hours (SEPH), average weekly earnings by type of employee, overtime status and detailed North American Industry Classification System (NAICS), annual (281-0027)
Hours trend up for employees paid by the hour, hold steady for salaried employees
After trending downward through 2016 and reaching a recent low point in April 2017, average hours among hourly paid employees—who represent about 60% of non-farm payroll employment—trended upward through most of 2017.13 However, on an annual basis, average weekly hours were little changed from 30.2 hours per week in 2016 to 30.1 hours per week in 2017. For salaried employees, the regular work week was also little changed in 2017, at 36.9 hours per week on average. The regular work week for salaried employees has been hovering around that level since 2009.
Employment increases in both goods- and services-producing sectors
Most of the non-farm payroll employment growth in 2017 was driven by services-producing sectors, which rose by 219,900 (+1.7%), the largest level increase since 2008.14 Health care and social assistance was the main contributor. There were also notable increases in accommodation and food services; professional, scientific and technical services; as well as educational services.
Payroll employment growth in services-producing sectors has typically outpaced goods-producing sectors over the past decade, except for a brief period between 2010 and 2012, when goods-producing sectors increased at a faster rate, due mostly to increases in natural resources and construction.
Following two consecutive years of declines, employment in goods-producing sectors rose by 64,400 (+2.3%) in 2017. This growth was led by manufacturing and construction. Employment in the mining, quarrying, and oil and gas extraction sector recovered slightly

- Survey of Employment, Payrolls and Hours (SEPH), employment, average hourly and weekly earnings (including overtime), and average weekly hours for the industrial aggregate excluding unclassified businesses, seasonally adjusted, monthly (281-0049).
- Survey of Employment, Payrolls and Hours (SEPH), employment by type of employee and detailed North American Industry Classification System (NAICS), annual (281-0024)
Health care and social assistance jobs continue to rise
For the fourth consecutive year, health care and social assistance was the largest contributor to payroll employment growth, rising 39,600 (+2.1%) in 2017. This brought the total number of employees in this sector to 1.9 million, the second-largest sector by employment (behind the 2.0 million in retail trade).
The biggest employment increase for the health care and social assistance sector was in Ontario (+14,600 or +2.1%), and to a lesser extent Quebec (+8,400 or +1.9%), reflecting their larger populations. However, the rate of employment growth outpaced the national average in Manitoba (+3.2% or +2,900), British Columbia (+2.7% or +6,900) and Alberta (+2.6% or +4,900).
At the national level, increases in health care and social assistance were spread across several industries, led by general medical and surgical hospitals, individual and family services, as well as community care facilities for the elderly. Employment in community care facilities for the elderly has more than doubled since 2006, reflecting the needs of an aging population. The number of people aged 65 and older increased by 36.9% between 2006 and 2016.15
The unemployed-to-job-vacancy ratio in health care and social assistance was 0.9 in 2017, which means there are more job vacancies than unemployed persons in that sector.16
Average weekly earnings in health care and social assistance were $889 in 2017, an increase of 2.6% from a year earlier. While average earnings in this sector were slightly below the national average, there was large variation within industries: employees in offices of physicians earned on average $1,152 per week, while employees in home health care services earned $675 on average per week. Most of the growth in 2017 was led by gains in the largest industry, that is, general medical and surgical hospitals.17
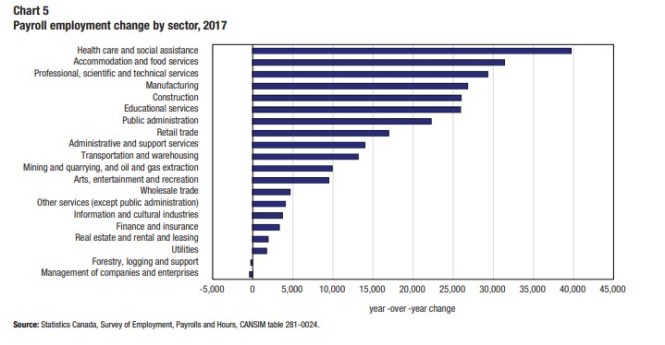
Employment gains in restaurants Employment in accommodation and food services increased by 31,400 (+2.5%) in 2017, with more than half of the increase in Ontario (+19,500 or +4.2%). The gains were almost entirely in full-service restaurants and limited service eating places, with smaller increases in traveller accommodation. The rate of employment growth in the accommodation and food services sector has exceeded the national average growth rate each year since 2011. In total, this sector had 1.3 million employees in 2017.
- Statistics Canada. 2017. Age and Sex Highlight Tables. 2016 Census. Statistics Canada Catalog no. 98-402-X2016002. Ottawa. Released May 3, 2017 (accessed April 13, 2018), HTTP://www12.statcan.gc.ca/census-recensement/2016/dp-pd/hlt-fst/as/index-eng.cfm.
- Labour Force Survey estimates (LFS), by North American Industry Classification System (NAICS), sex and age group, annual (282-0008); and Job Vacancy and Wage Survey (JVWS), job vacancies, job vacancy rate and average offered hourly wage by North American Industry Classification System (NAICS), unadjusted for seasonality (285-0002). Calculated using the annual average of the four quarters.Survey of Employment, Payrolls and Hours (SEPH), average weekly earnings by type of employee, overtime status and detailed North American Industry Classification System (NAICS), annual (281-0027).
- Survey of Employment, Payrolls and Hours (SEPH), average weekly earnings by type of employee, overtime status and detailed North American Industry Classification System (NAICS), annual (281-0020)
Average weekly earnings in accommodation and food services were the lowest among the sectors, with an average of $383 a week; however, earnings rose 3.4% compared with 2016, outpacing the national average growth rate. Accommodation and food services had the second highest job vacancy rate of all sectors on average over the four quarters in 2017, rising 0.5 percentage points to 4.5%.18 This is partly the result of high turnover in this sectorTech jobs growing at a fast pace
One of the fastest growing sectors in 2017 was professional, scientific and technical services, which rose 3.4%, adding 29,300 payroll jobs. This is the fastest pace of growth in the sector since 2008. In total there were 892,000 employees in this sector.19 Employment growth in professional, scientific and technical services was almost entirely driven by Ontario (+14,100 or +3.8%) and Quebec (+10,600 or +5.7%). For the professional, scientific and technical services sector, average weekly earnings were $1,347 (+2.3%). There was a relatively high job vacancy rate in this sector, at 3.1% on average for 2017, in line with the rate observed for 2016.20 Most of the employment growth in the sector was in computer systems design and related services, which grew by 19,100 (+9.2%). This is a high-skilled and high-earning industry, with average weekly earnings of $1,577 (up 2.9% from 2016).21
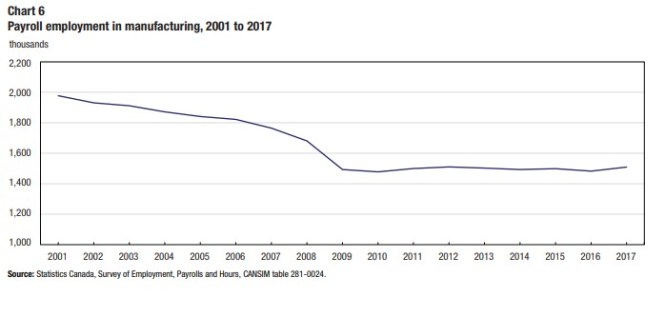
Strongest manufacturing growth in over a decade In 2017, manufacturing had the strongest employment growth since comparable data became available in 2001, adding 26,800 payroll jobs and growing at a pace of 1.8%. In total, there were 1.5 million employees in manufacturing, the third largest sector by employment. However, despite recent gains, there were nearly half a million fewer payroll employees in manufacturing compared with 2001.
- Job Vacancy and Wage Survey (JVWS), job vacancies, job vacancy rate and average offered hourly wage by North American Industry Classification System (NAICS), unadjusted for seasonality (285-0002). Calculated using the annual average of the four quarters.
- Survey of Employment, Payrolls and Hours (SEPH), average weekly earnings by type of employee, overtime status and detailed North American Industry Classification System (NAICS), annual (281-0027).
Gains in 2017 were spread across several subsectors, with the largest increases observed in food, as well as beverage and tobacco product manufacturing (+5,400 or +2.4% and +4,200 or +11.2%). There was also some contribution from transportation equipment manufacturing (+3,800 or +2.0%), particularly in motor vehicle parts manufacturing and motor vehicle and trailer manufacturing.
Most of the growth in manufacturing was in Quebec (+12,000 or +3.0%) and Ontario (+8,400 or +1.3%). To a lesser extent, there were increases in British Columbia and Alberta. At the same time, employment in manufacturing fell by 1,900 (-15.6%) in Newfoundland and Labrador, mostly in seafood product preparation and packaging.
Weekly earnings in manufacturing were $1,097 on average per week in 2017, virtually unchanged compared with 2016. The job vacancy rate for manufacturing was 2.5% on average for 2017, below the national rate for all sectors.22
The employment growth coincides with an upward trend in manufacturing sales, which rose by 3.3% in 2017—the highest pace of annual growth since 2010.23
Employment in mining, quarrying, and oil and gas extraction rebounds after two years of losses
Employment in mining, quarrying, and oil and gas extraction rose by 10,000 (+5.2%) in 2017.24 This follows two consecutive years of losses that resulted in an 18.1% decline in payroll employment for this sector from 2014 to 2016. Most of the decrease over this period was related to declines in global oil prices, with employees in Alberta most affected by this change.
In 2017, just under half of the increase in mining, quarrying, and oil and gas extraction was in Alberta (+4,700 or +4.8%). The increase in the province was led by “support activities”, which includes occupations such as oil and gas well drillers, servicers, testers and related workers. This subsector had the largest decline in employment following the oil price shock and, despite the recent increase, is still below its 2014 peak. Employment in the higher-paid “oil and gas extraction” subsector continued to trend downward in 2017.
There were also increases in mining, quarrying, and oil and gas extraction spread across British Columbia (+1,600 or +9.0%), Quebec (+1,400 or +8.5%) and Ontario (+1,200 or +5.0%). For these provinces, the rise was mostly in the metal ore mining industry.
In Newfoundland and Labrador, employment in the sector was virtually unchanged in 2017. This contrasts with notable growth from 2007 to 2014, during which employment in the sector grew by 8.4% due to oil exploration and investment in the province. On average, the job vacancy rate in 2017 for mining, quarrying and oil and gas extraction rose notably, up from 1.2% in 2016 to 2.3% in 2017.25
Wholesale trade has highest average weekly earnings growth
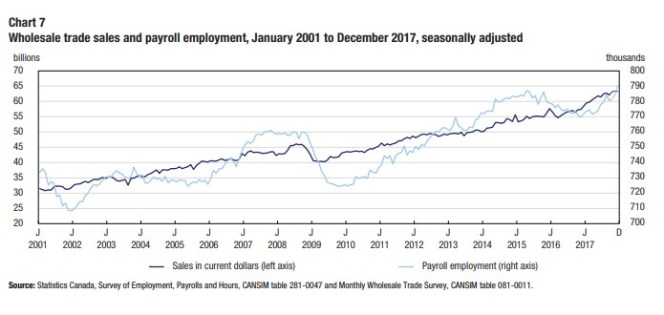
Looking at sectors, earnings grew the most in wholesale trade and in finance and insurance. Earnings in wholesale trade grew by 4.1% to $1,203, led by gains among wholesalers of machinery, equipment and supplies. The number of payroll employees in the sector has been on an upward trend throughout most of 2017, coinciding with increasing sales.26 Provincially, Ontario contributed the most to the earnings rise in the sector
- Job Vacancy and Wage Survey (JVWS), job vacancies, job vacancy rate and average offered hourly wage by North American Industry Classification System (NAICS), unadjusted for seasonality (285-0002). Calculated using the annual average of the four quarters.
- Real manufacturing sales, orders, inventory owned and inventory to sales ratio, 2007 dollars, seasonally adjusted, monthly (377-0009). Calculated using the annual average of the calendar year.
- Survey of Employment, Payrolls and Hours (SEPH), employment by type of employee and detailed North American Industry Classification System (NAICS), a(NAICS), unadjusted for seasonality (285-0002). Calculated using the annual average of the four quarters.
- Survey of Employment, Payrolls and Hours (SEPH), employment and average weekly earnings (including overtime) for all employees by detailed North American Industry Classification System (NAICS), Canada, seasonally adjusted, monthly (281-0047); and Wholesale trade, sales by the North American Industry Classification System (NAICS) (081-0011).
United States Housing News
Real Estate
The U.S. Housing Market Looks Headed for Its Worst Slowdown in Years
By
and
July 26, 2018 3:00 AM Updated on July 26, 2018 10:41 AM
- Market appears to be headed for its broadest slowdown in years
- ‘Affordability is becoming a headache for homebuyers’: Yun
Seattle Situation
They were fed up with Seattle’s home bidding wars. They were only in their late 20s but had already lost two battles and were ready to renew with their landlord. Then, in May, their agent called.
Suddenly, Redfin’s Shoshana Godwin told the couple, sellers were getting jumpy, even here in the hottest of markets. Homes that should have vanished in days were sitting on the market for weeks. There was a three-bedroom fixer-upper just north of the city going for $550,000, down from more than $600,000. They made the leap in early June and had closed by the end of the month, for list price.
The U.S. housing market — particularly in cutthroat areas like Seattle, Silicon Valley and Austin, Texas — appears to be headed for the broadest slowdown in years. Buyers are getting squeezed by rising mortgage rates and by prices climbing about twice as fast as incomes, and there’s only so far they can stretch.
“This could be the very beginning of a turning point,” said Robert Shiller, a Nobel Prize-winning economist who is famed for warning of the dot-com and housing bubbles, in an interview. He stressed that he isn’t ready to make that call yet.
The Data
A slew of figures released this week gives ample evidence of at least a cooling.
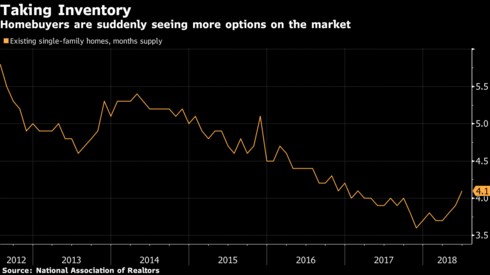
Existing-home sales dropped in June for a third straight month. Purchases of new homes are at their slowest pace in eight months. Inventory, which plunged for years, has begun to grow again as buyers move to the sidelines, sapping the fuel for surging home values. Prices for existing homes climbed 6.4 percent in May, the smallest year-over-year gain since early 2017, and have gained the least over three months since 2012, according to the Federal Housing Finance Agency. Shares of PulteGroup Inc. fell as much as 4.9 percent Thursday morning after the national home builder reported that orders had declined 1 percent from a year earlier, blaming rising mortgage rates.
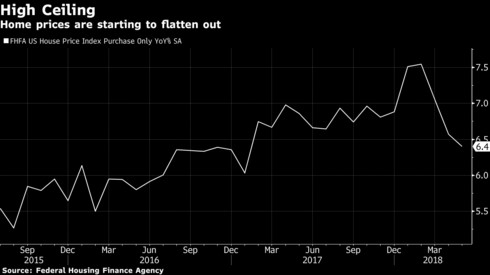
“Home prices are plateauing,” said Ed Stansfield, chief property economist at Capital Economics Ltd. in London. “People are saying: Let’s just bide our time, there’s no great rush. If we wait six or nine months we’re not going to lose out on getting a foot on the ladder.” That means “we’re now looking at a period in which prices move more or less sideways, or increase no more quickly than growth in incomes, over the next few years.”
Stansfield projects a 5 percent gain this year and a 3 percent increase in 2019. That compares with 10.7 percent in 2005, shortly before the crash.
Supply Lines
Some of the most expensive markets, where sales are falling under the weight of prices, are now seeing substantial increases in supply, according to Redfin Corp. In San Jose, California, inventory was up 12 percent in June from a year earlier. It rose 24 percent in Seattle and 32 percent in Portland, Oregon. Those big jumps are from low numbers, so the housing crunch is still a serious problem.
“Inventory has increased quite a bit,” Godwin, the Seattle agent, said. “We’re seeing less competition.”
Dustin Miller, an agent with Windermere Realty Trust in Portland, said he’s trying to manage sellers’ expectations, something he hasn’t had to do since the end of the last housing boom. One customer, a baby boomer moving to a new home across the state, expected to have buyers fighting over her house. She got one bid, below her asking price.
“Buyers want to shop and take some time, as opposed to having to rush and throw offers in,” Miller said. “It’s the market correcting itself. At some point, you hit a peak of momentum, and then things level off.”
This new wariness was noticeable in the latest consumer-sentiment data from the University of Michigan. In its preliminary July survey, 65 percent of Americans said it’s a good time to buy a home, the lowest since 2008, when the economy was still in recession.
Still, market watchers note that the housing sector has strong support from a healthy labor market and steady economic growth, which indicates a stabilizing trend for home prices rather than anything close to the experience of the crisis, when property values plunged. And shares of D.R. Horton Inc., which builds a lot of starter homes, rose as high as 8.7 percent Thursday morning after the company reported a 12 percent jump in orders.
“The rate of home sales, new and existing, has probably peaked,” said Ian Shepherdson, chief economist at Pantheon Macroeconomics. “But it’s not going to roll over. It will gently decline.”
The homeownership rate in the second quarter was 64.3 percent, up from 63.7 percent a year earlier, according to U.S. Census Bureau data released Thursday.
“While there appears to be a slowdown in the growth rate of home sales and prices, it has not slowed rising homeownership,” Freddie Mac Chief Economist Sam Khater said in a statement — though he added that the rate is a full percentage point below the 50-year average, reflecting “the long-lasting scars from the Great Recession and the lopsided nature of this recovery.”
New Record
S&P CoreLogic Case-Shiller data hint at the softening. The 20-city index of property values rose 6.6 percent in the 12 months ending in April. After seasonal adjustments, the gauge posted its smallest monthly increase in 10 months, with New York, San Francisco and Washington reporting declines.
Homeownership remains out of reach for many Americans, especially for first-time and younger buyers. For existing homes, the median price climbed in June to a record $276,900, while properties typically stayed on the market for 26 days, unchanged from the prior three months, according to the National Association of Realtors.
“Affordability is becoming a major headache for homebuyers,” said Lawrence Yun, the association’s chief economist. “You are seeing home sales rising in Alabama, where things are affordable. But in places like California, people aren’t buying.”
In addition, “no one knows how far and how fast” borrowing costs may rise as the Federal Reserve raises interest rates, Stansfield said. Lenders and borrowers alike are less likely to let credit spiral out of control than in 2005 and 2006. And with financing tighter and wage gains in check, “there’s not much scope for prices to continue to increase sustainably” at recent rates, he said.
The cooling, in turn, could curb housing starts, “because builders tend to only build what they think they can confidently sell,” Stansfield said. At the same time, he said, “it will decrease the risk of a bust.”
(Updates with PulteGroup in sixth paragraph and homeownership analysis just above New Record section.)
And finally, here’s what Joe’s interested in this morning Bloomburg
If you’re planning to do a cookout this 4th of July holiday, then I humbly suggest checking out this recent interview I did with Minneapolis Fed President Neel Kashkari. In the video, which we shot in his back yard, Neel walked me through his approach to grilling steak (he puts it right on the coals) and we also talked some monetary policy. An interesting admission he made was that, like many others, he’d seen the elevated level of unemployment in the post-crisis period as something to do with structural challenges facing the economy, like some sort of skills gap where the qualifications of job-seekers didn’t tally with the job openings employers needed to fill. In our chat, Neel admits that this view of the labor market has proven to be “dead wrong” and that high unemployment was simply a reflection of ongoing cyclical weakness. I was impressed: How many other people who espoused the structural view of the labor market admitted they were wrong? It’s hard to think of many others (though surely there must be some). Of course a lot of people got a lot of things wrong about the economy over the last 10 years. And it’s no crime to get things wrong, of course. But unless people acknowledge their errors, and attempt to get to the root of why they were wrong, it’s hard to be too confident in policy making the next time the cycle turns down.

Flat Footed
Thursday was the Treasury market’s equivalent of lighting the candle at both ends: the spread between two-year and 10-year yields hit the lowest level since August 2007 as the short-term rate rose while the longer-term tenor retreated fractionally.

For all the ink spilled about a U.S.-China trade war — with the Federal Reserve eyeing the economic fallout and the like — the move suggests that the conflict is not at all conducive to a bull steepener.
(That’s where the yield gap widens as two-year rates fall by more than their 10-year counterparts, as traders reduce Fed hike expectations.) Also backing that idea are the central bank’s dot plot and its assessment of the economic outlook. Put simply, the Fed’s concern about the ramifications of an onslaught of tariffs is dwarfed by its optimism on the U.S expansion.
The minutes from the July meeting showed that four officials saw the risks to growth as tilted to the upside (up from two in March), while a lone wolf continued to see things the opposite way. None viewed the risks to core inflation as biased to the downside. Add it all up, and it looks like Larry Kudlow’s wish might not come true.
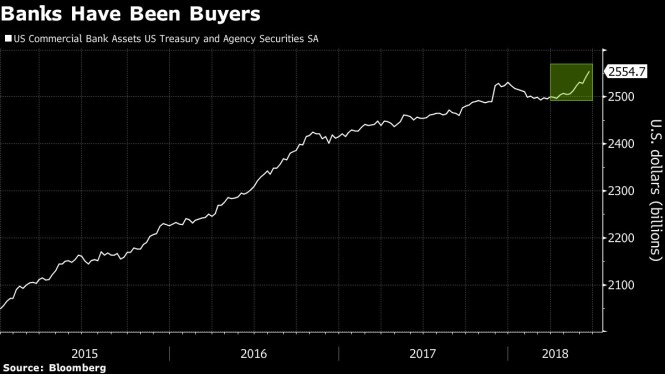
But Brian Reynolds at Canaccord Genuity sees another way in which trade tensions have had an impact. “Banks were buying more Treasuries as they put on the ‘carry trade,’ buying longer-term bonds utilizing shorter-term funding,” he writes about the second quarter — suggesting the activity was driven by “trade-war worries.”
Meantime, nobody told break evens that trade wars were inflationary, or would foster a steepening in the inflation-risk premium. It’s possible that break evens could be distorted by a flight to safe and liquid assets thanks to deteriorating ties between the world’s two largest economies. But since these concerns about trade ratcheted higher in mid-June, market-based measures of inflation compensation drifted marginally lower — until Wednesday, at least.

Breakevens did perk up materially that day, particularly the two-year tenor, which extended their advance after the Fed minutes referenced “supply constraints” on three occasions. As Bespoke Investment Group macro strategist George Pearkes observes, that’s the first time the phrase has appeared more than once in this communiqué in at least a decade. The Fed is bullish on growth and shifting to inflation-prevention mode under the presumption it’s the best way to sustain the expansion for as long as possible. Others might see continued Fed tightening as bringing the end of the cycle all the nearer.
Which in turn leads to an astute quip from Family Management Corp. CIO David Schawel on Twitter: “If you believe the yield curve flattening, and think we eventually go back into a recession with the Fed cutting, then the 5-10y part of the curve isn’t as unattractive as many think.
A Reprieve from IGnominy
It’s just three sessions into the third quarter (if you’re in the U.S.). But after blue-chip corporate debt was the worst-performing U.S. asset in the first half, it’ll take any stretch of out performance it can get:

A recent Citigroup survey shows just how unloved investment grade U.S. debt is: hedge funds have pared their holdings in the most aggressive fashion since early 2016, with allocations at the lowest level since 2008. Bloomberg’s Sid Verma notes that this may be a contrarian bullish signal, because it means funds have more room to add to the asset class going forward.
But any time in the sun may prove fleeting should long-term yields trend back to their 2018 highs.
“IG has become more of a duration product as well in the past few years, so if intermediate rates stay range-bound in Q3 (as we expect) and issuance remains subdued (given the summer low-issuance period ahead), then this might be the one quarter of 2018 where IG catches a bid,” writes George Goncalves, head of Americas fixed-income strategy at Nomura, who warned that the soft-supply dynamic wouldn’t last forever.
“We would use any tightening of spreads to lighten up on IG, as duration-based products are likely to suffer in the coming quarters and we anticipate that the higher-rates theme will eventually become a credit story, where HY and IG are both hit,” Goncalves says.
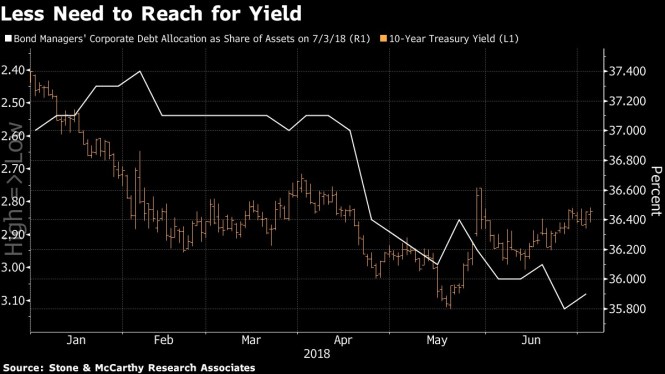
To his point on rate sensitivity, mid-April saw bond managers’ allocation to corporate debt as a share of assets deteriorate as the 10-year Treasury yield made its push through 3 percent for the first time since 2014. It’s a picture of what happens when duration risk and the competition for capital collide.
Buyout activity could change the supply picture materially for IG, to boot. Bloomberg Intelligence estimates more than $1 trillion in pending deals, and strategists warn of a flood companies coming to tap the market, raising questions about whether that’s already priced in. That’s the major wild card for high grade — and to a certain extent for the Russell 2000 Index as well, as many potential acquisition targets in the health care space have gone on tears this year.
There Is No U.S. Wage Growth Mystery
Print Alert Share Bookmark
Jul 14, 2017 | 8:26 AM ET | By Adam Ozimek •
Economists are puzzled over U.S. wage growth, wondering why it has been so slow despite a labor market that is allegedly back to or close to full employment. However, if you look at the right wage growth and the right measure of employment slack there is no mystery: Wage gains are right where they should be. And it indicates the labor market has room to improve.
Starting early in 2014, economists and pundits began debating the wage growth “mystery.” If unemployment has fallen so much (at the time, unemployment had fallen below 6%) then why hasn’t wage growth picked up? Theories abounded. Some argued that there were “pent-up wage cuts,” and therefore wages soon would accelerate rapidly. Others theorized there were measurement problems making wage growth look slower than it was: for example, lots of young workers entering the labor force and old workers retiring. Others worried that low productivity meant wage growth wasn’t getting any better. Some impressive economic acrobats have embraced all of these theories at different times.
However, there really is no wage puzzle. You just have to look at the right numbers and in the right way.
The first challenge is making sure you are looking at the right measure of wage growth. For this, the employment cost index is the most useful. Some argue that the Atlanta Fed median wage growth tracker is the best because it tracks growth for the same workers over time. However, this conflates experience-based raises with a general growth in wages. The ECI avoids this pitfall by tracking the same job over time instead of the same person.
Besides, the Atlanta Fed wage measure was at 3.3% in April 2015, leading to some concerns at the time that we were at full employment. But how do we interpret a wage growth measure that allegedly shouts “full employment” in an economy that over the next two years saw annual job growth of 2.3 million while the unemployment rate fell by more than a percentage point?
In fact, the performance of the economy over the last few years has resoundingly rejected the pent-up wage cuts, compositional changes, low productivity, and measurement problem theories of wage growth. There is simply no way we were at full employment then and yet added as many jobs as we have with inflation below target. It’s time to put those theories to bed and consider that, in fact, labor slack was greater than the full-employment hawks thought.
The problem of underestimating labor slack is twofold. First, there was a fear that the unemployment rate would remain above historical levels permanently. This has clearly proven overly pessimistic. Second, there is more slack outside of the unemployment rate.
The unemployment rate wage Phillips curve suggests that wage growth measured by the ECI for private sector wages and salaries has tracked relatively close to where you would expect it to be given the unemployment rate from 1994 through 2017. However, it has indeed fallen short in recent years compared with the line of best fit. Wage growth given the current unemployment rate would be expected at around 3% to 3.5%, but instead is around 2.5%. However, if wage growth is to reach 3.5% to 4%, this wage Phillips curve suggests the unemployment rate will need to fall still further.

However, the unemployment rate is not the right measure of labor market slack right now. If instead we look at the prime age non-employment rate (which is 100% minus the prime aged employment rate), we see an even tighter wage Phillips curve. According to this curve, wage growth is exactly where we would expect given the level of slack in the labor market. To get to 3.5% to 4% or higher wage growth, this graph suggests another 3 percentage points of improvement in the non-employment rate will be needed.
Whether you use the unemployment rate or prime non-employment Phillips curves, both suggest there is room to improve. The unemployment rate Phillips curve fails to explain the last two years of wage growth. The prime non-employment rate curve in contrast suggests wage growth should be exactly where it is. The better fit extends throughout the sample period: The r-squares from the lines of best fit indicate that the prime-age non-employment rate can explain 87% of the variation in wage growth since 1994 compared with 64% for the unemployment rate.

Wage growth is not really that mysterious if this level of slack is correct. Labor market pessimists who have pivoted from one theory to the next only to see them debunked by subsequent economic performance should consider the parsimonious explanation that there remains slack in the labor market, and they have underestimated it for years.
© 2018 Moody’s Corporation, Moody’s Investors Service, Inc., Moody’s Analytics, Inc. and/or their licencors and affiliates (collectively, “MOODY’S”). All rights reserved.
US Housing Statistic Snippets

North American Housing Association 2018
2017 PROFILE OF HOME BUYERS AND SELLERS https://www.nar.realtor/sites/default/files/documents/2017-profile-of-home-buyers-and-sellers-11-20-2017.pdf
Highlights
Characteristics of Home Buyers
First-time buyers made up 34 percent of all home buyers,a decrease from last year’s 35 percent.
The typical buyer was 45 years old this year, and the median household income for 2016 rose again this year to $88,800.
Sixty-five percent of recent buyers were married couples,18 percent were single females, seven percent were single males, and eight percent were unmarried couples.
Thirteen percent of home buyers purchased a multi generational home, to take care of aging parents, for cost savings, and because of children over the age of 18 moving back home.
Eighty-nine percent of recent home buyers identified as heterosexual, three percent as gay or lesbian, one percent as bisexual, and seven percent preferred not to answer.
Eighteen percent of recent home buyers are veterans and three percent are active-duty service members.
At 30 percent, the primary reason for purchasing a home was the desire to own a home of their own.
Characteristics of Homes Purchased
Buyers of new homes made up 15 percent and buyers of previously owned homes made up 85 percent.
Most recent buyers who purchased new homes were looking to avoid renovations and problems with plumbing or electricity at 36 percent. Buyers who purchased previously-owned homes were most often considering a better price at 32 percent.
Detached single-family homes continue to be the most common home type for recent buyers at 83 percent, followed by seven percent of buyers choosing townhouses or row houses.
Senior-related housing stayed the same this year at 13 percent, with 16 percent of buyers typically purchasing condos and six percent purchasing a townhouse or row house.
There was a median of only 15 miles between the homes that recent buyers purchased and the homes that they moved from.
Home prices increased slightly this year to a median of$23 5,000 among all buyers. Buyers typically purchased their homes for 98 percent of the asking price.
The typical home that was recently purchased was 1,870 square feet had three bedrooms and two bathrooms, and was built in 1991.
Heating and cooling costs were the most important environmental features for recent home buyers, with 85 percent finding these features at least somewhat important.
Overall, buyers expect to live in their homes for a median of 15 years, while 18 percent say that they are never moving.
The Home Search Process
For 42 percent of recent buyers, the first step that they took in the home buying process was to look online at properties for sale, while 17 percent of buyers first contacted a real estate agent.
Seventy-nine percent of recent buyers found their real estate agent to be a very useful information source. Online websites were the most useful information source at 88 percent.
Buyers typically searched for 10 weeks and looked at a median of 10 homes.
The typical buyer who did not use the internet during their home search spent only four weeks searching and visited four homes compared to those who did use the internet and searched for 10 weeks and visited 10 homes.
Among buyers who used the internet during their home search, 89 percent of buyers found photos and 84 percent found detailed information about properties for sale very useful.
Sixty-one percent of recent buyers were very satisfied with their recent home buying process.
Home Buying and Real Estate Professionals
Eighty-seven percent of buyers recently purchased their home through a real estate agent or broker, and seven percent purchased directly from a builder or builder’s agent.
Having an agent to help them find the right home was what buyers wanted most when choosing an agent at 52 percent.
Forty-two percent of buyers used an agent that was referred to them by a friend, neighbor, or relative and 12 percent used an agent that they had worked with in the past to buy or sell a home.
Seven in 10 buyers interviewed only one real estate agent during their home search.
National Association of REALTORS® n PROFILE OF HOME BUYERS AND SELLERS 2017 7
National Association of REALTORS®
Eighty-nine percent of buyers would use their agent again or recommend their agent to others.
Financing the Home Purchase
Eighty-eight percent of recent buyers financed their home purchase. Those who financed their home purchase typically financed 90 percent.
First-time buyers who financed their home typically financed 95 percent of their home compared to repeat buyers at 86 percent.
For 59 percent of buyers, the source of the down payment came from their savings. Thirty-eight percent of buyers cited using the proceeds from the sale of a primary residence, which was the next most commonly reported way of securing a down payment.
Forty-three percent of buyers saved for their down payment for six months or less.
For 13 percent of buyers, the most difficult step in the home buying process was saving for a down payment.
Of buyers who said saving for a down payment was difficult, 49 percent of buyers reported that student loans made saving for a down payment difficult. Forty-two percent cited credit card debt, and 37 percent cited car loans as also making saving for a down payment hard.
Buyers continue to see purchasing a home as a good financial investment. Eighty-three percent reported they view a home purchase as a good investment.
Home Sellers and Their Selling Experience
The typical home seller was 55 years old, with a median household income of $103,300.
For all sellers, the most commonly cited reason for selling their home was that it was too small (16 percent), followed by the desire to move closer to friends and family (14 percent), and a job relocation (11 percent).
Sellers typically lived in their home for 10 years before selling, the same as last year.
Eighty-nine percent of home sellers worked with a real estate agent to sell their home.
For recently sold homes, the final sales price was a median 99 percent of the final listing price.
Recently sold homes were on the market for a median of three weeks, down from four weeks last year.
Highlights
Thirty-seven percent of all sellers offered incentives to attract buyers.
This year, home sellers cited that they sold their homes for a median of $47,500 more than they purchased it.
Sixty-two percent of sellers were very satisfied with the selling process.
Home Selling and Real Estate Professionals
Sixty-four percent of sellers found their agent through a referral from a friend, neighbor, or relative or used an agent they had worked with before to buy or sell a home.
Seventy-four percent of recent sellers contacted only one agent before finding the right agent they worked with to sell their home.
Ninety percent of sellers listed their homes on the Multiple Listing Service (MLS), which is the number one source for sellers to list their home.
Seventy-six percent of sellers reported that they provided the agent’s compensation.
The typical seller has recommended their agent twice since selling their home. Thirty-three percent of sellers recommended their agent three or more times since selling their home.
Eighty-five percent said that they would (67 percent) or probably (18 percent) recommend their agent for future services.
For-Sale-by-Owner (FSBO) Sellers
Only eight percent of recent home sales were FSBO sales again, this year. For the third year, this is the lowest share recorded since this report started in 1981.
The median age for FSBO sellers is 55 years. Seventy-four percent of FSBO sales were by married couples that have a median household income of $103,100.
FSBOs typically sell for less than the selling price of other homes; FSBO homes sold at a median of $190,000 last year (up from $185,000 the year prior), and significantly lower than the median of agent-assisted homes at $250,000.
FSBO homes sold more quickly on the market than agent assisted homes. Fifty-eight percent of FSBO homes sold in less than two weeks—often because homes are sold to someone the seller knows.
Sixty-eight percent of successful FSBO sellers who knew the buyer was very satisfied with the process of selling their home.
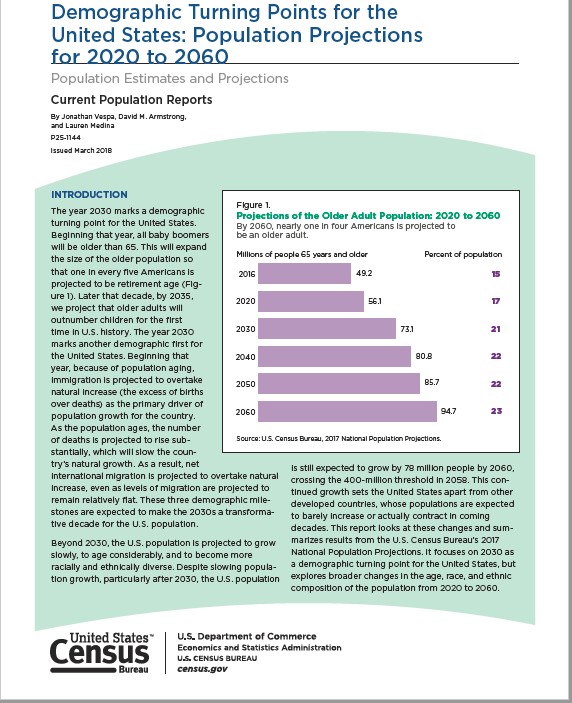
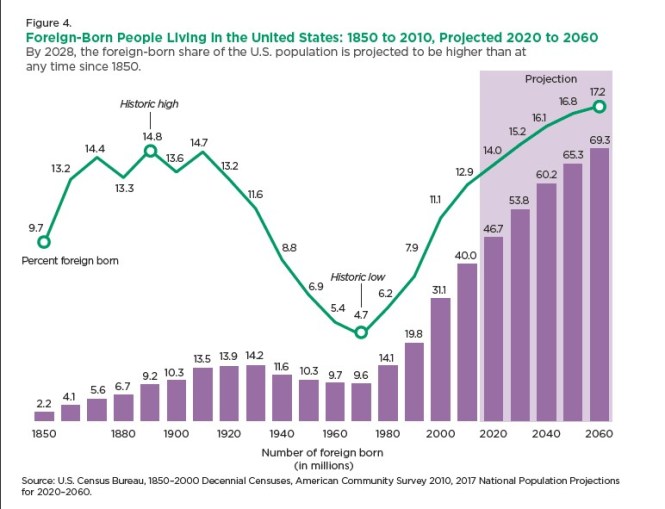
https://www.census.gov/content/dam/Census/library/publications/2018/demo/P25_1144.pdf