

Reuters UPDATE 1-S&P downgrades Japan, doubts Abenomics can soon reverse deterioration
Bonds | Wed Sep 16, 2015

* S&P cuts Japan to A+, four notches below AAA; outlook stable
* Economic support for sovereign creditworthiness weakens -S&P
* Downgrade follows cuts by rival credit ratings agencies
* Japan struggles to spur growth, little room left for stimulus (Adds analyst quote, detail)
TOKYO, Sept 16 (Reuters) – Ratings agency Standard & Poor’s on Wednesday downgraded Japan’s credit rating by one notch to A+, saying economic support for the country’s sovereign creditworthiness had continued to weaken in the past three or four years.
S&P cut its rating on Japan from AA- to A+, which is four notches below its top rating of AAA. The agency raised its outlook from negative to stable.
It was the first Japan downgrade by S&P since January 2011 and came 4-1/2 years after it last lowered its outlook, from stable to negative.
The downgrade brings its Japan rating into line with rival Moody’s Investors Service, which downgraded Japan to A1 in December last year. Fitch Ratings cut its rating on Japan by one notch to A in April.
The yen shrugged off the lowering of the credit rating. It briefly fell but then regained ground.
“We believe the likelihood of an economic recovery in Japan strong enough to restore economic support for sovereign creditworthiness commensurate with our previous assessment has diminished,” S&P said in a statement.
“Despite showing initial promise, we believe that the government’s economic revival strategy – dubbed ‘Abenomics’- will not be able to reverse this deterioration in the next two to three years,” it added.
The world’s third-largest economy shrank in the April-June quarter, and analysts expect any rebound in the current quarter to be modest as private consumption remains weak and China’s slowdown dampens prospects for a solid recovery in exports.
Prime Minister Shinzo Abe’s government aims to return to a primary budget surplus in fiscal 2020 and then lowering the debt-GDP ratio, which is the worst in the world, at around twice the size of the country’s $5-trillion economy.
Abe is putting more emphasis on economic growth and the higher tax revenue it brings, rather than austerity, to achieve the budget-balancing goal.
“S&P’s diagnosis about the uncertain economic outlook means that prospects for fiscal consolidation are becoming uncertain,” said Toru Suehiro, senior market economist at Mizuho Securities.
“Given that monetary and fiscal policies are stretched and it takes time to implement the ‘Third Arrow’ reform, Abe appears unlikely to find a way out of the doldrums any time soon, unless external demand turns for the better miraculously.”
A finance ministry official said it had no plan to issue a statement.
The S&P downgrade came the day after the Bank of Japan stood pat on policy, casting doubt about the central bank’s optimism.
BOJ Governor Haruhiko Kuroda voiced confidence that the economy can weather the hit from China’s slowdown and weak demand in the rest of Asia, suggesting that he sees no immediate need to expand stimulus further. (Editing by Clarence Fernandez)

NewsonJapan.com BOJ chief shows optimistic view about Japanese economy
Kyodo — Sep 15
Bank of Japan Governor Haruhiko Kuroda presented Tuesday an optimistic view of the Japanese economy, saying it is expected to continue recovering though a slowdown in emerging market countries has started to hurt the country’s exports and production.
In standing firm on its massive asset purchases, the BOJ chief said the trend of rising prices has been picking up, but the timing of achieving a 2 percent inflation goal could be delayed from the first half of fiscal 2016 projected earlier by the central bank.
“It is true that developments of crude oil prices would affect (consumer prices) in the short term,” Kuroda said at a press conference after a two-day policy meeting. Japan’s core consumer prices were flat in July from a year earlier.
– See more at: http://newsonjapan.com/html/newsdesk/article/113738.php#sthash.Ll9k2Wxq.dpuf
Industries | Tue Sep 15, 2015 4:01am EDT
Related: Financials
Reuters UPDATE 1-S&P raises South Korea sovereign credit rating


* S.Korea sovereign rating up to AA-minus vs A-plus
* Seen as overdue action after raises by other agencies
* Two other agencies raised ratings in recent years (Updates with economist’s comment, detail)
HONG KONG/SEOUL, Sept 15 (Reuters) – Standard & Poor’s raised South Korea’s sovereign currency rating to AA-minus from A-plus, commending the strength of its economic growth, decline in short-term debt component of external borrowings, and reduced foreign indebtedness of its banks.
“(South) Korea will maintain economic growth performance superior to most developed economies in the next three to five years,” the agency said in a statement.
It said the decline in its short-term debt composition and the reduced indebtedness of South Korean banks had cut the risk of a significant deterioration in external financing conditions.
The agency also affirmed the sovereign’s AA-minus local currency rating. The outlook on both ratings is stable.
This was largely seen as an overdue action after the other two of the three major global ratings agencies have already placed South Korea to the same level over the past three years, thus limiting any markets impact, economists said.
“S&P’s upgrade is not a forward-looking decision as markets have already priced it in and the won has been stronger than the other emerging-market currencies,” said Oh Suk-tae, economist at Societe Generale in Seoul.
Still it was the first time that South Korea’s sovereign ratings from S&P, Moody’s Investors Service and Fitch Ratings were set at AA-minus or the equivalent, the highest place that South Korea’s ratings have reached.
The upgrade came amid growing concerns in South Korea that foreign investors may pull out en masse ahead of or right after the U.S. Federal Reserve begins raising its interest rates, possibly later this year.
S&P’s announcement came after local markets ended trading.
“(The upgrade) will provide a foundation for the country to be differentiated from other emerging-market economies among foreign investors even if global market instability materialises in the future,” South Korea’s finance ministry said in a statement.
S&P said South Korea’s exports versus a year earlier have been shrinking for several months, but noted this was in line with the trend in the region. It also said South Korea’s per-capita income would keep rising to top $30,000 by 2018 from around $27,000 seen this year. (Reporting by Umesh Desai in HONG KONG and Choonsik Yoo in SEOUL; Additional reporting by Yeawon Choi; Editing by Eric Meijer)
ReutersSouth Korea takes stab at slaying zombie company menace
Industries | Tue Sep 15, 2015

* S.Korea to set up first bank-backed restructuring company
* Ailing firms are “festering sores” for economy – regulator
* H1 losses at Daewoo Shipbuilding helped spur action
By Choonsik Yoo and Joyce Lee
SEOUL, Sept 16 (Reuters) – South Korea is getting serious about tackling its “zombie company” problem and will set up its first restructuring firm backed by the government and banks in November, spooked by some huge corporate losses and a darkening economic outlook.
Korea Development Bank (KDB) will also seek to sell some of the 118 non-financial firms it controls, the government said last week – a move seen as part of its new resolve to deal with the issue. About 20 companies controlled by the state-run bank are seen as struggling.
Zombie companies, often defined as firms which require constant bailouts or which don’t make sufficient profit to pay down the principal on their debt, have long plagued South Korea’s corporate landscape.
Large wayward borrowers have frequently survived, with the government and state banks fearful of the job losses likely to accompany a big bankruptcy. But with domestic indicators taking a turn for the worse, China’s growth slowing and U.S. interest hikes looming, key policymakers say failure to take action means Asia’s fourth-largest economy risks damage to its industrial prowess.
“It’s time to respond pre-emptively,” said Yim Jong-yong, chairman of South Korea’s Financial Services Commission, the regulator behind the new restructuring body and KDB’s plans to offload companies.
“We need to help usher in a virtuous circle by making money flow into productive areas and away from non-productive sectors by removing these festering sores,” he told Reuters in an interview.
DAEWOO SHIPBUILDING DISTRESS
While it remains unclear which company the new restructuring body will cut its teeth on, the government is widely seen as having been spurred onto action in part by ugly results at Daewoo Shipbuilding & Marine Engineering.
The recipient of a state bailout some 15 years ago as well as billions of dollars in loans from state-run banks, the world’s largest shipbuilder shocked in July when it swung to a first-half operating loss of about 3 trillion won ($2.5 billion).
The shipbuilder plans to sell non-core assets in the wake of the losses, while the state-run banks are conducting due diligence to determine the cause of the losses and the level of any capital infusion that may be required.
But even without Daewoo Shipbuilding, the restructuring body will have many potential candidates to pick from.
The proportion of South Korean firms deemed “marginal” by the central bank, or not generating enough operating profit to cover interest payments for at least three years, stands at 15.2 percent, steadily worsening from 12.8 percent in 2009 when data was first compiled. The survey covers firms large enough to be subject to an outside audit.
Economic indicators also point to further pain ahead.
The ratio of inventories to shipments at Korean manufacturers jumped in the first half-year to 126.7 percent while factory utilisation dropped to 74.3 percent. Both indicators are set for their worst showing since the Asian financial crisis in 1997/1998.
The new restructuring body will be backed by eight banks, a mix of state and private lenders, and is set to offer up to 2 trillion won in loans. Its initial capital base of around 250 billion won will later be expanded to 1 trillion won.
Similar bodies set up in Japan have had a fair degree of success – cleaning up the balance sheet of flagship carrier Japan Airlines and helping restructure Japan Display Inc – formed from the LCD units of three conglomerates.
Cho Ki-youn, Seoul-based executive director at restructuring consultancy AlixPartners, said the restructuring body needs more firepower if it is to be truly effective.
“Looking back at many large troubled Korean firms, banks lack the expertise in timing, management and operations to say they will hold a company for a long time, fix it then sell it,” Cho said.
“An entity that can handle the restructuring of a big company will be the most desirable outcome.” ($1 = 1,181.2800 won) (Additional reporting by Emi Emoto in Tokyo; Writing by Tony Munroe; Editing by Edwina Gibbs)
UK Telegraph China’s transition is complicated – but the dragon has not lost its fire
Predicting China’s long-term trajectory is vital not just for the global economy, but for the strategies of many businesses
By Vivek Tulpule 8:47AM BST 04 Sep 2015

China has been the engine room of global economic growth over the past decade. So it is right to ask what the Dragon economy ‘s adjustment to a “new normal” means for the rest of the world.
First we need to assess what the new normal looks like. It does not mean that current economic conditions in China will prevail forever or that there is some future mythical stable state. It means that there will be a process of significant adjustment involving difficult structural reforms, a reallocation of resources, changes to public sector incentives and, inevitably, macroeconomic volatility.
While the transition to a new normal is complex, China’s fundamentals remain strong and it will continue to grow.
Predicting the trajectory of China is not only pivotal to the global economic outlook but it is crucial to the long-term strategy of many businesses, including the mining and metals industry. China is the world’s biggest consumer of iron ore – the key steel-making ingredient and a commodity often viewed as a portent of future economic growth because it is used in heavy metal manufacturing and the construction of new buildings.
Jeremy Warner: China has created a monster it can’t control
For a global business like Rio Tinto, which invests in assets with timeframes over decades, maximising shareholder value requires long-term planning. Our allocation of capital across alternative investments is heavily influenced by projected long-term trends in different markets. That’s why what is happening today in China is not as important as the long-term story. When looking at long-term trends it is imperative to see through near term volatility and cycles. At Rio Tinto we review our projections based on detailed primary research, on macroeconomic developments, industry costs, production trends and consumption drivers.
China’s factories will become more capital intensive
Yesterday we reaffirmed our analysis that Chinese crude steel production is expected to reach around l billion tonnes by 2030. This projection is the result of rigorous research conducted on the ground in China, India and other key markets.
Taking this bottom-up approach allows for a deeper interpretation of key trends, policy decisions and inflection points in each sector and region and under different macroeconomic scenarios. Reliance on top-down averages is often misleading in our view.
China is undoubtedly changing but the stunning migration of its population from rural areas to the cities will continue, with 220m new urban residents expected in the next 15 years, compared to the 320m people between the year 2000 and 2015.
That is still the equivalent of the combined populations of both Russia and Germany moving from the countryside into cities. There will be greater emphasis on improving the quality of this urbanisation and it will require more focus on public infrastructure, better public services and reduced pollution.
Construction growth in China will undoubtedly slow but its factories will become more capital intensive as the economy matures and manufacturing becomes more specialised.
Consumption, especially of services, will also form a greater share of economic activity. The net effect of this for China is a trend toward slower but higher quality growth. We see GDP growth trending from current reported levels of 7pc, or perhaps less, toward realised growth of 4pc to 5pc by 2030. Global steel demand is projected to grow by around 2.5pc a year between now and 2030, based on 3pc average global GDP growth a year.
So what are the implications for the leading mining houses and iron ore miners in particular? First, the world will continue to need increasing volumes of our products. Our projection is that the world will require 750 to 800m tonnes of additional iron ore by 2030 – an average increase of about 2pc a year.
AEP: China is in a serious bind but this is not yet a ‘Lehman’ moment
Second, emerging markets other than China will play a much more important role in the demand for iron ore. For example, some 25m people will move to cities in India and the south-east Asian nations such as Indonesia and the Philippines in the next 15 years. We expect demand for steel outside of China to increase by 65pc by 2030 – from 920m tonnes to just over l .5bn tonnes of crude steel.
Third, Chinese demand will remain critically important. Steel production is expected to grow by 1pc a year but that is from a very high base.
Construction growth in China is likely to slow
While China’s growth projections remain strong, its pattern of steel demand is expected to change. Replacement and renewal of capital stock will become much more important, as will exports of finished goods that embody steel.
A key part of the overall demand projection is the growth in exports from China, especially to other emerging markets. As these markets become more advanced, they will need to embark on a sustained process of building their own capital stocks and China will be well placed to export increasing quantities of capital good.
These will include machinery, construction equipment, transport vehicles – all requiring significant quantities of steel.
The nature of China’s buildings will also change. Today the average floor space per capita in China is about 32 square metres but we’re expecting that to grow to around 40 square metres per capita by 2030.
Between now and 2030 we expect a quarter of China’s building stock to be replaced, most involving the replacement of one and two-storey buildings with structures of seven storeys or higher. There is 40pc more steel per square metre in a high-rise building over 20 storeys than in a one to two-storey building.
We model urban residential demand by first projecting income growth on a province-by province basis at city level. We then analyse how much steel will be used in each metre of floor space, using a number of factors. For example, more stringent building regulation in China has resulted in 5% to 1O% increases in the steel intensity of buildings every decade.
While the new normal transition is undoubtedly complex and will be volatile, China’s fundamentals are still strong.
Vivek Tu/pule is Rio Tinto ‘s head of economics and markets© Copyright of Telegraph Media Group Limited
FINANCIAL TIMES
September 13, 2015 12:28 pm
China plans shake-up of state-owned enterprises to boost growth
Ben Bland in Hong Kong

China has unveiled the much-awaited guidelines for reform of its bloated state-owned enterprise sector as the latest official data show its economy continuing to slow.
The guidance from the State Council, China’s cabinet, calls for a shake-up of SOEs with share sales and management changes planned to reduce losses and improve efficiency, reported Xinhua, the official news agency, on Sunday.
“The guidelines suggest that by 2020, the goals in all the main reform areas should be accomplished, constituting a system that is more suitable to the nation’s socialist-market economy,” said Xinhua. “The SOE system should be more modernized and market-oriented. It should make for higher control, greater influence and SOEs will be more risk-resistant.”
China has more than 150,000 SOEs, employing tens of millions of people in all sectors from banks to hotels and airlines to oil refiners. But while the vast majority are managed by local governments, there is a core of more than 100 large nationally strategic groups, including ICBC, the world’s biggest bank by assets, and China Mobile, the world’s biggest network biggest network by subscribers, controlled by Beijing.
The update from the State Council came as manufacturing and investment statistics revealed further weakening in the world’s biggest economy by purchasing power parity.
Fixed-asset investment, a key measure of the capital spending that has driven China’s economy, grew at the slowest pace since 2000 during the first eight months of the year.
It increased by 10.9 per cent compared with the same period a year earlier, which was lower than the 11.2 per cent forecast by economists. Factory output was also worse than expected, growing by 6.1 per cent year on year in August, compared with the 6-4 per cent forecast by economists.
In 2013, Beijing’s top leaders endorsed a set of proposals designed to make state companies more efficient while maintaining their role as the Communist-led country’s economic backbone.
Investors have been waiting for the detailed guidelines as the economy has slowed further and confidence in the government of President Xi Jinping has been rocked by its erratic response to the recent stock market tumult.
The State Council said that SOEs would be classified as either playing a social or commercial function, to better integrate them with the market economy.
The government will then “actively introduce different investors” and push SOEs for public share sales, although most analysts believe that wholesale privatisations are highly unlikely.
Analysts at ANZ argued last week that this round of SOE reform could be a “game-changer” in China’s economic development.
But they warned that “SOE reform will still be a gradual process” and it is “unlikely that the government will relinquish its tight control and involvement over the SOEs, especially those in strategically important sectors”.
Michael Pettis, a professor of finance at Peking University in Beijing, said that while the proposed SOE reforms might be good in principle, the key to resolving the imbalances in the Chinese economy was ensuring a better allocation of capital.
“What China needs to do is transfer wealth from the state to the household sector, for example by lending more to private enterprises and less to SOEs and local governments,” he explained. “But it’s tough to do so because it means taking away resources from those that have benefited over the last two or three decades.”
Mr Pettis said that while the government’s uncertain handling of the stock market boom and collapse had undermined investor confidence, it was vital for Beijing to “do everything it can” to maintain its remaining credibility. But he added that investors would also have to accept that reform will have its costs.
“Xi’s administration has inherited a country with deep imbalances and enormous amounts of debt,” he said. “There’s no precedent in history for a country resolving those issues without a significant slowdown.”
Printed from: http://www.ft.com/cms/s/O/aff90924-5a01-11 e5-9846-de406ccb37f2.html
© THE FINANCIAL TIMES LTD 2015 FT and ‘Financial Times’ are trademarks of The Financial Times Ltd.
FINANCIAL TIMES
September 15, 2015 3:18 pm
A new Chinese export – recession risk
Martin Wolf

Is a global economic recession likely? If so, what might trigger it? Willem Buiter, Citi’s chief economist and the Financial Times’ erstwhile Maverecon (willem buiter’s maverecon)
Blogger, answers these questions: “Yes” and “China”. His case is plausible. This does not mean we must expect a recession. But people should see such a scenario as plausible.
Mr. Buiter does not expect world output to decline. The notion here is a “growth recession”, a period of growth well below the potential rate of about 3 per cent. One might imagine 2 per cent or less. Mr. Buiter estimated the likelihood of such an outcome at 40 per cent.
His scenario would start with China. Like many others, he believes China’s growth is overstated by official statistics and may be as low as 4 per cent. This is plausible, if not universally accepted.
It might become even worse. First, an investment share of 46 per cent of gross domestic product would be excessive in an economy growing 7 per cent, let alone one growing at 4 per cent.

Second, a huge expansion of debt, often of doubtful quality, has accompanied this excessive investment. Yet merely sustaining investment at these levels would require far more borrowing.
Finally, central government, alone possessed of a strong balance sheet, might be reluctant to offset a slowdown in investment, while the shares of households in national income and consumption in GDP are too low to do so.

Suppose, then, that investment shrank drastically as demand and balance-sheet constraints bit. What might be the effects on the world economy?
One channel would be a decline in imports of capital goods. Since about a third of global investment (at market prices) occurs inside China, the impact could be large. Japan, South Korea and Germany would be adversely affected.
A more important channel is commodity trade. Commodity prices have fallen, but are still far from low by historical standards. Even with prices where they are, commodity exporters are suffering. Among them are countries like Australia, Brazil, Canada, the Gulf States, Kazakhstan, Russia and Venezuela. Meanwhile, net commodity importers, such as India and most European countries, are gaining.
Shocks to trade interact with finance. Many adversely affected companies are highly indebted. The resulting financial stresses force cutbacks in borrowing and spending upon them, directly weakening economies. Changes in financial conditions exacerbate such pressures.
Among the most important are movements in interest and exchange rates and shifts in the perceived soundness of borrowers, including sovereigns. Changes in capital flows and risk premiums and shifts in the policies of important central banks exacerbate the stresses. At present, the most important shift would be a decision by the US Federal Reserve to raise interest rates.
As Warren Buffett said: “You only find out who is swimming naked when the tide goes out.”
According to the Bank of International Settlements, credit to non-bank borrowers outside the US totalled $9.6tn at the end of March. A strong dollar makes any currency mismatches costly. These may start on the balance sheets of non-financial corporations. But the impact will be transmitted via their losses to banks and governments. Thus, reversal of “carry trades”, funded by cheap borrowing, might wreak havoc.
A visible shift is a decline in foreign exchange reserves, driven by deteriorating terms of trade, capital flight and withdrawal of previous capital inflows.
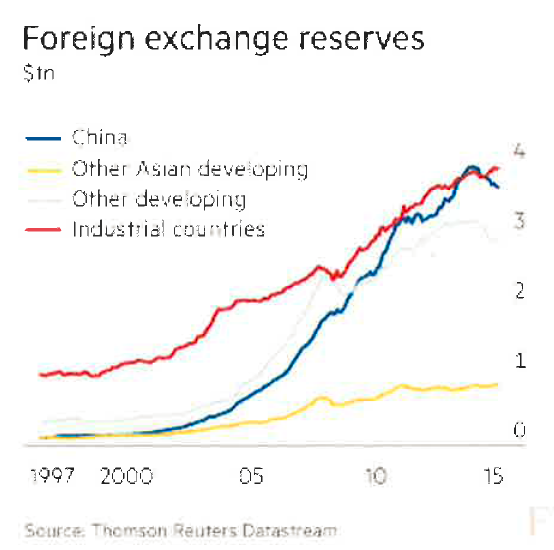
This might cause “quantitative tightening”, as central banks sell holdings of longer-dated safe bonds. This is one of the ways that these shocks might be transmitted to the high income countries, including even the US. But this also depends on what the holders of the withdrawn funds do with it and on the policies of affected central banks.
What we might see, then, is a series of real and financial linkages: declining investment and output in China; weaknesses in economies dependent on that country’s purchases or on prices set by its buying; and reversals of carry trades and shifts in exchange rates and risk premium that stress balance sheets.
How might policymakers respond? China will surely let its currency fall rather than continue to lose reserves, not least because usable reserves are smaller than headline numbers, which include infrastructure investments in Africa and elsewhere that cannot quickly be sold. The policy space of other emerging economies will be forced to adjust to these shocks rather than resist them.
Meanwhile, the policy choices of high-income countries are restricted: politics has almost universally ruled out fiscal expansion; the intervention rates of central banks are near zero; and, in many high-income economies, private leverage is still quite high. If the slowdown were modest, nothing much might be done. The best response to a big slowdown might be “helicopter money”, created by the central bank to stimulate spending. But its use seems quite unlikely. The conventional rules.
In brief, a global growth-recession scenario “made in China” is perfectly plausible. If it were to happen, a decision by the Fed to tighten now would come to look downright foolish. We are not talking about the sort of disaster that accompanies a global financial crisis. But the world economy will remain vulnerable to adversity until China has completed its transition to a more balanced pattern of growth, and the high-income economies have recovered from their crises. That is still far away.
Printed from: http://www.ft.com/cms/s/0/486bc 716-5af0-11e5-9846-de406ccb37f2. htmI
© THE FINANCIAL TIMES LTD 2015 FT and ‘Financial Times’ are trademarks of The Financial Times Ltd.
FINANCIAL TIMES
September 16, 2015 12:29 pm
Doubts rise over China’s official GDP growth rate
Josh Noble in Hong Kong

The view that China is growing far slower than official figures show is increasingly going mainstream, with big global investors among those now basing decisions on a rate of about 5 per cent.
According to government statistics China’s economy grew at an annual pace of 7 per cent in the second quarter of this year, in line with Beijing’s target for the year and the World Bank estimate of 7.1 per cent.
However, doubts have long lingered about the veracity of Chinese economic data, with many analysts believing them to be understated during times of rapid growth and overstated during the current slowdown. A strategist at one European asset manager described the official growth figure as “a very crude propaganda tool”.
The recent decision by the People’s Bank of China to devalue the renminbi, a move that rattled markets across the world, has been seen as further evidence that China’s economy is in far worse health than official data show.
Some have instead turned to alternative estimates, such as the “Li Keqiang index” -a composite of various indicators favoured by the Chinese prime minister, such as electricity production and railway freight volumes. Many of those gauges fell into outright contraction late last year.
Bob Browne, chief investment officer at Northern Trust, said the fund manager recently lowered its growth forecast for China for the next five years to “5 per cent and change”, which he said was a recognition that using official statistics was “really no longer appropriate”.
“We just can’t reconcile it with the private sector surveys or more valid government bottom up numbers,” he said.
The true nature and rate of Chinese growth is a key ingredient for investors and economists as they seek to measure demand for global commodities and forecast growth rates for the countries that produce them.
Sharp falls in the price of many raw materials, including oil, copper and iron ore, over the past year have been seen as added proof that China, the biggest consumer of many commodities, is actually growing well below the stated rate.
“If you look at the kind of hard data that are entering into the composition of the so-called Li Keqiang index, the growth is today probably closer to 5 per cent than to 7 per cent,” said
Jean-Louis Nakamura, chief Asia investment officer at Lombard Odier.
Some are even more bearish. Lombard Research reckons China grew at an average rate of 4.7 per cent in the first half of the year, while Citi’s chief economist Willem Buiter believes growth could already be as low as 4 per cent.Those views chime with a recent confidential survey conducted by Consensus Economics, a researcher, which asked economic forecasters what they believed the true rate of Chinese growth has been this year. Those polled gave an average growth figure for the second quarter of just 4.3 per cent, and a forecast for the current quarter of 5.1per cent.A separate Bank of America Merrill Lynch survey of fund managers released on Tuesday showed that the majority of investors now expect China to be growing at 4.1-5 per cent in three years’ time. Most gave an answer of 5.1-6 per cent just a month ago.Figures around 5 per cent contrast with the consensus estimate from investment bank economists, which is currently 6.9 per cent for 2015.David Meier, economist at Julius Baer, has an official forecast for this year of 6.7 per cent, but notes “suspicion that the figures could be 1-2 per cent overdone”.”At the end of the day, we have to comment, analyze and publish forecasts based on the official [gross domestic product] data series,” he said.© THE FINANCIAL TIMES LTD 2015 FT and ‘Financial Times’ are trademarks of The Financial Times Ltd
China Daily 8 regions selected as innovation zones
By Lan Lan (China Daily)Updated: 2015-09-16 10:18

China aims to build a long-term mechanism that could spur innovation and drive economic growth.
The State Council has chosen eight regions, including the Beijing-Tianjin-Hebei cluster, Shanghai, and Guangdong province as pilot zones to carry out trials on innovation and reform.
Li Pumin, spokesman for the National Development and Reform Commission, told a news conference on Tuesday that these regions have been asked to map out detailed proposals for innovation reform in the fourth quarter.
The regions have been tasked with building a long-term mechanism for promoting innovation and making breakthroughs in promoting fair competition, intellectual property, scientific achievement and financial innovation, Li said.
Experiments will be carried out in these regions in 2016, while the NDRC and the Ministry of Science and Technology will evaluate the performance. Successful measures will be duplicated or promoted nationwide, said Li.
China’s economic growth will become more reliant on human skills and technology, as well as on improving productivity and resource allocation. However, in the short term, investment will continue to play the most crucial role, experts said.
Maintaining steady growth and promoting investment remain the focus this year against the backdrop of increasing downward economic pressure, Xu Shaoshi, chairman of the NDRC, said on Monday at a video conference.
Measures taken by the government for promoting investment have taken effect. In the first eight months of the year, infrastructure investment grew by 18.4 percent year-on-year, more than 7 percentage points higher than overall investment growth.
Lin Boqiang, director of the China Center for Energy Economics Research at Xiamen University, said the recovery remains weak.
“Investment remains the most effective tool in cushioning the slowdown, but we need to nurture drivers for future growth by spurring innovation,” said Lin.
Reuters India awards 10 permits to create small banks to help businesses
Business News | Wed Sep 16, 2015 9:54pm IST
MUMBAI
A money lender counts Indian rupee currency notes at his shop in Ahmedabad, India, May 6, 2015.
Reuters/Amit Dave/Files
The Reserve Bank of India said on Wednesday it has selected 10 financial institutions to set up separate small banks to lend to small businesses and farmers, who typically struggle to get funding from traditional lenders.
Private-equity backed Ujjivan Financial Services Pvt Ltd and Janalakshmi Financial Services Pvt Ltd were among the 10 granted approval to seek one of the niche small finance bank licences. Most of the others were microfinance companies that already make small loans to businesses and farmers.
Nearly half the population of India, Asia’s third-largest economy, did not have a bank account before a government programme led to millions of new accounts this year.
More than 100 million people in the country work at small businesses but only about 4 percent of small businesses have access to institutional finance.
Setting up small banks will enable microfinance firms to increase their loan ticket size although they must ensure that half of their loan book constitutes loans of not more than 2.5 million rupees ($37,700).
Existing non-bank finance companies, local area banks and micro-finance institutions were eligible to apply for the permits and 72 submitted applications.
The winners will in future be able to become fully fledged banks depending on their performance and if they comply with rules for banks, the RBI has said, although the transition will not be automatic.
Janalakshmi’s investors include Morgan Stanley Private Equity Asia and TPG, while Sequoia Capital and the World Bank arm IFC are investors in Ujjivan.
The other institutions selected for small bank permits included Au Financiers (India) Ltd, Capital Local Area Bank Ltd and Disha Microfin Pvt Ltd.
In a separate process, last month, the RBI had named 11 companies to set up payments banks that can take deposits and remittances but cannot lend. Big telecom carriers and Reliance Industries, controlled by India’s richest man, were among those selected for the payments bank permits.
($1 = 66.3234 Indian rupees)
(Reporting by Devidutta Tripathy; Editing by Susan Fenton
India Money Control : Indian economy an exception; to grow 7.2% in FY16: OECD
Sep 17, 2015, 07.49 AM | Source: PTI
Releasing its interim economic outlook report today, the Paris-based think tank said global growth prospects have weakened slightly and become less clear in recent months.

India is projected to grow at a slightly lower pace than expected earlier at 7.2 per cent this fiscal but the country is an “exception” to the worsening picture in major emerging economies, says OECD.
Releasing its interim economic outlook report today, the Paris-based think tank said global growth prospects have weakened slightly and become less clear in recent months. Even as OECD marginally lowered the growth forecast for India for the current and next financial years, it said the country is “expected to be the fastest-growing major economy over the coming two years”.
“India will grow by 7.2 percent in 2015 and 7.3 per cent in 2016,” the Organisation for Economic Cooperation and Development (OECD) said. The latest figures are slightly lower than the projection of 7.3 per cent (2015-16) and 7.4 per cent growth (2016-17), respectively, made by OECD in June this year.
India’s economic growth slowed to 7 percent in the three months ended June compared to 7.5 percent expansion recorded in the January-March quarter, as per official estimates.
“World trade growth has stagnated and financial conditions have deteriorated. The recovery is nonetheless progressing in advanced economies, but the outlook has worsened further for many emerging market economies (EMEs),” OECD added. Emphasising that India is projected to continue to grow strongly, broadly in line with 2015, the think tank said EMEs like Brazil and Russia should see some improvement in 2016 if commodity prices do not fall further.
“The slowdown has been sharpest in countries heavily dependent on commodities and/or with close trade links to China, notably in East and South-East Asia. In 2014, over a third of all merchandise imports in China came from regional trading partners. “The main exception to the worsening picture is India, where growth is supported by strong consumer spending and public investment in infrastructure,” the report noted.
In 2015, China is expected to grow by 6.7 per cent and at a slower rate of 6.5 per cent next year. Brazil’s economy is expected to shrink by 2.8 per cent in 2015 and by an additional 0.7 per cent rate in 2016, it added. “A key puzzle in the short-term outlook centres on China, where recorded growth has held up well, but some indicators point to a slower underlying pace of economic activity.
“The marked slowdown in Chinese import demand has important spillover effects on global growth, particularly in emerging economies with close trade links to China, and those that depend on commodities,” OECD said.
The global growth forecast has been trimmed to 3 per cent this year from earlier projection of 3.1 per cent. The rate of expansion next year is expected to be 3.6 per cent lower than June estimate of 3.8 percent.
Canada Wood China Economy, Construction, Lumber Shipments

By Brad Spencer
Deputy Managing Director
August 13, 2015
Posted in: China
Growth in China’s real estate investment slowed to 4.3 per cent in the first seventh months of this year from a year ago, while the area of property sold rose an annual 6.1 per cent
The bank’s preliminary Purchasing Managers’ Index (PMI) came in at 49.6 in June, the highest in three months but still below the breakeven point of 50, HSBC said in a statement. The index, which is compiled by information services provider Markit and tracks activity in factories and workshops, is seen as a key barometer of the country’s economic health.
However, while it marked a fourth straight contraction, the figure was an improvement on May’s final reading of 49.2 and also beat a forecast of 49.4 in a survey of economists by Bloomberg News. The figures are the latest to show the economic powerhouse continues to slow despite three interest rate cuts since November as well as other measures to boost bank lending and the housing market.
While total new business and purchasing activity in
creased slightly this month companies continued to slash staff, with the latest reduction the sharpest in more than six years, Annabel Fiddes, an economist at Markit, said in the statement. Zhao Yang, a Hong Kong-based economist with Nomura, also said the overall growth momentum in China was “still weak” despite the improvement in the PMI reading.
“Monetary policy still needs to be further eased to counter the still-strong headwinds in the economy,” Zhao said in a research note. Chinese imports fell for a seventh straight month in May while exports also sank, according to official data, as the world’s second biggest economy shows protracted weakness despite government easing measures.
The disappointing figures, released, also come as leaders try to transform the economy to one where growth is driven by consumer spending rather than by government investment and exports.Imports slumped 17.6 percent year-on-year to $131.26 billion, the General Administration of Customs said in a statement.
The decline was much sharper than the median forecast of a 10 percent fall in a Bloomberg News poll of economists and followed April’s 16.2 percent drop.”The May trade data… suggest both external and domestic demand remain weak,” said Julian Evans-Pritchard, an analyst with research firm Capital Economics, in a note.
Exports dropped for the third consecutive month, falling 2.5 percent to $190.75 billion, Customs said, although that was better than the median estimate of a four percent fall in the Bloomberg survey.”The data add to evidence that the sector has lost growth momentum in Q2 as a whole, and suggests that the authorities may step up their efforts to stimulate growth and job creation in the second half of the year,” she added.
The sharp decrease in imports meant the trade surplus expanded 65.6 percent year-on-year to $59.49 billion.In yuan terms imports fell 18.1 percent, exports decreased 2.8 percent and the trade surplus expanded 65.0 percent.The figures provided further evidence that frailty in the Chinese economy, a key driver of world growth, has extended into the current quarter despite intensified government stimulus measures.
Industrial output, which measures output at factories, workshops and mines, rose 6.1 percent year-on-year in May, the National Bureau of Statistics (NBS) said in a statement.Retail sales, a key indicator of consumer spending, increased 10.1 percent in the same month, the NBS said.The industrial output figure was the highest since a reading of 6.8 percent growth in January-February, when the data were released for two months to iron out distortions related to Chinese New Year.
The May increase was also above the 5.9 percent recorded in April and marginally above the median 6.0 percent rise in a forecast of economists by Bloomberg News.
Source: Markit and others
BC Forest Investment and Innovation Market Overview
With GDP growth coming in at less than the target of 7.4 per cent, China announced additional stimulus packages in 2013, including tax cuts for small businesses and increased spending on lowincome housing and infrastructure. As a result, wood consumption continued to trend upwards with growth of 17 per cent on a per capita basis. Unemployment, inflation and other key economic indicators showed little movement, while the Yuan fell by 4.8 per cent against the Canadian dollar, making imports of B.C. wood products more expensive for Chinese customers.
Demand for housing remained strong in tier-one cities (Beijing, Shanghai, Guanzhou and Shenzen) due largely to existing residents who were upgrading to higher value homes, in-migration from other parts of the country, and speculation by Chinese investors buying additional properties. Forecasts suggest that median incomes in tier-one cities will continue to rise and drive future property markets.
China’s declining trade surplus and a dampening of growth throughout the economy suggest that flat or declining demand for most commodities, including wood products, will be the dominant trend of 2014/15.
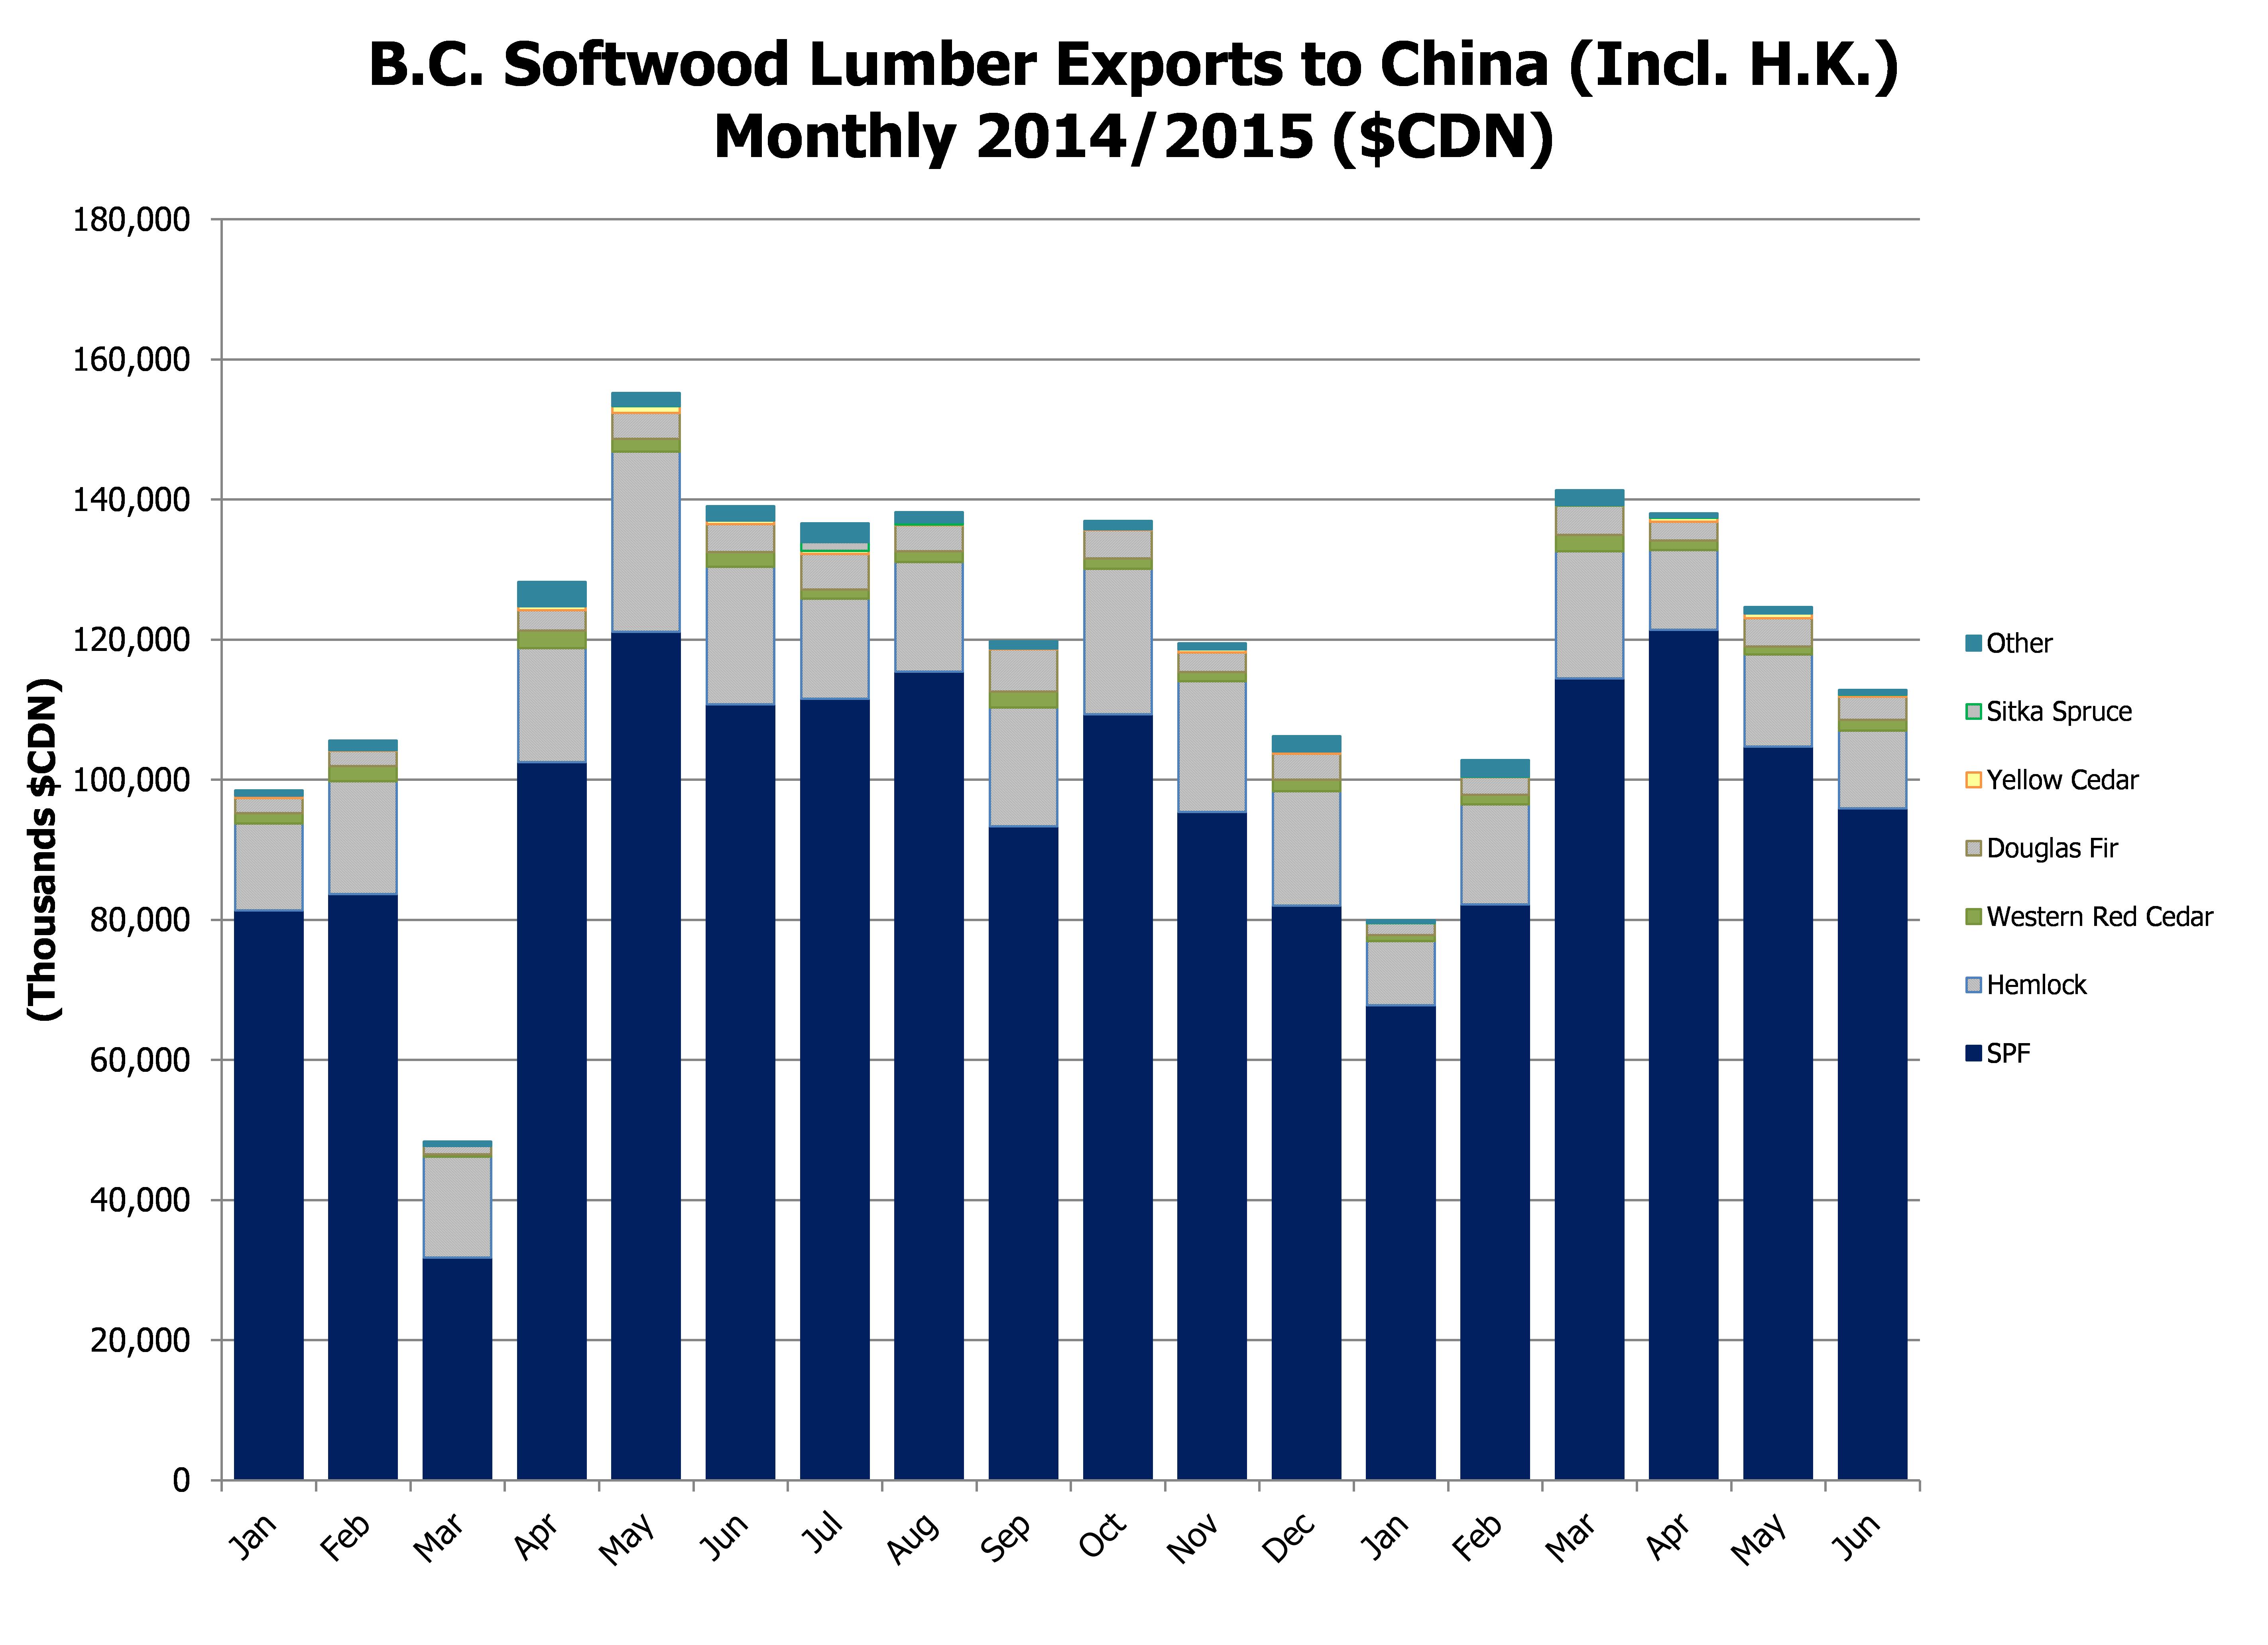
B.C. Softwood Lumber Exports to China, as of April’15
BC softwood lumber export volume to China in the first four months of 2015 was 2.263 million cubic meters as compared to 2.091 million cubic meters over the same period in 2014, an increase of 8.2%%. BC softwood lumber export value over this same period was $461.77 million, an increase of 21.3%. These comparisons are skewed as the 2014 numbers where impacted by the April Port of Vancouver strike. We also continue to believe that both volumes and values will decline over the next few months because of large inventory buildups in China.

BC Softwood Lumber Exports to China (including Hong Kong)
2013/2015 Cumulative
Volume of B.C. Lumber Exports to China (Incl. Hong Kong)
2014/2015
(Cubic Metres)
| Commodity | May | Jun | Jul | Aug | Sep | Oct | Nov | Dec | Jan | Feb | Mar | Apr | May | Jun |
| SPF | 674,656 | 616,490 | 612,135 | 624,223 | 524,782 | 590,172 | 471,345 | 423,993 | 352,391 | 414,810 | 542,888 | 619,524 | 550,871 | 522,326 |
| Hemlock | 120,165 | 94,579 | 56,118 | 70,513 | 80,106 | 97,250 | 94,148 | 78,130 | 38,189 | 67,516 | 85,447 | 51,691 | 67,759 | 54,747 |
| Western Red Cedar | 5,626 | 5,069 | 3,450 | 3,872 | 4,957 | 3,128 | 2,670 | 3,273 | 1,735 | 3,082 | 4,978 | 2,674 | 2,320 | 3,474 |
| Douglas Fir | 19,418 | 19,097 | 25,903 | 17,514 | 31,602 | 20,002 | 15,997 | 20,423 | 7,545 | 13,251 | 19,625 | 14,041 | 23,186 | 14,217 |
| Yellow Cedar | 3,657 | 2,082 | 2,113 | 444 | 485 | 269 | 1,745 | 779 | 24 | 306 | 143 | 924 | 2,229 | 948 |
| Sitka Spruce | 55 | 0 | 5,002 | 1,376 | 0 | 0 | 0 | 0 | 125 | 46 | 153 | 139 | 0 | 37 |
| Other | 7,492 | 8,329 | 13,310 | 6,676 | 4,747 | 5,007 | 3,772 | 10,998 | 1,696 | 9,973 | 9,475 | 1,825 | 4,226 | 2,651 |
| Total | 831,069 | 745,646 | 718,031 | 724,618 | 646,679 | 715,828 | 589,677 | 537,596 | 401,705 | 508,984 | 662,709 | 690,818 | 650,591 | 598,400 |
Value of B.C. Lumber Exports to China (Incl. Hong Kong)
2014/2015
(000s of $CDN)
| Commodity | May | Jun | Jul | Aug | Sep | Oct | Nov | Dec | Jan | Feb | Mar | Apr | May | Jun |
| SPF | 121,116 | 110,749 | 111,551 | 115,438 | 93,326 | 109,354 | 95,424 | 82,038 | 67,829 | 82,194 | 114,451 | 121,422 | 104,728 | 95,897 |
| Hemlock | 25,730 | 19,636 | 14,273 | 15,643 | 16,993 | 20,765 | 18,652 | 16,335 | 9,111 | 14,284 | 18,169 | 11,383 | 13,165 | 11,113 |
| Western Red Cedar | 1,780 | 2,083 | 1,301 | 1,498 | 2,254 | 1,471 | 1,291 | 1,651 | 871 | 1,391 | 2,306 | 1,365 | 1,107 | 1,553 |
| Douglas Fir | 3,738 | 3,996 | 5,090 | 3,700 | 6,026 | 4,037 | 2,813 | 3,661 | 1,703 | 2,458 | 4,176 | 2,655 | 4,025 | 3,262 |
| Yellow Cedar | 968 | 499 | 459 | 126 | 120 | 105 | 421 | 389 | 18 | 81 | 71 | 567 | 692 | 326 |
| Sitka Spruce | 18 | 0 | 1,256 | 334 | 0 | 0 | 0 | 0 | 25 | 46 | 17 | 98 | 0 | 22 |
| Other | 1,832 | 2,068 | 2,685 | 1,451 | 1,028 | 1,193 | 867 | 2,139 | 387 | 2,331 | 2,121 | 501 | 925 | 651 |
| Total | 155,182 | 139,032 | 136,614 | 138,191 | 119,747 | 136,926 | 119,467 | 106,212 | 79,945 | 102,786 | 141,309 | 137,992 | 124,642 | 112,825 |
Year-to-Date Volume and Value of B.C. Lumber Exports to China (Incl. Hong Kong)
| Volume (Cubic Metres) | Value (000s of $CDN) | ||||||||||
| Commodity | 2012 | 2013 | 2014 | YTD 2014 | YTD 2015 | 2012 | 2013 | 2014 | YTD 2014 | YTD 2015 | |
| SPF | 6,463,716 | 6,739,150 | 6,272,267 | 3,025,617 | 3,002,810 | 880,959 | 1,137,732 | 1,138,312 | 531,181 | 586,521 | |
| Hemlock | 692,434 | 841,798 | 960,216 | 483,951 | 365,349 | 124,080 | 174,091 | 207,204 | 104,542 | 77,225 | |
| Western Red Cedar | 57,489 | 65,812 | 45,869 | 24,519 | 18,263 | 19,663 | 23,089 | 19,807 | 10,343 | 8,593 | |
| Douglas Fir | 200,030 | 254,693 | 211,165 | 79,724 | 91,865 | 35,847 | 50,820 | 41,574 | 16,247 | 18,280 | |
| Yellow Cedar | 14,613 | 18,824 | 15,001 | 9,166 | 4,574 | 4,609 | 5,485 | 4,042 | 2,422 | 1,756 | |
| Sitka Spruce | 974 | 2,103 | 6,502 | 124 | 500 | 174 | 651 | 1,630 | 41 | 207 | |
| Other | 76,924 | 75,966 | 88,750 | 44,240 | 29,846 | 15,001 | 16,795 | 19,428 | 10,065 | 6,916 | |
| Total | 7,506,180 | 7,998,346 | 7,599,770 | 3,667,341 | 3,513,207 | 1,080,332 | 1,408,661 | 1,431,998 | 674,840 | 699,498 | |
YTD = Year-to-Date to June
Japan Economy, Construction & Lumber Shipments

By Shawn Lawlor
Director, Canada Wood Japan
September 3, 2015
Posted in: Japan
Japan Economic Update: Abenomics Stall
Japan’s economy hit the brakes in the April to June quarter, with annualized GDP posting a 1.6% contraction. Consumer spending dropped 3.1% over the same period as real wages are failing to keep pace with rising taxes and inflation. With the Chinese economy cooling off and the depreciation of the Yuan, the outlook for Japanese manufacturing and exports remains challenging. To date, although Prime Minister Shinzo Abe’s economic policies have engineered notable increases in the equity markets, the gains do not appear to be trickling down to the broader consumer economy. As a result cabinet approval has steadily eroded from its peak, slipping to 37% at present. Since the beginning of the year, much of the legislative house agenda has been focused on pushing through unpopular national security bills and revisions to Japan’s pacifist constitution rather than focusing on economic issues. Popular criticism is mounting that the LDP needs to refocus efforts on revitalizing the economy. Some market analysts predict additional fiscal stimulus and continued quantitative easing, yet without addressing key structural reforms as initially promised under the Abenomics moniker, simply adding stimulus is unlikely to yield much in terms of incremental economic growth.
Japan Housing Starts Summary
Japanese Monthly Housing Starts Summary for June 2015
June results surprised with the strongest showing since 2008. Total housing starts jumped 16.3% in June to finish at 88,118 units. Owner occupied single family starts increased 7.2% and rentals increased 14.6%. The mansion condominium market increased a staggering 82.8%. (This segment is typically more volatile depending on the timing of large new projects).
Total wooden housing increased 8.9% to 46,151 units. Post and beam starts were up 7.2% to 34,042 units. Wooden pre-fab starts increased 14.4% to 1,382 units. Platform frame starts posted a solid 14% gain to finish at 10,727 units; with custom ordered single family homes increasing 6.9% to 3,052 units and rentals up 21% to 6,383 units. However, built for sale 2×4 spec housing declined 2.6% to 1,240 units.
B.C. Softwood Exports to Japan
The results for B.C. softwood lumber shipments to Japan year to date through until the end of June were as follows: total shipments were 1,027,603m3, a decrease of 6.5% over year prior results; SPF shipments totaled 699,155m3 (3.0%); Hem Fir shipments were 139,968m3 (16%); Fir totaled 119,531m3 (3.3%); and Yellow Cedar fell 19.1% to 42,694m3. The total value of shipments for the first half of 2015 totaled $354.9 million compared to $381.6 million in 2014.
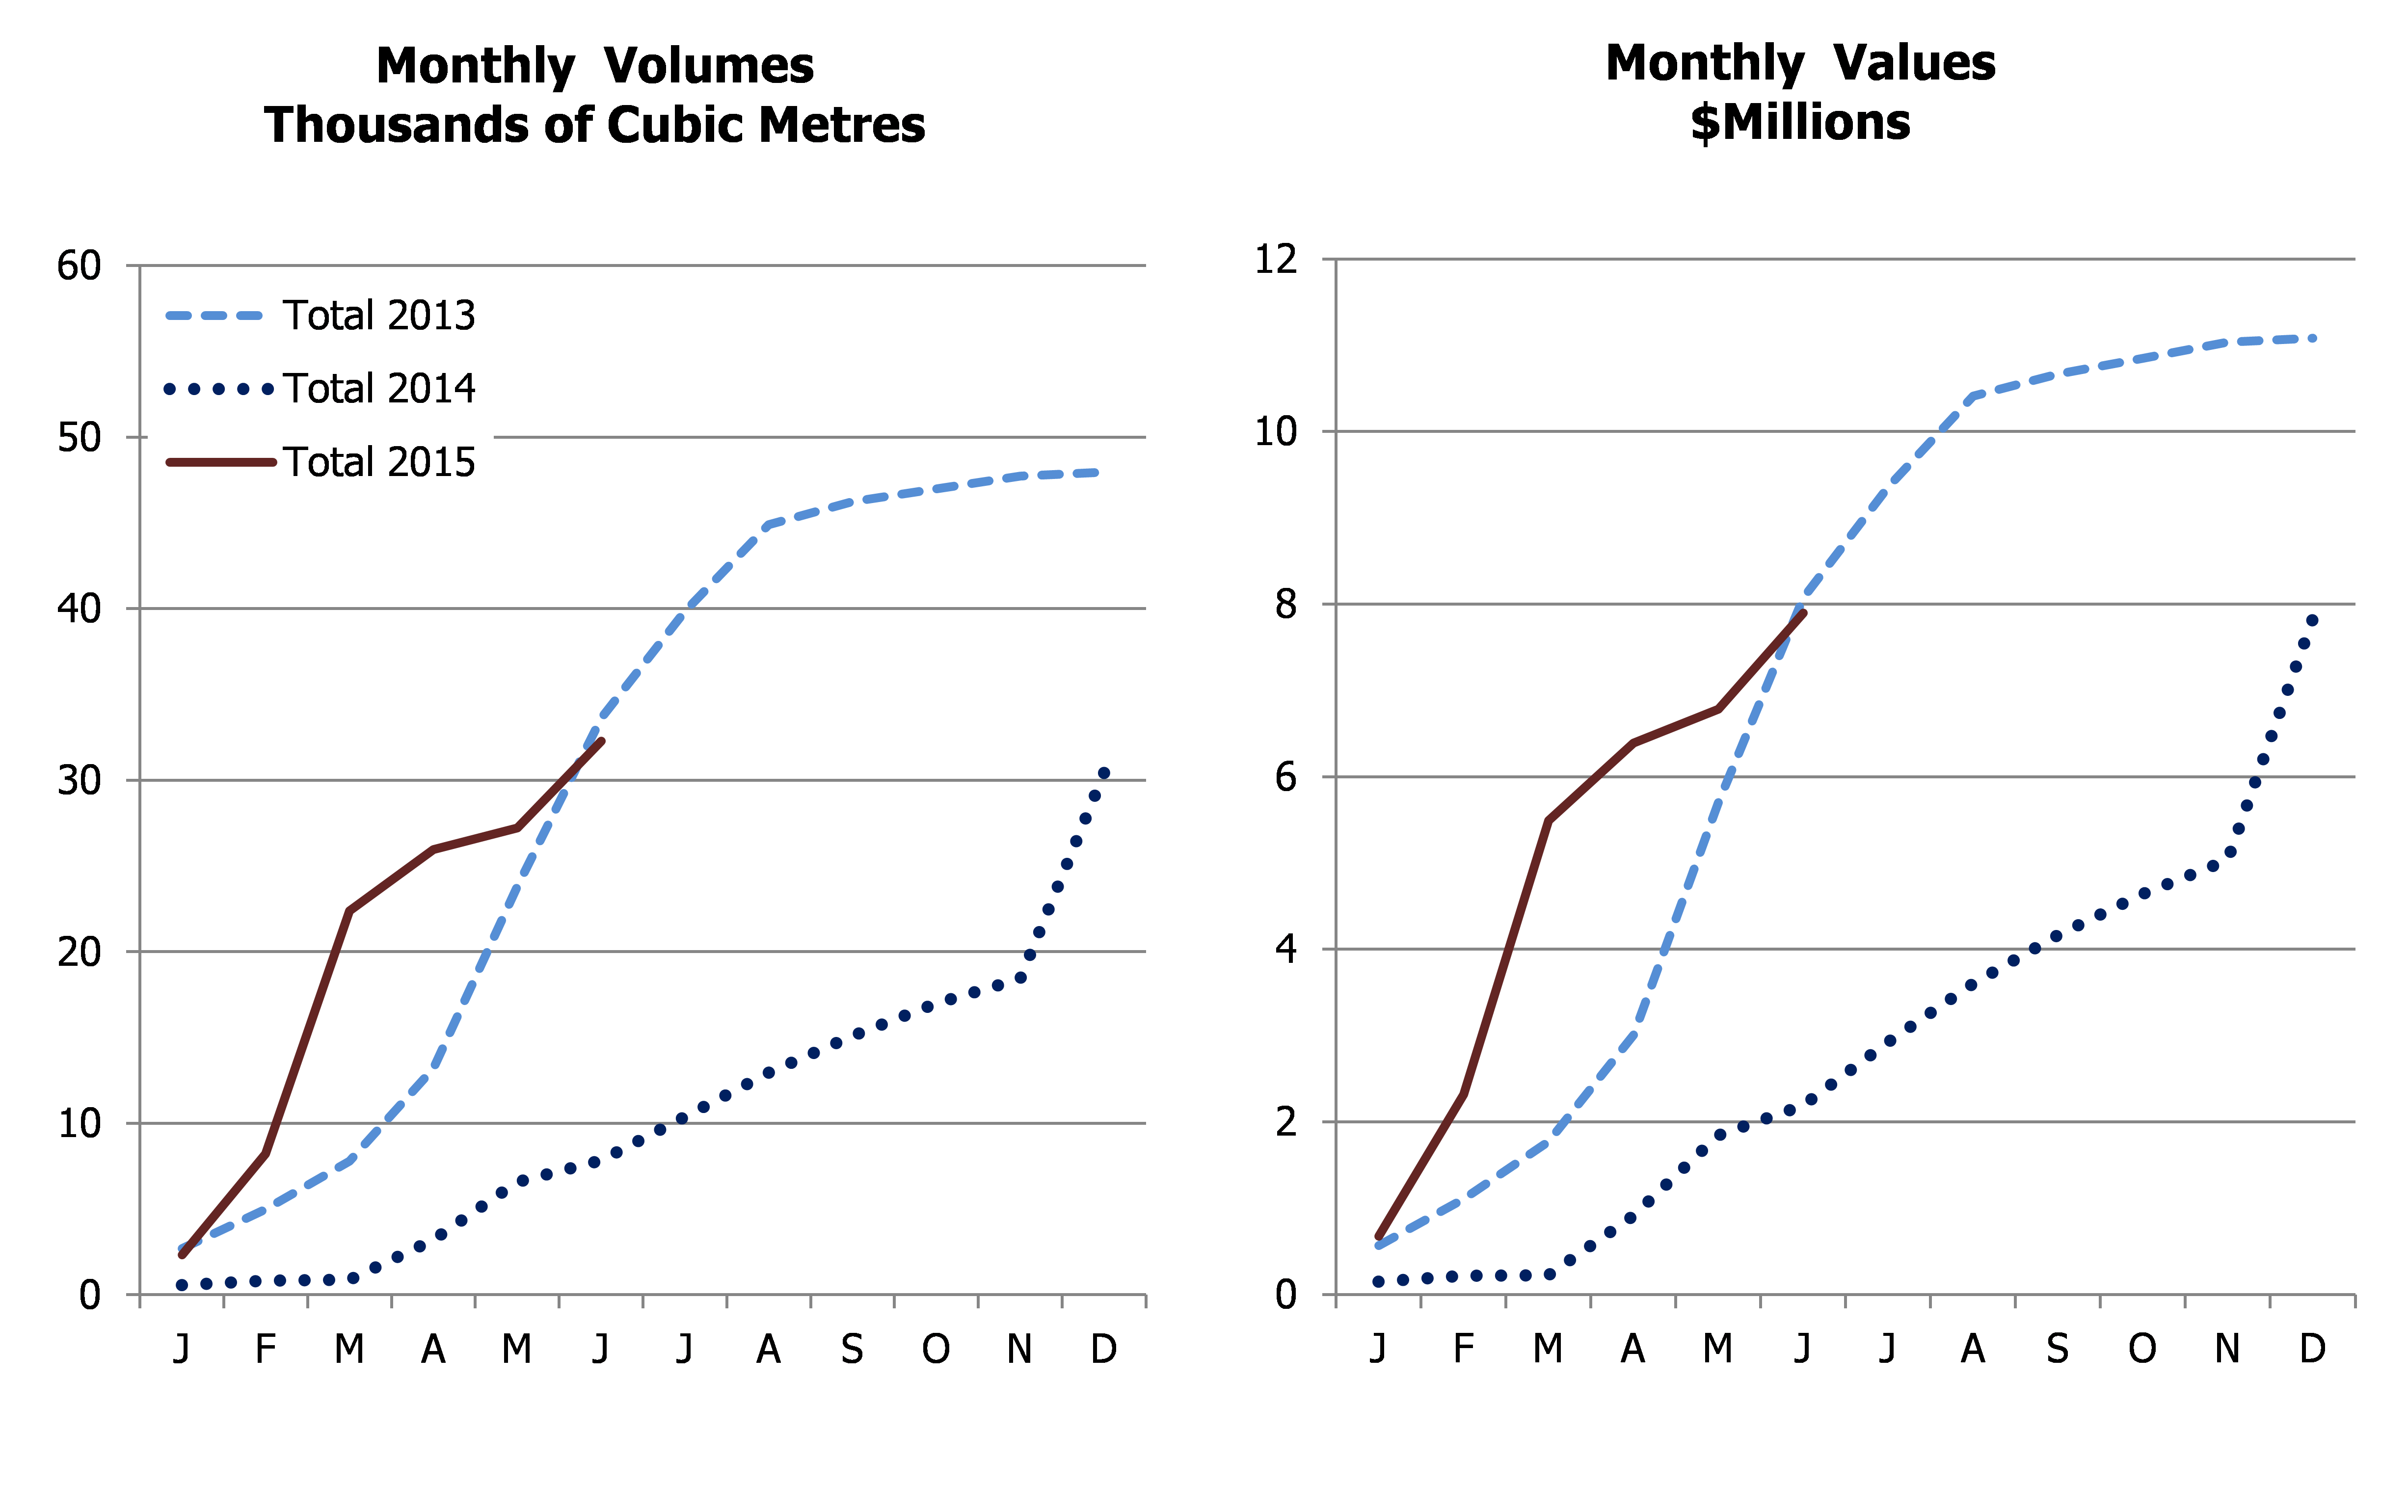
BC Forest Investment and Innovations BC Softwood Lumber Exports to Japan
2013/2015 Cumulative

Cumulative Volume (Thousands of Cubic Metres)
| Jan | Feb | Mar | Apr | May | June | July | Aug | Sep | Oct | Nov | Dec | |
| Total 2013 | 166.8 | 386.1 | 605.3 | 871.6 | 1,101.2 | 1,341.9 | 1,547.8 | 1,770.7 | 1,983.6 | 2,249.5 | 2,435.4 | 2,626.4 |
| Total 2014 | 160.9 | 346.9 | 418.5 | 626.4 | 872.3 | 1,099.4 | 1,238.0 | 1,404.7 | 1,612.4 | 1,810.3 | 1,968.4 | 2,135.7 |
| Total 2015 | 160.0 | 305.9 | 509.4 | 682.7 | 869.6 | 1,027.6 |
Cumulative Value (Millions of Dollars)
| Jan | Feb | Mar | Apr | May | June | July | Aug | Sep | Oct | Nov | Dec | |
| Total 2013 | 42.7 | 106.7 | 172.1 | 252.0 | 325.1 | 404.0 | 469.8 | 543.5 | 614.5 | 700.6 | 760.0 | 825.3 |
| Total 2014 | 52.8 | 120.2 | 148.1 | 221.4 | 304.7 | 381.6 | 428.6 | 485.0 | 552.4 | 617.7 | 673.3 | 731.3 |
| Total 2015 | 55.6 | 107.8 | 179.0 | 238.9 | 299.5 | 355.0 |
Volume of B.C. Lumber Exports to Japan
2014/2015
(Cubic Metres)

| Commodity | May | Jun | Jul | Aug | Sep | Oct | Nov | Dec | Jan | Feb | Mar | Apr | May | Jun |
| SPF | 178,907 | 153,241 | 86,007 | 117,766 | 143,988 | 140,469 | 107,479 | 109,022 | 108,402 | 98,063 | 133,675 | 125,354 | 133,991 | 99,670 |
| Hemlock | 26,347 | 29,266 | 22,399 | 19,792 | 36,440 | 28,389 | 24,108 | 24,347 | 24,458 | 17,231 | 28,737 | 18,520 | 26,158 | 24,864 |
| Western Red Cedar | 1,508 | 1,714 | 1,562 | 1,622 | 1,604 | 1,474 | 1,409 | 1,930 | 750 | 1,195 | 1,745 | 2,012 | 1,412 | 1,677 |
| Douglas Fir | 24,781 | 28,770 | 19,024 | 16,869 | 14,596 | 15,134 | 19,290 | 20,692 | 18,451 | 18,117 | 25,032 | 18,949 | 17,041 | 21,941 |
| Yellow Cedar | 7,773 | 9,371 | 3,910 | 5,286 | 6,878 | 5,314 | 2,996 | 8,905 | 5,449 | 8,147 | 10,976 | 4,962 | 5,255 | 7,905 |
| Sitka Spruce | 1,501 | 435 | 1,587 | 1,164 | 596 | 2,075 | 119 | 633 | 681 | 50 | 332 | 240 | 1,590 | 406 |
| Other | 5,050 | 4,347 | 4,049 | 4,224 | 3,633 | 5,013 | 2,704 | 1,815 | 1,843 | 3,102 | 3,009 | 3,238 | 1,415 | 1,558 |
| Total | 245,867 | 227,144 | 138,538 | 166,723 | 207,735 | 197,868 | 158,105 | 167,344 | 160,034 | 145,905 | 203,506 | 173,275 | 186,862 | 158,021 |
Value of B.C. Lumber Exports to Japan
2014/2015
(000s of $CDN)

| Commodity | May | Jun | Jul | Aug | Sep | Oct | Nov | Dec | Jan | Feb | Mar | Apr | May | Jun |
| SPF | 51,574 | 44,432 | 24,220 | 35,207 | 40,680 | 40,194 | 31,340 | 32,694 | 32,506 | 29,491 | 39,672 | 37,315 | 37,125 | 29,475 |
| Hemlock | 10,939 | 11,346 | 8,119 | 7,663 | 13,468 | 10,694 | 11,422 | 9,390 | 9,736 | 7,781 | 11,827 | 7,573 | 10,279 | 10,254 |
| Western Red Cedar | 1,352 | 1,313 | 1,426 | 1,253 | 1,556 | 1,208 | 1,362 | 1,704 | 739 | 1,154 | 1,916 | 1,768 | 1,411 | 1,697 |
| Douglas Fir | 12,590 | 13,160 | 8,805 | 7,553 | 6,649 | 6,477 | 8,420 | 9,344 | 8,469 | 8,448 | 11,175 | 8,785 | 8,050 | 9,319 |
| Yellow Cedar | 3,892 | 4,348 | 1,993 | 2,536 | 2,900 | 2,554 | 1,637 | 3,634 | 2,943 | 3,951 | 5,213 | 2,613 | 2,670 | 3,838 |
| Sitka Spruce | 928 | 303 | 856 | 535 | 551 | 1,686 | 75 | 435 | 307 | 26 | 119 | 171 | 342 | 166 |
| Other | 2,022 | 1,976 | 1,584 | 1,680 | 1,514 | 2,566 | 1,318 | 801 | 892 | 1,391 | 1,205 | 1,757 | 633 | 777 |
| Total | 83,298 | 76,877 | 47,002 | 56,426 | 67,318 | 65,378 | 55,574 | 58,001 | 55,593 | 52,243 | 71,127 | 59,981 | 60,511 | 55,526 |
Year-to-Date Volume and Value of B.C. Lumber Exports to Japan
| Volume (Cubic Metres) | Value (000s of $CDN) | ||||||||||
| Commodity | 2012 | 2013 | 2014 | YTD 2014 | YTD 2015 | 2012 | 2013 | 2014 | YTD 2014 | YTD2015 | |
| SPF | 1,611,329 | 1,784,953 | 1,425,378 | 720,647 | 699,155 | 327,313 | 474,749 | 413,494 | 209,159 | 205,584 | |
| Hemlock | 404,819 | 404,046 | 322,308 | 166,833 | 139,968 | 161,171 | 153,542 | 128,822 | 68,067 | 57,450 | |
| Western Red Cedar | 19,538 | 21,720 | 18,197 | 8,596 | 8,791 | 13,403 | 16,626 | 15,541 | 7,031 | 8,685 | |
| Douglas Fir | 260,867 | 261,675 | 229,183 | 123,578 | 119,531 | 99,189 | 111,068 | 107,414 | 60,167 | 54,247 | |
| Yellow Cedar | 110,879 | 100,009 | 86,073 | 52,784 | 42,694 | 57,729 | 44,898 | 40,183 | 24,930 | 21,228 | |
| Sitka Spruce | 8,700 | 9,405 | 10,980 | 4,806 | 3,299 | 4,712 | 5,592 | 7,119 | 2,982 | 1,131 | |
| Other | 25,476 | 44,583 | 43,627 | 22,189 | 14,165 | 10,474 | 18,868 | 18,744 | 9,281 | 6,656 | |
| Total | 2,441,608 | 2,626,391 | 2,135,746 | 1,099,433 | 1,027,603 | 673,990 | 825,344 | 731,317 | 381,618 | 354,981 | |
YTD = Year-to-Date to June
Korean Economy, Construction & Lumber Shipments
By Tai Jeong

Technical Director, Canada Wood Korea
September 1, 2015
Posted in: Korea
Economy Update
The depreciation of the Chinese yuan ignited concerns across the world that the Chinese economy is worse than expected. South Korea, as an export depending country, will likely suffer a direct or indirect impact from the current Chinese economic difficulty.South Korea’s exports in the first seven months of 2015 contracted 4.9% to $315.2 billion, while imports nosedived 15.5% to $261.2 billion compared with those for the same period in 2014.
As a result, the country’s cumulative trade surplus in the first seven months of 2015 stood at $54 billion, much larger than the $22.2 billion in the black posted for the same period in 2014.
South Korea’s private consumption has remained in the doldrums since the MERS outbreak in late May. As part of efforts to stimulate anemic consumer spending that is weighing down economic growth, South Korean government unveiled measures to cut consumption taxes on some goods temporarily, predicting that the consumption-boosting measures will raise the country’s economic growth rate by 0.025 percentage point. South Korea is trying to achieve at least 3% GDP growth in 2015, although many independent think tanks predict mid-to-high 2% GDP growth is more realistic for 2015.
South Korea’s consumer prices grew less than 1% for the 8th straight month in July. Jobless rate inched down to 3.7% in July.
The real value of the South Korean won against key foreign currencies dropped 2.2% on-month in July, providing exporters with breathing room to boost their overseas sales that had taken a hit from a strong won. The exchange rate for Canadian Dollar averaged at 891.31 won in July, 2015, down 6.27 % from 950.94 in July, 2014 and down by 0.97% from 900.07 in one month earlier.
Housing Construction
South Korea’s housing starts in year-to-date June of 2015 increased 18.7% to 54,585 buildings from a year earlier 45,994 buildings owing to the continuous government measures to revamp the country’s property market and the increased demand from end-users on new housings. Housing permits in the same period also increased 15.9% to 58,254 buildings from a year earlier 50,283 buildings.
The number of wood building permits and wood building starts in year-to-date June of 2015 continuously increased 15.5% to 7,428 buildings and 17.6% to 6,613 buildings respectively compared with those in 2014.

Source: Ministry of Land, Infrastructure and Transport (as a percent compared to previous year same month and period)
Lumber Shipments
South Korea’s home transactions surged to a new monthly high in July pointing to a strong recovery in the real estate market. In the first seven months of 2015, home transactions spiked 31% on-year to 721,471. By type, apartment transactions surged 40.3 percent on-year to 74,112, while transactions involving row houses spiked 56.7 percent to 19,900. Transactions of detached houses also surged 41.7 percent to 16,663.

BC softwood lumber export volume to South Korea for the first six months in 2015 dramatically increased 17.1% to 165,136 cubic meters as compared to 141,014 cubic meters for the same period in 2014. As a consequence of increased export volume, export value in year-to-date June also increased 17.4% to CAD$43.859 million as compared to CAD$37.363 million in the same period in 2014.
BC Softwood Lumber Exports to South Korea 2013/2015 Cumulative

As market diversification increases, so do number of phytosanitary issues
By Brian Zak

Large wooden structures such as these townhomes in Shanghai are gaining in popularity — just one of several factors leading to the increased demand for Canadian wood products in Asia.
Monitoring and attending to phytosanitary issues of our forest products in the offshore markets continues to be challenging. Shipments have expanded as new entrants to offshore markets become increasingly prevalent and, as existing shippers reach further into traditional and newly expanding markets. Shippers continue to reduce their reliance on the US marketplace as its recovery continues to languish with no visible signs of strength in the foreseeable future.
The trending of volumes being shipped to the offshore markets continues to increase as shown in the following table. The percentage of offshore shipments in comparison to total shipments has grown annually from 9% in 2005, to >37% in the first 8 months of 2011. Based on YTD shipments the offshore volumes will have more than doubled by the end of 2011 over 2005 levels.
These volumes are significant in terms of workloads for CFIA and Canada Wood staff especially in the Western Region.
Comments from Industry analysts and industry shippers both anticipate that continued success with clients in the offshore markets and the reduced reliance on the US marketplace will likely be part of the longer term strategy for a majority of Canadian shippers.
There continues to be an increasing number of difficulties incurred at the receiving end in the offshore inspection and entry process. This is further evidenced by the amount of collaboration between CFIA, Canada Wood, and Embassy staffs in clarifying the export requirements of importing countries and entry into new Ports.
Phytosanitary Issues
- Documentation:
Phytosanitary documentation for offshore exports has become increasingly complex and varies by country for different species and the various product categories. New shippers to offshore programs are continually referred to Canada Wood staff for an “understanding of the rules” and how to prepare their product for “export inspections” and/or “offshore entry requirements.”
* Documentation breaches are viewed seriously, especially so in the Asian markets. As the broader industry expands it reach into new markets or into new Ports of the existing markets, the breaches have increased.
* Clearance delays continue throughout 2011 – some of which are the result of industry infractions associated with new shippers. Delays at the China and India receiving ports are also attributed to “port staff or individuals” who are interpreting the rules differently from negotiated rulings with Canada.
* Seizures and forfeitures associated with breaches in phytosanitary rules and documentation has reduced – however “treatment on entry requirements” has increased. This is most often related to the “mis-interpretations” associated with our species, documentation and/or KD/HT treatments that are not understood at time of entry by individual inspectors.
* Import Permits are oftentimes required by many offshore markets and need to be presented to CFIA for Phytosanitary Inspections. We continue to see permits made out in the wrong species names or new shippers not understanding the rules.
- Country Matrix Guidelines
Canada Wood and CFlA have been in continuous discussions on how best to increase the understanding of Canadian shippers to the rules and regulations in the offshore markets. Canada Wood had proposed to publish the “Phytosanitary Guidelines Matrix” for Offshore Markets on the Canada Wood website. CFIA in the last week has now offered suggestions on how Canada Wood might consider the trial publishing of “phytosanitary guidelines” on the Canada Wood website.
These “Guidelines” would provide the rudimentary information for the phytosanitary conditions of entry into 15-18 offshore markets and it would provide industry with enough information for to determine whether or not one needs to get the “official clarifications” from CFIA. It is the intent of Canada Wood to keep these current and add different countries going forward. Watch for this Matrix by early Spring.
- Other Issues being addressed by Canada Wood:
* E-Certification and/or E-Mail Certification trials being addressed by CFIA and Cda Wood.
* E-signatures on HT Certificates continues to be explored – might fit in with E-Mail Certifications between Governments
* China Taicang log and lumber – offload delays for up to 2 weeks – addressing in China
* Timeliness of PCs = industry want an increase in “alternative service delivery programs”
* Fumigation alternative(s) being explored – Phosphine looking potentially out of reach at this point in time – time, temperature, corrosiveness, and more $ needed to finish the research yet. It does show that it has some promise at being a potential fumigant.
* India:
Import permits for 3 species of SPF – we are pushing for 1 collective-mix permit for SPF
The acceptance of Eastern species of spruce and Ash is in process
India – HT Cert as an option to a PC is being addressed
* Indonesia is regulating for Pinewood Nematode and they want any species that has “true firs” to be HT prior to entry including Hem-Fir. This is being addressed by CFIA in order to allow green Hem-Fir to have entry without treatments.
* Malaysia is regulating HT on the basis of 74 degrees C to the lumber core for a minimum of 6 hours depending on the thickness. Canada Wood is working with CFIA to accept the CHTWPCP 56 degree/30 minutes at the core and hope to have it resolved before March.
* Canada Wood is working with CFIA and DFAIT to convince Turkey to treat the entry of Cedar equal to that of the EU.
Market Overview
Overall economic conditions softened in India in 2013. With a weaker Rupee increasing the price of imports, GDP growth slowed to 3.8 per cent and inflation rose to 11 per cent.
An upswing in the southern yellow pine supply from the U.S., and pine and spruce exports from Germany, created a much more competitive market for wood products during the year, resulting in a drop in B.C.’s share of total imports. However, imports and consumption of softwoods are expanding and long-term trends remain positive in this nascent softwood market. FPInnovations estimates that softwood lumber consumption in India grew by seven per cent in 2013.
SPF remains the dominant species in current shipments from B.C. to India; however, FII is seeing strong interest in Coastal species for applications that have traditionally consumed hardwoods. This suggests positive growth prospects for hemlock, western red cedar and Douglas-fir, Log export bans implemented in Myanmar, and trade restrictions in other key hardwood supply locations, continue to influence a trend towards substitution of softwood for hardwoods and an increased interest in lumber imports.
Long-term demographic trends suggest that the expanding and young middle class in India presents an excellent potential market for softwoods. Combined with continued economic growth, this demographic shift suggests that most of the buildings that will exist in India by 2030 are yet to be built. While wood frame construction is not the primary focus of FII’s market development strategy, these positive long-term construction trends may lead to the development of a robust market for interior products and finishing materials made from B.C. softwoods.
In July 2013, ongoing work on phytosanitary barriers led to the approval of Eastern SPF to India. Market access work continues in India to ensure that Canadian species are well understood and have smooth passage through customs and regulatory bodies. Canada-India Free Trade negotiations continue, which could yield further reductions in the tariffs on Canadian wood products in the medium term.
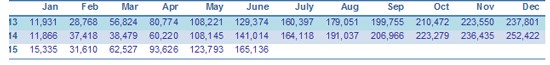
BC Softwood Lumber Exports to India BC Forest Investment and Innovation
2013/2015 Cumulative
Cumulative Volume (Cubic Metres)
| Jan | Feb | Mar | Apr | May | June | July | Aug | Sep | Oct | Nov | Dec | |
| Total 2013 | 2,697 | 4,986 | 7,802 | 13,189 | 23,823 | 33,618 | 39,837 | 44,899 | 46,250 | 46,983 | 47,726 | 47,959 |
| Total 2014 | 579 | 826 | 886 | 3,201 | 6,580 | 7,841 | 10,382 | 12,944 | 15,089 | 16,996 | 18,424 | 30,439 |
| Total 2015 | 2,324 | 8,232 | 22,372 | 25,951 | 27,220 | 32,285 |
Cumulative Value (Thousands of Dollars)
| Jan | Feb | Mar | Apr | May | June | July | Aug | Sep | Oct | Nov | Dec | |
| Total 2013 | 569 | 1,106 | 1,776 | 3,007 | 5,704 | 8,076 | 9,358 | 10,413 | 10,667 | 10,850 | 11,036 | 11,084 |
| Total 2014 | 148 | 217 | 225 | 910 | 1,847 | 2,190 | 2,927 | 3,603 | 4,164 | 4,640 | 5,035 | 7,841 |
| Total 2015 | 675 | 2,318 | 5,493 | 6,390 | 6,785 | 7,896 |
Volume of B.C. Lumber Exports to India
2014/2015
(Cubic Metres)
| Commodity | May | Jun | Jul | Aug | Sep | Oct | Nov | Dec | Jan | Feb | Mar | Apr | May | Jun |
| SPF | 2,997 | 1,261 | 2,226 | 2,449 | 1,969 | 1,907 | 1,428 | 11,870 | 2,103 | 5,907 | 13,997 | 3,544 | 1,104 | 5,026 |
| Hemlock | 83 | 0 | 0 | 0 | 0 | 0 | 0 | 80 | 0 | 0 | 0 | 0 | 0 | 0 |
| Western Red Cedar | 46 | 0 | 0 | 14 | 0 | 0 | 0 | 0 | 0 | 0 | 0 | 0 | 0 | 0 |
| Douglas Fir | 133 | 0 | 279 | 0 | 111 | 0 | 0 | 0 | 221 | 0 | 143 | 0 | 0 | 0 |
| Yellow Cedar | 120 | 0 | 36 | 99 | 65 | 0 | 0 | 65 | 0 | 0 | 0 | 35 | 165 | 39 |
| Sitka Spruce | 0 | 0 | 0 | 0 | 0 | 0 | 0 | 0 | 0 | 0 | 0 | 0 | 0 | 0 |
| Other | 0 | 0 | 0 | 0 | 0 | 0 | 0 | 0 | 0 | 1 | 0 | 0 | 0 | 0 |
| Total | 3,379 | 1,261 | 2,541 | 2,562 | 2,145 | 1,907 | 1,428 | 12,015 | 2,324 | 5,908 | 14,140 | 3,579 | 1,269 | 5,065 |
Value of B.C. Lumber Exports to India
2014/2015
(000s of $CDN)
| Commodity | May | Jun | Jul | Aug | Sep | Oct | Nov | Dec | Jan | Feb | Mar | Apr | May | Jun |
| SPF | 829 | 343 | 638 | 645 | 514 | 476 | 395 | 2,766 | 604 | 1,640 | 3,130 | 890 | 324 | 1,101 |
| Hemlock | 31 | 0 | 0 | 0 | 0 | 0 | 0 | 25 | 0 | 1 | 0 | 0 | 0 | 0 |
| Western Red Cedar | 25 | 0 | 0 | 17 | 0 | 0 | 0 | 0 | 0 | 1 | 0 | 0 | 0 | 0 |
| Douglas Fir | 35 | 0 | 78 | 0 | 37 | 0 | 0 | 0 | 71 | 1 | 45 | 0 | 0 | 0 |
| Yellow Cedar | 17 | 0 | 20 | 14 | 10 | 0 | 0 | 15 | 0 | 1 | 0 | 8 | 71 | 11 |
| Sitka Spruce | 0 | 0 | 0 | 0 | 0 | 0 | 0 | 0 | 0 | 0 | 0 | 0 | 0 | 0 |
| Other | 0 | 0 | 0 | 0 | 0 | 0 | 0 | 0 | 0 | 1 | 0 | 0 | 0 | 0 |
| Total | 937 | 343 | 737 | 677 | 561 | 476 | 395 | 2,806 | 675 | 1,643 | 3,175 | 898 | 394 | 1,111 |
Year-to-Date Volume and Value of B.C. Lumber Exports to India

| Volume (Cubic Metres) | Value (000s of $CDN) | ||||||||||
| Commodity | 2012 | 2013 | 2014 | YTD 2014 | YTD 2015 | 2012 | 2013 | 2014 | YTD 2014 | YTD2015 | |
| SPF | 49,101 | 45,308 | 28,543 | 6,694 | 31,681 | 8,115 | 10,424 | 7,251 | 1,816 | 7,689 | |
| Hemlock | 52 | 94 | 163 | 83 | 0 | 9 | 34 | 56 | 31 | 1 | |
| Western Red Cedar | 4 | 6 | 407 | 393 | 0 | 2 | 4 | 237 | 220 | 1 | |
| Douglas Fir | 3,543 | 2,312 | 851 | 461 | 364 | 590 | 583 | 208 | 93 | 116 | |
| Yellow Cedar | 0 | 38 | 445 | 180 | 239 | 0 | 7 | 84 | 26 | 89 | |
| Sitka Spruce | 0 | 0 | 0 | 0 | 0 | 0 | 0 | 0 | 0 | 0 | |
| Other | 120 | 201 | 30 | 30 | 1 | 18 | 32 | 4 | 4 | 1 | |
| Total | 52,820 | 47,959 | 30,439 | 7,841 | 32,285 | 8,735 | 11,084 | 7,841 | 2,190 | 7,896 | |
YTD = Year-to-Date to June
