Third and Fourth Quarter 2018 North American Housing News

Canada Housing News

The big chill: A five-year house price forecast for 33 Canadian cities

Micheal.jpg

Michael Babad

Published October 3, 2018

New forecasts suggest it’s “time for slower price growth” in Canadian housing markets.

Indeed, Moody’s Analytics and RPS Real Property Solutions have cut their five-year projections for many of the 33 cities studied from earlier forecasts in May.

The predictions from Moody’s Analytics, the sister company of the credit rating agency, which are based on RPS data, indicate federal and provincial policy makers have pulled off what they set out to do when they brought in measures to tame bubbly markets such as those in Toronto and Vancouver.

They also come amid fresh numbers that show the Vancouver-area market still struggling after British Columbia imposed an additional tax on foreign buyers of local real estate in 2016 and new federal mortgage-qualification rules were introduced last January.

At the same time, interest rates are rising, and are expected to continue to do so, further pressuring demand in what had, until recently, been unstoppable housing markets.

“Two macroeconomic projections now dominate housing markets in Canada,” said Moody’s economist Andrew Carbacho-Burgos.

“The first is that the [Bank of Canada] will continue to tighten short-term interest rates through 2020 in order to head off inflation and main­tain the value of the Canadian dollar rela­tive to its U.S. counterpart,” he added in his report released today, titled “Canada housing market outlook: Time for slower price growth.”

“With some lag, monetary tightening will pull up mortgage rates. The five-year mortgage rate is now at about 4.4 per cent after bottoming out at 3.6 per cent in mid-2017; the Moody’s Analytics baseline projection is that it will continue to increase until it levels off at about 6 per cent by late 2020.”

Here’s what Moody’s expects over the course of five years:

avg home price increases

Source: RPS, Moody’s Analytics

There are other interesting tidbits in the report along with projections, these based on single-family homes:

1: Most Ontario cities “are still significantly overvalued, but this overvaluation has, on average, started to decrease.”

2: Toronto is overpriced to the tune of 51 per cent, compared to 53 per cent in May. Others that have come down even more sharply are the Ontario centres of Barrie, Guelph and Brantford.

3: The overpriced Vancouver market has also cooled off, but overvaluation still tops 40 per cent.

4: Montreal’s market is undervalued, but by less than 4 per cent.

5: Edmonton remains “the most undervalued metro area” in the country, by about 20 per cent, but it should see a faster pace of price growth after mortgage rate hikes end “thanks to a combination of reduced listings and increased opportunistic purchases.”

6: Saskatoon and most Atlantic cities are “moderately undervalued.”

“The national housing market still has a long way to go before it regains the level of affordability it had before 2015, when prices in Toronto and Vancouver took off, but has now taken the first steps to do so,” Mr. Carbacho-Burgos said.

“The important points are, first, that there is no serious projected house price correction,” he added.

“Second, median family income growth will have a good chance of keeping up with and even outpacing house prices in coming years, improving affordability. Third, the lack of a significant house price decline will prevent mortgage debt performance from deteriorating, especially after 2020, when mortgage rates level off.”

But along with that came a few notable warnings. Among them:

1: “Given that most of the house price increases took place in Toronto and Vancouver, there is still the downside risk that higher mortgage rates and the borrower stress tests could push down demand in the Atlantic and Prairie provinces, leading to a full house price correction and a perceptible drop in sales in these regions.”

2: “The main downside risk now is that the measures taken to stabilize housing affordability and mortgage credit quality may prove too strong and may precipitate not just a house price correction, but also an extended decline in sales and possibly a reduction in home ownership. However, the data for July and August indicate that home sales and house price growth have started to rally, so it is too soon to be pessimistic.”

3: While financing is showing little sign of stress, it is “starting to show the first looming danger signs.” Mortgage delinquency rates are at their best since the early 1990s, though those in Alberta, Saskatchewan and eastern Canada are notably above the national average.

“More important, the slow growth of income relative to house prices has led to a steady increase in the ratio of mortgage debt service to disposable income over the past 15 years, and this ratio is likely to keep increasing before the [Bank of Canada] finishes tightening interest rates,” Mr. Carbacho-Burgos said of that last part.

“Although it is possible to disagree over the merits of the new mortgage lending stress tests, the move to make mortgage lending more stringent is not surprising, given this 15-year trend.”

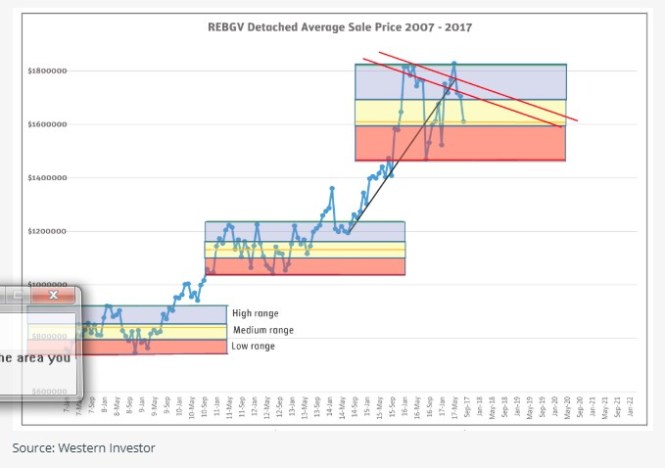
Vancouver, of course, is unique in Canada, with numbers released Tuesday showing a sales plunge of 43.5 per cent in September from a year earlier.

That’s “the steepest decline since the financial crisis and about 35 per cent below typical September activity seen over the past decade,” said Bank of Montreal senior economist Robert Kavcic.

“All the while, new listings jumped strongly in the month. To put it lightly, the market continues to struggle with past policy measures and higher interest rates. Indeed, prices continue to fade.”

The benchmark price is up, but just slightly above 2 per cent from a year earlier, while the cost of a detached home is down 4.5 per cent.

“We would not be holding our breath for a quick rebound in this market,” Mr. Kavcic said.

reater vancouver house prices

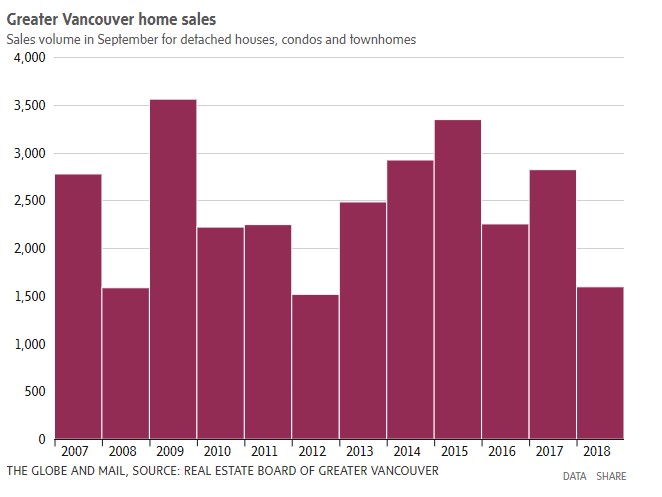
Greater Vancouver home sales

Sales volume in September for detached houses, condos and town homes

And, as The Globe and Mail’s Janet McFarland reports, Toronto’s housing market chalked up a modest sales gain in September after two much stronger months.

Sales climbed 1.9 per cent from a year earlier, as average prices gained 2.9 per cent in the same period, though dipped 0.5 per cent from August, according to Toronto Real Estate Board numbers released today.

“Looks like the whole market is balancing out about as well as policy makers could have hoped,” Mr. Kavcic said of the Toronto report.

“This could set us up for a period of price stability as solid demographic and job fundamentals are countered by rising interest rates.”

Separately, Mr. Kavcic’s colleague, BMO chief economist Douglas Porter, took a run through the latest Canadian credit numbers, noting they continue to show a slower pace of borrowing.

“The slowdown in credit – most notably, overall mortgages – syncs well with the broader cooling in housing market activity,” Mr. Porter said, citing the fact that the rise in total household borrowing eased in August to 3.7 per cent from a year earlier, while disposable income eclipsed that, at 3.9 per cent.

“The biggest chill has been in mortgage growth (not surprisingly), which has softened to a 3.6-per-cent year over-year clip from an average growth rate of about 6 per cent in the past two years,” he added.

“We are on the cusp of seeing the slowest growth in mortgage balances outstanding since the early 1980s.”

Read more

Janet McFarland: Toronto housing market’s hot rebound cools in September

Janet McFarland, Brent Jang: Vancouver housing prices slowly easing as sales tumble 43.5 per cent in September

Poltergeist II: The demons that still haunt Canada’s housing and credit markets

2018 has been unruly for housing markets: What’s ahead for your province

Rob Carrick: How the new NAFTA helps end a generational chance to score big in the housing market

Rob Carrick: It’s officially normal to have a big, fat balance on your line of credit

House price inflation in Canada suddenly trails that of 36 other countries

How $8-billion in added mortgage costs will squeeze Canadians and the economy

‘Cue the comeback’: The reawakening of many Canadian housing markets

Canada’s housing market scores first annual price gain in months

‘Good value for your money’: How downtown condo prices in Canadian cities compare globally

Carolyn Ireland: Sale by trial and error in Toronto’s housing market

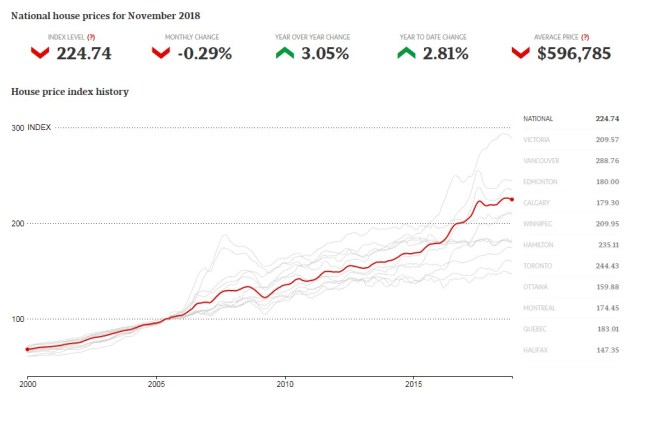
Canadian index falls as 8 markets decline

year to year price changes.jpg

Canada’s home prices dropped 0.3 per cent in November from October, according to the latest numbers from the Teranet-National Bank House Price Index.

The retreat marks only the fourth time in the index’s 20-year history that the national market dipped in November, according to National Bank of Canada senior economist Marc Pinsonneault.

The decline was quite broad-based, Mr. Pinsonneault adds, with eight of the 11 major metropolitan markets in negative territory.

Compared with November of 2017, the composite index rose 3.1 per cent last month to stand at 224.74. The national index is down 0.66 per cent from its peak in September of 2018.

Mr. Pinsonneault says that demand has cooled significantly – particularly in the country’s most expensive real estate markets – because of more stringent mortgage qualification rules and the rise in interest rates.

But Mr. Pinsonneault adds that interest rates appear set to rise more slowly than most economists previously thought. Hopes for a soft landing of the Canadian resale market are therefore still warranted, in his opinion.— Carolyn Ireland

victoria house prices

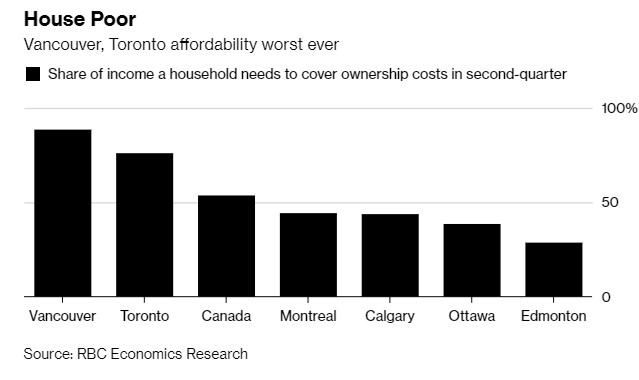
Cost of owning a home in Vancouver, Victoria ‘off the charts’ — and likely to get worse, warns RBC

It now costs 88 per cent of a typical income to carry a home in Vancouver, and 65 per cent of an income in Victoria.

Bloomberg News

Updated: September 28, 2018

cost of owning home canada

The cost of owning a home in Canada is at the highest level in 28 years and likely to get only more onerous as interest rates continue to rise, according to a report from Royal Bank of Canada.

Carrying a home, including the cost of a mortgage, property taxes and utilities, took up 54 per cent of a typical household’s pre-tax income in the second quarter, the Toronto-based bank said in a report on Friday. That’s up from 43 per cent three years ago.

“From overheating to correction to the onset of recovery, we’ve seen pretty much everything in the past three years in Canada’s housing market,” economists at the Toronto-based bank said in the report. “Yet an eye-watering loss of affordability has been a constant.”

Lack of affordability is “off the charts” in Vancouver, Toronto and Victoria, with RBC’s index at 88 per cent, 76 per cent and 65 per cent respectively — the highest in records going back to the mid-1980s. The measure uses an aggregate of all housing categories, including single-family detached homes and condos.

house poor

While rising prices had been the culprit behind the loss of affordability between 2015 and 2017, mortgage-rate increases accounted for the entire rise in carrying costs over the past year, the bank said. The country’s central bank has risen interest rates four times since July, 2017.

“We expect the Bank of Canada to proceed with further rate hikes that will raise its overnight rate from 1.50 per cent currently to 2.25 per cent in the first half of 2019,” the report said. “This will keep mortgage rates under upward pressure and boost ownership costs even more across Canada in the period ahead.”

B.C. is in a “mild” housing market recession, with the Lower Mainland shifting from a seller’s market to a “mild” buyer’s market, according to a new housing forecast report.

A recession is usually used to describe a period of significant decline in the economy, but that term also applies to a B.C. housing market marked by a sharp decline in home sales, eroding prices, and a slowdown in housing starts, said Bryan Yu, deputy chief economist of Central 1 Credit Union, which released its B.C. housing forecast for 2018 to 2021 on Tuesday.

“When we look at it through these lens, it’s the first time we’ve seen these slowdowns, a cycle where there’s a decline in the number of transactions, erosion of home prices … and new home construction activity seeing a contraction,” said Yu.

Resales of residential properties dropped 17 per cent from 2017 to 2018, said the report, while housing starts slowed by 10 per cent, with another 18 per cent drop forecast for 2019.

Aggregate sales in the province’s urban centres — the Vancouver, Kelowna, Victoria and Abbotsford-Mission CMAs — fell 40 per cent from the end of 2017, but even medium and small markets were hit with a 10 to 20 per cent reduction in activity.

“When you add all these factors together, from a buyer’s standpoint, you have less access to credit and less confidence in the market as well,” said Yu, who expects these factors to be reflected in prices in the coming year.

western investor av house price

A sales slump has cooled B.C.’s red-hot housing market, with the Lower Mainland shifting from a seller’s market to a “mild” buyer’s market, said a new report by Central 1 Credit Union. JONATHAN HAYWARD / THE CANADIAN PRESS

While median resale prices recorded a six per cent increase in 2018 compared to the previous year, it’ll dip a modest two per cent in 2019 to $520,000, said the report.

The trend will be more pronounced in the Lower Mainland/southwest region of B.C., where prices are expected to drop 3.6 per cent next year to $651,000.

But because the downturn is driven by policy measures such as the federal government’s mortgage stress test, the province’s introduction of the speculation tax and school tax, and Vancouver’s empty homes tax, and not by a broader economic slump, economists don’t see a major crash in housing prices.

There’s room for buyers to negotiate, but on the flip side, “the economy is strong enough that there aren’t that many sellers who have to bring down their price,” said Yu. “For most sellers, they don’t have to sell … It puts a cushion under the market.”

The report also examined B.C.’s rental housing market.

It said “renters will continue to experience stressful conditions,” with the province’s low rental vacancy rate of 1.4 per cent expected to hold steady through 2021 as renters struggle rents and continuing strong demand.

“Options are very limited,” said Yu. “There’s not a lot of supply out there.”

chchan@postmedia.com

twitter.com/cherychan

to shift into home ownership given tighter mortgage qualification require

canada housing market outlook.jpg

canada housing market outlook 2.jpg

canada housing market outlook 3.jpg

canada housing market outlook 4.jpg

United States Housing News

US Housing Starts Up, Permits Down: August 2018

September 26, 2018 Kéta Kosman

US Housing starts.jpg

U.S. housing starts rose 9.2% in August, driven by an outsize leap in apartment building that masked weakening across single- and multifamily construction.

Single-family housing starts in August rose 1.9% to a seasonally adjusted annual rate of 876,000 units, and multifamily starts soared 27.3% to an adjusted annual rate of 392,000 units, according to the U.S. Department of Commerce’s monthly estimates.

SOURCE: U.S. Department of Commerce via For Construction Pros

U.S. housing starts rose 9.2% in August, driven by an outsize leap in multifamily building that masked softening housing construction conditions.

Monthly housing starts numbers are notoriously volatile, said For Construction Pros September 20. From the first of 2018, multifamily starts had trended down slightly through July. Multifamily starts year to date as of August, however, were 8.5% higher than the first eight months of 2017. The much larger category of single-family starts has been a bit more consistent, and the year-to-date total remains 6.9% above the same period last year.

The number of building permits issued tends to be a more stable measure and can help predict future home construction volume. Total permits dropped 5.7% from July to August, with single-family permits down 6.1% and multifamily permits down 4.9% for the month. The year-to-date totals show single-family permits more-consistently 6.5% above the first eight months of 2017, and multifamily permits 1.8% above last year.

Weekly Softwood Lumber Blog

ADN.TO, building, canada export, CFF.TO, construction, export development Canada, HomeBuilding, IFP.TO, lumber trade, madisons lumber reporter, NYSE: DHI, NYSE: HOV, NYSE: KBH, NYSE: LEN, NYSE: PHM, NYSE: RFP, NYSE: TOL, NYSE: WY, OSB.TO, RealEstate, sawmill, SJ.TO, softwood lumber, Softwood Lumber Prices, trade, trade deal, trade forecast, TSE: IFP, TSE: WEF, TSE: WFT, TSE:ADN, TSE:CFF, TSE:OSB, TSE:SJ, US home building, us home construction, US home sales, us house inventory, US house prices, us housing, US housing starts, UShousing, WEF.TO, WFT.TO

Housing Fundamentals Still Supportive For Lumber & Panel Markets- Madison

Preferred Solid Wood Names Remain TSX:IFP and NYSE:LPX

The U.S. housing market has turned in several months of lackluster performance, from slower-than-expected housing starts to weaker existing-home sales to a drop in pending home sales. It’s not exactly clear what is driving the disappointing results, or if they will last beyond the current spell (housing permits remain positive!), but they are of concern for investors in lumber- and OSB-leveraged stocks.

In this report, we review various scenarios for housing and repair and remodeling activity, combined with capacity additions for both lumber and OSB. Our analysis indicates that supply and demand for both lumber and OSB should remain reasonably tight through 2020, even if growth in both new construction and repair & remodeling market activity slows. There will continue to be volatility driven by seasonal factors, transportation, capacity ramp-ups, etc., but over the forecast period we see persistently solid fundamentals.

We caution, however, that headline risk in these names is elevated, as the industry reference forecasters continue to have high annual housing-start forecasts (table below): these numbers will have to come down based on recent housing-market performance and given that home builders are short labour and cannot make up for lost time. Similarly, consensus estimates for OSB names (Norbord in particular) look stretched to us, and we expect they will come in over time. Despite these risks, we anticipate continued strong cash flow generation from the solid wood names. The names have shown good discipline in M&A and balance sheets are in excellent shape. Large capital programs are either winding down or fully funded, and dividends have begun to rise. While we believe near-term peaks in commodity pricing are in (and past!) we see good fundamentals in solid wood for long-term investors. Our preferred route to lumber exposure remains IFP, given the larger relative impact from its capital program and its geographic diversification. In OSB, we favor LPX, with growing diversification into siding in new homes and the R&R market.

as good as it gets

The latest data is not encouraging: The housing recovery has slowed from its prior modest pace, with potential for further slowing

Through the first half of 2018, single-family starts were up 8% y/y (not seasonally adjusted), in-line with market expectations. Multi-family starts have been more volatile, up 9% y/y in Q1, up 4% y/y in Q2 (up 7% through the first six months).

Through June and July, however, housing starts have disappointed, with June’s 1.158 (SAAR) falling 5% y/y. The decline was broad-based, with singles down 1% y/y and multis down 17%. In the South, home to about half of all U.S. housing activity, singles were flat y/y. It is worth noting that there were no big adverse weather events or major holidays to blame for the weaker-than-expected June stats.

The refrain we often heard following the June stats was “one month does not make a trend”. Fair enough. But July stats underwhelmed as well, coming in at 1.168MM (million) on a SAAR (Seasonally Adjusted Annual Rate) basis.  Singles were up just 3% y/y and multis were down another 12%. The timing of the July 4th holiday did deserve some of the blame for the weaker-than-hoped for result, but clearly there was no catch-up on whatever was holding back June numbers. The one silver lining has been strong permit numbers over the last few months. July permits totaled 1,311MM, up 15% from June, and 4% higher than July 2017. Year-to-date, permits are up 6%.

house prices.jpg

As we head into the end of the year, there are several plausible paths forward for the U.S. housing market, and strong arguments for each. We summarize the alternatives below, with our housing-start forecast under each scenario and the attendant wood products demand summarized in the table above.

  • Low: The U.S. housing recovery has hit an inflection point, and will see slower growth in starts — including single family starts — going forward. This scenario models demand if total housing start improvement fell to 4% and 2% growth in 2019 and 2020. The silver lining in this scenario is that housing could continue to grow at the new, slower pace even if the current torrid pace of U.S. GDP slows or falters, as home builders continue to meter out supply to a chronically under supplied market.
  • Base case: June and July were just hiccups…just predictable bumps in the traditionally volatile housing market. Growth in single-family starts returns to its prior 5%–6% y/y growth rate.
  • High: The pace of growth in the housing market accelerates through the remainder of the year on pent-up demand. Growth remains above trend at 6%–7% though 2020, taking total housing starts to 1.45MM.

Given we are already seven months into 2018, this year’s wood product demand numbers look very similar in all scenarios. The differences between absolute demand levels are really only meaningful in 2020 (e.g., a 2 Bbf (Billion board feet) difference in lumber demand in High scenario vs. Low). That said, if we see housing activity slow to the pace in the “Low” scenario, the impact on equities (and not just solid wood producers) would be much more significant and immediate.

 Primary forecasters’ views are lagging the market; we expect downward revisions

Housing starts are the most watched, and variable, component of the various end uses for wood products. To start this year, consensus estimates for 2018 total housing starts were 1.27MM (table). Surprisingly, forecasts have actually nudged higher since the initial forecasts, with the current figures now just above 1.3MM starts. This comes in spite of lower-than-expected housing start numbers through the summer months. While home builder stocks have under performed and worries have begun to spread to other housing-related names, we have yet to see consensus housing forecasts come down. Likely downward revisions represent headline risks for solid wood stocks.

Factors that will determine the path forward for the housing market

 Housing Supply: The supply of new housing is constrained…or is it?

housing slump.jpg

The inventory of new homes for sale is often characterized as being low, but in fact inventories of both new and existing homes have returned to pre-housing crisis ranges (chart). After bottoming at less than 150k (1000) units in 2012, the inventory of new homes for sale has taken six years to return to more normal levels. Inventory of existing homes for sale has also fallen to about the same level as the glut of homes available after the crash has been absorbed. In terms of months’ supply (i.e., the supply measured against the pace of sales), new homes are actually running a little higher than pre-GFC (Global Financial Crisis) levels at ~5.5 months. Months of inventory is a more volatile, backward-looking metric, and we do not weight it heavily in our analysis.

Perhaps the better metric is the supply of lower-priced homes: it is clear that the supply of these homes has lagged the recovery of the more expensive categories. Sales of entry-level homes priced below ~$200k (and particularly below $150k) have seen more declines than increases since the recovery began in 2012.

FRED wage gap.jpg

americans paycheque.jpg

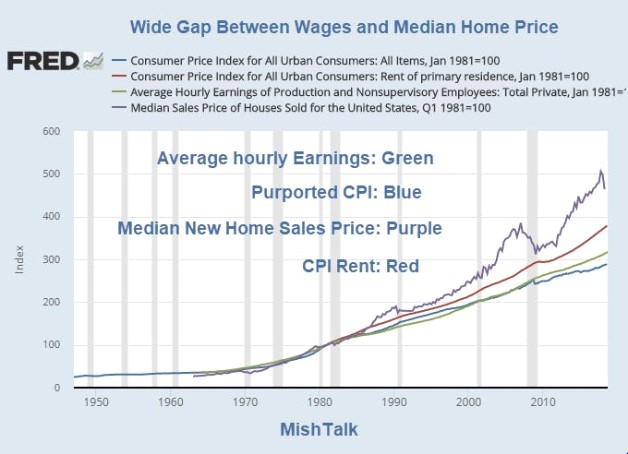
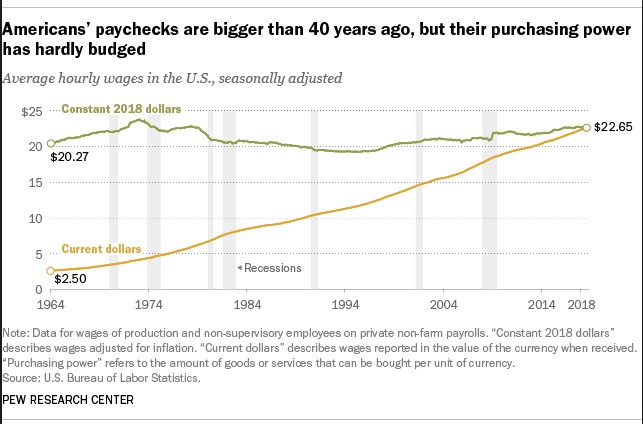
The average cost of a home has also been rising more quickly than average wages (charts, below). In addition, rents have been rising nationally, making it more difficult for prospective buyers to save for a down payment. Coupled with higher levels of student debt relative to prior cohorts, this puts the Millennial generation into a tight spot when looking at buying a first home.

size of single family homes.jpg

On the home supply side, home builders are only building homes if they can make their 20% gross margin, which is more difficult to achieve on smaller, cheaper starter homes. Gross margins for the biggest home builders including DR Horton, Lennar, DR Horton and Toll Brothers have been remarkably flat right around 20% for the past five years (chart, left). Burned by the fires of the GFC, they now have an iron grip on costs, and no longer build ahead of demand. They have commented that they have not seen adverse impacts from cost escalation in “sticks and bricks” input costs, which likely reflects both their purchasing advantage given their size and their determination to pass costs on to buyers. Similarly, although lumber costs increased significantly in the past twelve months, they still represent just a fraction of overall building costs. A 50% increase in lumber prices, from $350 to $525, would have added roughly $2,625 to the cost of building a median single family home (requiring 15mfbm (Thousand Foot Board Measure) of lumber).

Rising lumber costs have not had an impact on builders’ margins (perhaps with the exception of entry level homes).

Home builders are also facing less competition in pricing from their peers, in part because they have fewer peers than they did in the last housing cycle peak. According to Census Bureau surveys, the total count of home builder businesses fell from just over 98,000 in 2007 to about 49,000 by 2012 (the 2017 survey numbers are not yet available). Industry concentration is greater in primary metro markets, while smaller builders operate in smaller regional markets.

Home builders have consistently indicated that their ability to supply homes (profitably) is constrained by labor and lot scarcity. Unfilled construction job openings hit at a peak of 263,000 in June according to the Bureau of Labor Statistics. This problem has been increasing for some time, and has been exacerbated by the crackdown on undocumented workers in the U.S. (no builder admits to using undocumented workers, but all suggest their competition does). The shortage of skilled builders is not easy to solve, and it will remain a restraint on housing supply for the foreseeable future.


Tight labor markets have also renewed interest in modular and off-site construction (chart). Roof, wall and floor truss manufacturing has expanded over the past few years even if full modular construction remains a tiny sliver of the total market. Increased use of trusses has alleviated some pressure on labor, but will not be sufficient to increase the total supply of housing units. We expect ventures like LPX’s $45MM investment in Entekra will help drive full modular home construction to ~20k units per year, concentrated in dense, costly U.S. metro markets like San Francisco, but will have limited application outside of these areas.


As for lots, big builders have slowly been improving their lot position, but primarily through options on land (large land positions were sold down through the GFC and builders have focused on options this time around). The improvement in access to lots is welcome, but we believe it is unlikely to spur a noticeable pick-up in home building over our forecast horizon.

Housing Demand: The need for housing is there, but the resources may not be, and desire could be flagging

 Millennials (born between 1981 and 1996) have been much maligned for not doing their part for rampant consumption, preferring sharing over owning, and apparently preferring to work gigs rather than full-time permanent jobs. But whatever they lack in individual commitment and current resources, they make up in sheer numbers: at 83MM, they are the largest demographic cohort in the US. They are also entering prime home buying years. Even if home ownership rates are lower for this cohort than for prior age groups, we will see increased numbers of potential buyers over the next five years.

Through the GFC, the home ownership rate fell and the “Renter Nation” became a thing. Home ownership rates have been improving since their trough in early 2016, but remain far below pre-recession levels. Vacancy rates have fallen, too, and sit far below pre-recession levels. Tightness in the rental market has allowed rents to rise, which in turn has limited renters’ ability to save for a down payment. In addition, debt burdens — including student debt — have been higher for the current generation of potential homebuyers than for previous generations. An offset to this has been an increase in high loan-to-value lending, which reduces down payment requirements.


Affordability measures remain good relative to long-term trends, but as we all know, interest rates have been heading up, with another two Federal Reserve hikes expected through the balance of 2018, bringing the Fed rate to between 2.25% and 2.50%. Rising interest rates, however, generally only have a fleeting short-term negative impact on home buying. In fact, if accompanied by economic expansion, they are historically correlated with strengthening housing markets. With GDP growth running at 3%–4% in 2018, the rate hikes alone should not be a lasting drag on housing activity.

What does appear to be a drag, however, are home prices. The University of Michigan Consumer Sentiment survey indicates consumers believe it is a “bad time to buy” a home based on current “high” prices. It is interesting to note that consumers do not cite rising interest rates as a disincentive to purchasing a home (although low rates are no longer an incentive to buy a home), and have an overwhelmingly positive economic outlook. It just seems to be sticker shock, which is understandable given that the U.S. Census Bureau data indicates new home prices are twice what they were back in 2000, while real median household income has finally recovered…back up to the same level it was in 2000.

 If housing starts do slow or stall out, where does that leave solid wood demand?

Continued steady growth in repair and remodel activity would bolster lumber markets, but the impact on OSB would be less significant. The outlook for R&R remains positive, despite uncertainty in the housing recovery. Harvard’s Leading Indicator of Remodeling Activity (LIRA) is used to project the rate of change in U.S. spending on home improvement and repair spending (R&R) for owner occupied homes.

Spending on R&R has been steadily increasing since Q1/10, climbing from an annualized $223B at that time, to $324B in Q2/18. According to the latest projections from Harvard, recent trends in homeowner spending on R&R will continue. The rate of growth may taper slightly in early 2019, but at 6.9% in Q1 and 7% in Q2, will remain at healthy levels. Annual spending on residential home improvements is expected to cross the $350B mark before the end of 2019, in part reflecting the increasing average age of US housing stock. The prognosis could be even better, but low transactions of existing homes for sale are currently hindering greater gains in remodeling activity, as significant R&R projects often occur around the time of a sale (particularly afterwards). With a slate of capacity expansion projects scheduled (or underway) for both lumber and OSB supply, growth in demand from R&R will play an increasingly significant role.

 Solid wood demand: Lumber demand is more is more dependent on Repair & Remodeling activity, while commodity OSB is more leveraged to the U.S. single family housing market


Total U.S. lumber demand has grown steadily since the housing crash crushed consumption. Operating rates are finally returning to levels that can produce price spikes like the epic price run we saw earlier in 2018, which in turn pushed lumber producer EBITDA margins above 20%. Total U.S. demand was 47.6Bbf in 2017, up 1% or 0.6Bbf from the prior year. Since the depths of the housing collapse in 2009, U.S. lumber demand has grown at a CAGR of 5% or about 2.0Bbf per year, although this growth has been far from steady.

The single-largest end market for lumber in the U.S. remains the repair & remodeling market. This end market has been larger than the residential construction market since 2007, and represented 37% of lumber end demand in 2017, while new residential construction represented 32% of end demand (chart below). Given the aging U.S. housing stock and the lower supply of new homes, we expect growth in R&R activity to continue at 6%–7% annually for the next couple of years.

Growth of demand from new residential construction, however, has outpaced R&R since the trough, with a compound annual growth rate (CAGR) of 10% since 2007 against 5% for R&R. Materials handling and non-residential construction end demand have represented 10%–15% of lumber end demand over the past decade, with “Other” markets representing a fairly steady 6%–8%. Demand in non-residential and material markets was flat to marginally down in 2017.

For OSB, the picture is somewhat different. In 2017, total U.S. demand for OSB was 20.3Bsf (Billion Square Feet), up 5% or almost 1.0Bsf from 2016. Demand bottomed in 2010 at 12.8Bsf, and has grown at a CAGR of 7% or about 1.0Bsf annually since then. Unlike lumber, the largest end market for OSB is, by far, residential construction at 55% of 2017 total demand. Repair & remodel demand was less than half of this at 21%, followed by the smaller industrial (15%) and non-residential construction (9%) markets .

Demand growth has been greatest in residential construction, with the same 10% CAGR since 2009 as lumber. Growth in R&R demand has been lower at 4% since 2009.

House size and the multi-family/single-family split are important for wood products usage

While the total volume of solid wood products going into new residential construction has increased over the past 10 years, the intensity of solid wood use per square foot of new floor space has been quite consistent. We have kept our estimates of usage unchanged over our forecast horizon.

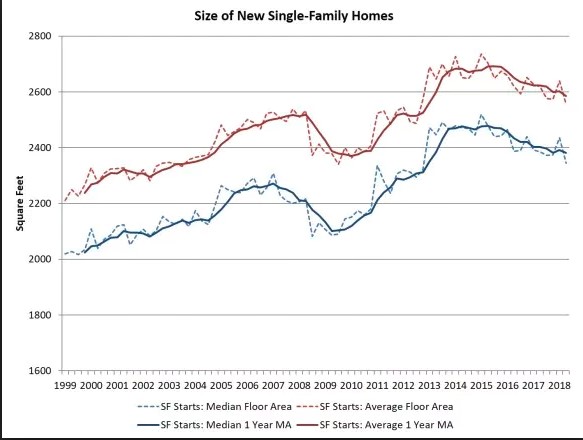
Measures of home size as well as the proportion of single-family versus multi-family starts are therefore the key variables in determining total solid-wood consumption in new residential construction. Housing square footage has ebbed and flowed over time, with median single-family unit size falling to a low of 2,100 sqft in 2009 before returning to 2,435 sqft in Q1/18. At our reference lumber intensity of 6.2 bf per square foot, the 16% increase in median size since 2009 corresponds to 2m bf implied incremental wood demand per unit. The increase in median unit size has amplified the effect of the 91% increase in single-family starts between 445k in 2009 and 849k in 2017 (adding roughly 1.7Bbf of demand).

The gains in single-family unit size are not uniformly good news, however. The housing recovery has been most robust in the upper end of the housing market price categories, while the smaller, cheaper, entry-level gains have lagged. Potential new home buyers are more likely to be shut out of home ownership (or have to postpone purchases) if affordable housing stock is not more readily available. We note median single-family square footage has been trending down — albeit unevenly — since peaking at 2,490 sqft in Q3/15, suggesting that smaller, more affordable homes are finally gaining market share.

Multi-family units are about half the size of single-family units. Multi-family units have occasionally hit 1,200 sqft, but have mostly bounced around 1,100 sqft. There has been some concern that Millennials (and other demographic cohorts) would forgo the traditional shift to a single-family unit in the suburbs and instead chose to remain in urban multi-family units as they form households. We would have expected to see an increase in the median size in multi-family units if this were the case, but we see no evidence of it in the stats (charts below).

Solid wood supply: lumber additions will be smaller, slower and have some offsets, while more net OSB supply is coming

 Upcoming lumber projects will add 5Bbf lumber capacity (or about a 20% increase) in the U.S. South, but bottlenecks with contractors and equipment vendors, declining output from Western Canada, and continued growth in R&R demand means that new supply should be gradually added and easily absorbed.

We expect to see upward of 5Bbf of new lumber capacity in the U.S. South over the next three years — 1.1Bbf in 2018, a further 2.3Bbf in 2019, and 1.9Bbf in 2020 (which would represent 1.8%, 3.7% and 3.0% of total 2017 North American output, respectively). Nine proposed greenfield projects will account for just over 2.1Bbf of the incremental capacity, while the balance will be made up by a host of rebuilds and upgrades.

Taking our most conservative or “Low” scenario from the “Potential paths of U.S. housing” and comparing it to the total U.S. lumber demand from residential construction in 2017, lumber demand from residential housing and R&R would grow by roughly 4.5Bbf through 2020. With our “Base” housing outlook, 6.8Bbf of new demand would be created, and finally, under our “High” scenario for housing, an incremental 8.3Bbf of lumber demand would be created.

On the supply side, our “Low” scenario entails ~125% of announced new capacity making it to market (i.e., all recently announced projects, plus a few extra, are successfully completed), adding 7.8Bbf of new supply. Our “Base” case involves all of the projects announced to-date being completed by 2020, and would add 6.3Bbf of new capacity. Finally, the “High” case would see roughly 75% of announced capacity make it to market by 2020, adding 5Bbf of new supply.

Though there could be some short term loosening of markets or regional pricing weakness depending on the timing and location of capacity additions, as the table above shows, in all but the “low” scenario, new supply is absorbed by incremental demand, keeping lumber markets strong through at least 2020.

Tightly bunched OSB capacity additions are expected to overwhelm markets if the housing recovery doesn’t deliver

There are currently five new mills, representing ~2.7Bsf of capacity (almost 12% of North American production in 2017), in the process of ramping up. We expect to see between one and three further restarts in the next three years. A restart at Norbord’s 550MMsf Chambord, QC mill is more likely than not (we expect to see activity begin in earnest in H1/19 and meaningful production by H1/20), and start-ups at Louisiana Pacific’s Val D’Or, QC and Cook, MN mills could come the year after.

Our range of estimates for housing shows OSB demand from residential construction and R&R increasing by between 2.4Bsf and 3.9Bsf through 2020, with between 1.9Bsf and 3.2Bsf of additional supply set to ramp up over that time frame. Unlike lumber, supplemental demand from R&R growth won’t add massively to demand.

In our low scenario, new supply exceeds forecast demand growth, but not by much. We would expect incremental pressure on OSB prices, but no collapse. Our current benchmark NC OSB price forecast is $310 for 2019 and $307 for 2020, down from highs of $353 in 2017 and a forecast $379 average in 2018.

Investment recommendation: Opportunity for volatility will no doubt continue, but supply and demand look balanced

US Home builder workers.jpg

US HOUSE PRICES, CONSTRUCTION JOBS: SEPT 2018

November 16, 2018  Kéta Kosman

CoreLogic® Thursday released the CoreLogic Home Price Index (HPI™) and HPI Forecast™ for September 2018, which shows US home prices rose both year over year and month over month. Home prices increased nationally by 5.6 percent year over year from September 2017. On a month-over-month basis, prices increased by 0.4 per cent in September 2018. (August 2018 data was revised. Revisions with public records data are standard, and to ensure accuracy, CoreLogic incorporates the newly released public data to provide updated results each month.)

Looking ahead, the CoreLogic HPI Forecast indicates home prices will increase by 4.7 per cent on a year-over-year basis from September 2018 to September 2019. On a month-over-month basis, home prices are expected to decrease by 0.6 per cent from September to October 2018. The CoreLogic HPI Forecast is a projection of home prices calculated using the CoreLogic HPI and other economic variables. Values are derived from state-level forecasts by weighting indices according to the number of owner-occupied households for each state.

The CoreLogic Year-over-Year increase has been in the 5 per cent to 7 per cent range for the last few years.  This is still near the middle of that range.  The year-over-year comparison has been positive for over six consecutive years since turning positive year-over-year in February 2012

Read more at https://www.calculatedriskblog.com/2018/11/corelogic-house-prices-up-56-year-over.html#GQZXfhfSFA7JMAwU.99

corelogic.jpg

SOURCE: Upfina.com

Elsewhere, according to the US Bureau of Labor Statistics Job Openings and Labor Turnover Survey (JOLTS) and National Association of Home Builders analysis, released November 6, the count of unfilled jobs in the US construction sector pulled back in September, off a upwardly revised August estimate that marked a post-recession high.

the number of open construction sector jobs decreased to 278,000 in September. The August estimate of open construction jobs was revised up to 317,000, the largest count since the Great Recession.

The open position rate (job openings as a percentage of total employment plus current job openings) fell back to 3.7 per cent in September. The rate was 2.5 per cent last September. On a smoothed, twelve-month moving average basis, the open position rate for the construction sector increased slightly to 3.3 per cent, a post-recession high. The peak (smoothed) rate during the building boom prior to the recession was just below 2.7 per cent. For the current cycle, the sector has been above that rate since November 2016.

construction labor trends.jpg

SOURCE: NAHB Eye on Housing

US HOME PRICE APPRECIATION AND PRICE-TO-RENT RATIO: AUGUST 2018

October 31, 2018  Kéta Kosman

Nationally, home price appreciation continued in August. Based on a seasonally adjusted annual growth rate, home prices in Seattle, New York and San Diego declined faster in August than in July. Home prices in New York has decreased for the fifth consecutive month.

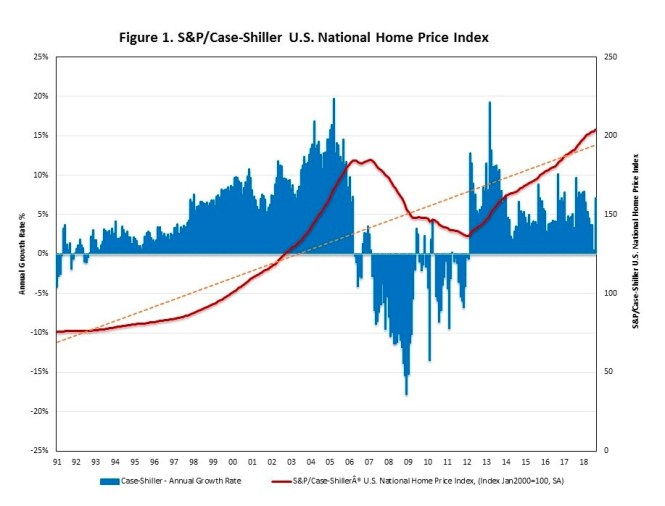
The S&P CoreLogic Case-Shiller U.S. National Home Price Index, reported by S&P Dow Jones Indices, rose at a seasonally adjusted annual growth rate of 7.2% in August, following an unusual 0.5% annual rate in July. On a year-over-year basis, the S&P Case-Shiller U.S. National Home Price NSA Index rose by 5.8%, the lowest annual gain in the past twelve months. The Home Price Index, released by the Federal Housing Finance Agency (FHFA), rose at a seasonally adjusted annual rate of 3.1% in August, slower than the 4.4% increase in July.

S&P_case_schiller.jpg

Elsewhere, in October 2004, Fed economist John Krainer and researcher Chishen Wei wrote a Fed letter on price to rent ratios: House Prices and Fundamental Value. Krainer and Wei presented a price-to-rent ratio using the OFHEO house price index and the Owners’ Equivalent Rent (OER) from the BLS, said Bill McBride on Calculated Risk Wednesday.

Here is a similar graph using the Case-Shiller National and Composite 20 House Price Indexes.

This graph shows the price to rent ratio (January 2000 = 1.0).

On a price-to-rent basis, the Case-Shiller National index is back to February 2004 levels, and the Composite 20 index is back to November 2003 levels.

In real terms, prices are back to mid 2004 levels, and the price-to-rent ratio is back to late 2003, early 2004.
Read more at https://www.calculatedriskblog.com/2018/10/real-house-prices-and-price-to-rent.html#p8ux2OwKepTE2vRy.99

Home Prices in 20 U.S. Cities Rise Least in Almost Two Years

US neighbourhood.jpg

By

Sho Chandra

November 27, 2018, 7:00 AM MST Updated on November 27, 2018, 7:39 AM MST

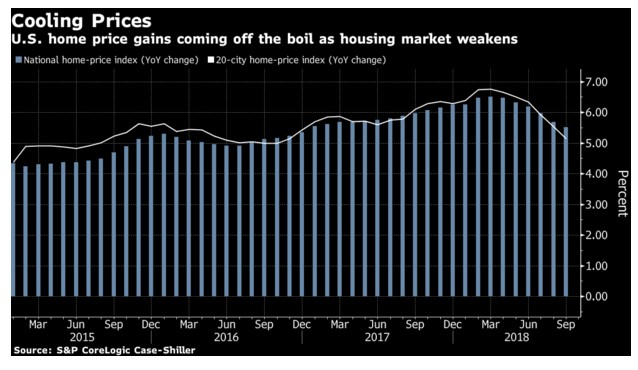
Home-price gains in 20 U.S. cities grew in September at the slowest pace in almost two years, adding to signs that buyer interest is waning amid higher mortgage rates and elevated property values.

The 20-city index of property values increased 5.1 percent from a year earlier, the least since November 2016, after rising 5.5 percent in the prior month, according to S&P CoreLogic Case-Shiller data released Tuesday. The median estimate in a Bloomberg survey of economists called for a gain of 5.2 percent. Nationally, home prices were up 5.5 percent from September 2017.

coolin prices

Key Insights

  • The report marks the sixth straight deceleration in price gains. It’s the latest in a spate of reports indicating housing is in a broad slowdown, with sales and home-building also showing signs of weakness.
  • While the 0.3 percent monthly increase in the seasonally adjusted 20-city index was slightly above projections for 0.2 percent, economists look at the year-over-year gauge for a better indication of trends.
  • The results also indicate more prospective buyers may be able to enter the market in coming months, though property values remain elevated, mortgage rates are near an eight-year high and the supply of affordable properties is still limited.
  • The respite on price appreciation may be especially attractive for younger buyers or those purchasing a house for the first time; on the flip side, softer price gains also mean smaller advances in equity for owners.
  • “Home prices plus data on house sales and construction confirm the slowdown in housing,” David Blitzer, chairman of the S&P index committee, said in a statement.

Get More

  • All 20 cities in the index showed year-over-year gains, led by a 13.5 percent increase in Las Vegas and 9.9 percent in San Francisco.
  • Prices in Seattle fell 0.3 percent from the prior month; annual gains have slowed to 8.4 percent from double digits earlier this year. San Diego was the only other city to record a monthly drop, at 0.1 percent.
  • New York, hit by new federal limits on mortgage and property-tax deductions, had the weakest annual price gain at 2.6 percent, while Washington was second-lowest at 2.9 percent.
  • Separate figures released Tuesday by the Federal Housing Finance Agency also showed prices climbing at a slower pace. The agency’s index rose 6.3 percent in the third quarter from a year earlier, compared with a 6.8 percent in the second quarter. For September, prices rose 0.2 percent from the prior month.

— With assistance by Jordan Yadoo, and Christine Maurus

(Updates with FHFA index in last bullet point.)

US CONSTRUCTION SPENDING: SEPTEMBER 2018

November 1, 2018  Kéta Kosman

A very good indicator of current construction activity, thus future lumber prices, is US construction spending. New data out this week from the US Commerce Department shows construction spending flat in September 2018 after a 0.8 per cent rise in August, said the New York Times Thursday. Spending on US construction projects was essentially unchanged in September, the weakest showing since June, as an increase in home construction was offset by a slide in spending on government projects.

The strength last month was driven by a 0.6 per cent increase in residential construction and a smaller 0.1 per cent increase in nonresidential activity, which pushed this category to an all-time high. However, these gains were offset by a 0.9 per cent drop in spending on government projects.

The increase in residential construction featured an 8.7 per cent jump in apartment construction, which offset a 0.8 per cent drop in single-family homes.

private res construction spending index

SOURCE: NAHB Eye on Housing

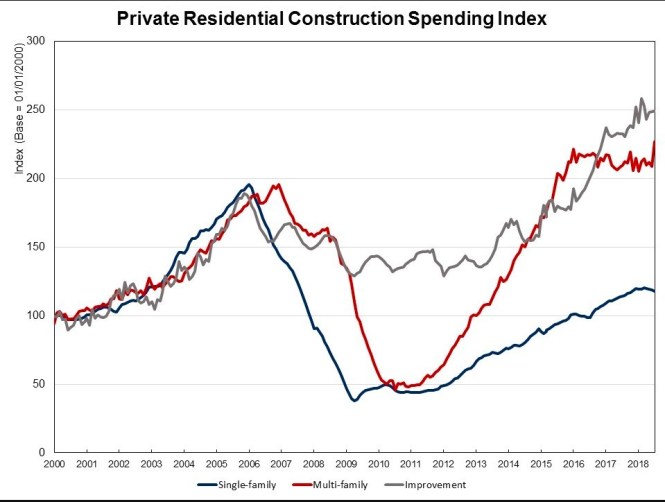
Drilling down to more detail, the National Association of Home Builders said it’s analysis of Census Construction Spending data shows that total private residential construction spending inched up 0.6 percent in September, after a dip of 0.4 percent in August. On a quarterly basis, private residential construction spending climbed 0.9 percent in the third quarter. Private residential construction spending increased in September, despite the decline of the total housing starts amidst the shortage of construction labor and land, rising mortgage rates, and ongoing building material price volatility.

The monthly gains are largely attributed to the strong growth of spending on multifamily.

Why Have Lumber Prices Fallen?

Posted by Pete Stewart on December 10, 2018


The US housing sector—a bellwether for economic health—has showed signs of stagnation (and even the prospect of reaching peak housing in this market cycle) in recent months. As I wrote last month, forecasts for housing starts are simply overblown, as there isn’t much room for an increase beyond the 2018 level of 1.266 million units.

As a commodity largely tied to housing starts and broader building and construction activity, lumber prices also reflect the general health of this market via supply and demand metrics. After steady increases beginning in 4Q2017, lumber prices skyrocketed to new record highs in 2Q2018 before dropping precipitously across the board over the last four months. Southern yellow pine (SYP) lumber prices recently hit their lowest point since August 2017; Forest2Market’s SYP composite index price for mid-November was $376/MBF—a 35% drop from the record high of $576/MBF achieved in May.

Despite the one–two hurricane punch that recently impacted the US South and the continued wildfires in the Pacific Northwest (PNW)—extreme weather events that have significantly impacted forest inventories, harvests and supply—the drop in lumber prices over the last six months is largely, though not entirely, demand driven. Fewer new-home builds = less lumber.

The sudden reversal begs a serious question: Did the lumber market simply over drive its headlights in the price run-up earlier this year, or are there more structural forces at work? Several dynamics are combining to impact housing starts and, by extension, the North American lumber market.

Supply Analysis

Housing starts kicked off 2018 with a bang, leading many to believe that there would be a gap in supply once the busy part of the building season hit. January starts were up 9.7 percent over December 2017 to a seasonally adjusted annual rate (SAAR) of 1.326 million units, and speculation began to drive lumber prices ever higher.

US new housin starts.jpg

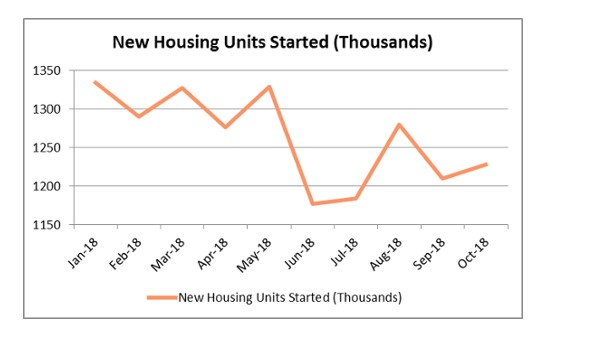
But as the meat of the building season came and went and housing starts failed to live up to expectations (now on pace at a SAAR of 1.228 million units), lumber production numbers confirm that any supply concerns were exaggerated. Both US softwood lumber production and total softwood imports have increased year-over-year (YoY). Through August 2018, US production was 23.8 Bbf (+4.8%) and total imports were 10.3 Bbf (+1.3%). Despite the tariffs on Canadian product, imports from Canada were only off 1.4% YoY to 9.3 Bbf through August. Latin America (primarily Brazil) and European producers more than made up for the difference in Canadian volume; LatAm shipments to the US totaled 306 Mbf (+8.3%) while European shipments totaled 589 Mbf (+65%) through August.

We may see this trend reverse course when full 3Q and 4Q trade statistics are reported; however, those numbers will be immaterial to this analysis. The data show that domestic and import supply was ample through the price run-up that began in 1Q2018 and peaked in 2Q. Neither US production nor imports through August suggest any supply-side disruptions that would account for such a dramatic surge in price. 

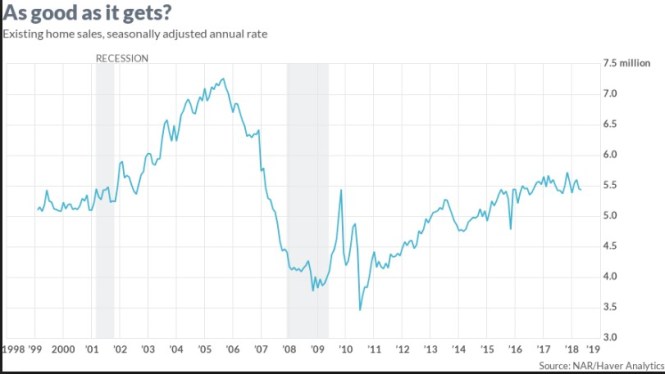
 Decreasing Demand for Homes 

“Housing is no longer a tail wind for the economy, but [so far] the headwinds are blowing very gently,” wrote Michelle Meyer, a Bank of America Merrill Lynch economist, in October. One sign of a shifting housing market is slowing demand—including buyer traffic—for existing homes. Resales earlier this fall suffered the largest drop in 2½ years to the slowest pace since November 2015. Though still high, resale price appreciation has been decelerating (below +6% YoY for the first time in 12 months) and the supply of existing homes, while still low, is gradually expanding; there were 4.4 months of supply in September, up from the year-earlier 4.2 months.

Based on the behavior of the exchange-traded fund iShares US Home Construction (ITB), which tracks a basket of 47 US home builders and construction-related companies, investors apparently agree with Meyer’s sentiment. As of mid-November, ITB’s share price had fallen over 34% from its mid-January peak. Builders are in a tough spot, as they have been hit with a number of challenges this year including an increase in materials costs, land and labor shortages and a shrinking appetite of prospective buyers who are willing pay up.

Real private residential investment (PRI) declined for a third quarter in 2Q2018; as a percentage of total GDP, the decline has been in place since 1Q2017. Although both metrics have receded only modestly from their corresponding recent peaks, they nonetheless paint a potentially disconcerting picture for the sustainability of this market cycle.

 Increasing Inventory of Homes 

Interestingly, especially since there is a consensus that more new-home supply is needed, rising inventory is even more pronounced in newly-built homes. After meandering around an average of 5.3 months between July 2013 and December 2017, new-home inventory has trended higher in 2018 (to September’s 7.1 months of supply). In addition, the ratio between starts and new-home sales reached 1.5 in September, which is in the top 14% of monthly ratios since January 1995. The implication is that unless the pace of new-home sales picks up, starts will ultimately be forced lower.

With long-term Treasury yields helping to push mortgage rates upward, the median new-home prices less than 7% off November 2017’s record high, and resale appreciation only gradually slowing, it is entirely possible that housing demand could weaken further in coming months. Despite sustained high home prices (and surging prices in some markets) some regions are now drifting into the “buyer’s market” column.

 Interest Rates

With home appreciation and mortgage rates trending higher, the reality is that many potential borrowers simply can’t make the mortgage numbers work. One way to measure the impact of inflation, mortgage rates and home prices on affordability over time is to use CoreLogic’s “typical mortgage payment,” which is a mortgage-rate-adjusted monthly payment based on each month’s US median home sale price. The number is calculated using Freddie Mac’s average 30-year fixed-rate mortgage rate with a 20% down payment, and it doesn’t include taxes or insurance. As such, the typical mortgage payment is a good measure of affordability because it shows the monthly amount that a borrower needs to purchase a median-priced US home.

The US median home sale price in August 2018 ($226,155) was up 5.7% YoY, while the typical mortgage payment was up 14.5% YoY due to a nearly 0.7-percentage-point rise in mortgage rates over that period. Tight housing inventories coupled with rising home costs are a real barrier for potential homebuyers, but a typical mortgage payment that is rising at over twice that pace is a much more serious concern, and a number of forecasts call for even higher rates next year.

Moody’s Investors Service has observed the deteriorating quality in mortgage loans noting that “The broad conditions under which loans are being granted have grown less favorable for future mortgage performance. For instance, home prices are no longer very affordable and rising interest rates are reducing refinancing incentives and prepayments.” Hence, “mortgages being originated today appear more likely to face a stressed environment within only a few years, [compared to] loans originated earlier during this long period of economic growth.”

And that’s just mortgage rates, which function independently of the federal funds rate instituted by the Federal Reserve (Fed). Though speculative at this point, the Fed is expected to raise interest rates once more this year and, potentially, three to four times next year, which will impact short-term and variable (adjustable) interest rates. Strategists warn that if the Fed tightens too much, economic growth could slump and trade wars could intensify, destroy demand and negatively impact earnings.

The potential scenarios in the wake of these rate hikes are many. However, the impacts of continued increases would most certainly discourage any expansion in new home ownership that would drive an increase in housing starts and additional demand for lumber. 

 Home Size

Not only have housing starts been decelerating since 2013, but home size has also been shrinking. Median floor area of new single-family completions peaked at 2,647 square feet (SF) in 2015 and has subsequently been declining on trend (to 2,426 SF in 2017). The median new home cost a record $133/SF in 2017, +30% relative to 2010. Apartments, by contrast, have been gradually expanding (2017 median: 1,096 SF) from 2013’s 1,059 SF. If these trends continue, net changes in demand for lumber and other building materials could well be negative. While the trend of slightly-shrinking single-family home sizes may seem minimal, the cumulative impact of fewer builds using less lumber is resulting in diminished demand.

Analysis of Economic Health: Forecasting Gross Domestic Product

Posted by Forest2Market on November 26, 2018

  • inShare

Every month, Forest2Market publishes updated forecasting products designed specifically for participants in the forest value chain. The Economic Outlook is a macroeconomic indicator forecast that supplies critical information, context and insight about general economic trends and direction, and the 4Cast supports regional operational decision making for those who buy and sell timber. With an understanding of economic indicators, future stumpage prices and insight into buying and selling windows (periods in which buyers or sellers hold relative market advantage), subscribers are better able to time sales or purchases, negotiate prices, manage workloads and control inventory levels. The following commentary is just a sampling from the most recent Economic Outlook for November, 2018.

The robust economic momentum we’ve seen over the last several months may be slowing against the backdrop of a strong dollar and cooling global growth, which is restraining exports. There are few signs so far that US-China trade tensions are disrupting factory production, but manufacturers argue future output could be hurt as tariffs disrupt supply chains. Further, more than 70% of US firms operating in China and polled by the American Chamber of Commerce in South China are considering delaying further investment there and moving some or all of their manufacturing to other countries as a way to avoid the tariffs.

Trends in GDP

In its first estimate of 3Q2018 gross domestic product (GDP), the Bureau of Economic Analysis (BEA) pegged growth of the US economy at a seasonally adjusted and annualized rate (SAAR) of +3.50% (3.3% expected), down 0.65 percentage point (PP) from 2Q2018’s +4.15%. Three groupings of GDP components—personal consumption expenditures (PCE), private domestic investment (PDI), and government consumption expenditures (GCE)—contributed to 3Q growth. Net exports (NetX) detracted from growth.

trends US GDP.jpg

On a year-over-year (YoY) basis, which should eliminate any residual seasonality distortions present in quarter-over-quarter (QoQ) comparisons, GDP in 3Q2018 was 3.04% higher than 2Q2017; that growth rate was slightly faster (+0.17PP) than 2Q2018’s +2.87% relative to 2Q2017.

Despite moderating from 2Q’s torrid pace, 3Q growth appeared quite solid—at least at the headline level; taken together, the 2&3Q GDP results also represent the strongest back-to-back quarterly growth rates since 2&3Q2014. Glancing below the headline of the latest report revealed some less appealing details, however. In contrast to relatively steady contributions from PCE (growth in goods and services spending: +0.11PP from 2Q) and GCE (+0.13PP from 2Q), commercial fixed investment was shown to be contracting at a 0.04% annualized rate (-1.14PP from 2Q); exports: -0.45% (-1.57PP from 2Q), and imports: -1.34% (-1.44PP from 2Q).

Inventories propped up 3Q’s result by contributing nearly 60% of the 3Q headline GDP number (+3.24PP from 2Q). Reflecting that influence, the BEA’s real final sales of domestic product, which excludes the effect of inventories, tumbled to +1.42% (-3.91PP from 2Q).

“The economy has reverted back to the ‘same old’ model of consumers accounting for most of the growth,” commented Bloomberg’s Carl Riccadonna, referring to the 2.7% PCE number. “Supply-siders will be disappointed to see business fixed investment essentially stalling out after a robust first half.

The implication is that the surge in growth is not the onset of the economy evolving toward a new speed limit,” concluded Riccadonna, looking forward; “rather, the frothiness in 2&3Q really does appear to be largely due to a sugar high from tax cuts. Unfortunately this is not sustainable barring tax cuts 2.0.”

“When we got the 2Q number,” concurred economic consultant Joel Naroff, “I suggested it could be the high water mark for this expansion. It is looking more and more like it will be. Household incomes are just not expanding fast enough to sustain the rapid spending paces posted in 2&3Q… [Also,] most business leaders have become somewhat cautious about the future and are holding off… major investment plans.”

“The fate of the consumer rests with the willingness and ability of businesses to keep hiring,” echoed former Federal Reserve researcher Julia Coronado. The slowdown in business spending “came earlier and was more than we expected, given where the [tax-cut] stimulus is,” Coronado said. “That suggests some of this stimulus won’t last, it’s not going to turn into higher-trend growth through the channel of investment and greater capacity and greater potential growth.”

“Don’t expect 4Q growth to be anywhere near what we have seen over the past two quarters,” Naroff concluded. “The economy is not faltering, it’s just that we are moving back toward more sustainable growth.”

The impacts on GDP of inventories and imports will bear watching as tariffs on $250 billion of Chinese products percolate through the economy. US companies appear to have “front-loaded” orders from China to beat the September 24 tariff deadline. Hence, it is possible the contributions to 4Q’s GDP headline from inventories and imports may flip relative to 3Q.


Fourth Quarter 2018 Economic and Wood Product News

supply chain disruption.jpg

October 17th 2018

Print Share

EIU global forecast – Trade war will disrupt supply chains

The Economist Intelligence Unit expects the global system to be characterized by competition between the major powers in the next five years. Of most importance to the global economy is the relationship between the world’s two largest economies, China and the US. The bilateral trade war between these countries will drag down global economic growth in 2019, as well as disrupt global supply chains. However, the trade dispute is increasingly spilling into areas of political and security concern. On October 4th the US vice-president, Mike Pence, signaled a significant hardening of US strategy towards China. The most explosive allegation from Mr. Pence’s speech was that China was meddling in US politics ahead of the mid-term elections in November. However, the speech also addressed several larger issues, including the controversy over the “Made in China 2025” initiative, the debt issues surrounding China’s Belt and Road Initiative and the campaign against Taiwan. In a clear signal of US intent, the revised North American Free-Trade Agreement, officially re-branded as the United States Mexico Canada Agreement (USMCA), contains an anti-China provision aimed at increasing the trade pressure on the country. The USMCA casts a spectre over potential future trade deals between China, Canada and Mexico by stipulating that any party would have grounds to withdraw from the deal if another party were to enter into a free-trade agreement with a non-market economy (a term used by the US to describe China).

Signs of renewed tensions over Taiwan are of concern, given the island’s key strategic significance for China. On September 25th Geng Shuang, a spokesman for China’s Ministry of Foreign Affairs, told a press briefing that China had lodged a complaint against the US regarding the approval of a US$330 million arms sale to Taiwan, announced the previous day. This followed a statement on September 7th by the US Department of State that it had recalled its ambassadors to El Salvador, Panama and the Dominican Republic following the decision by those countries to no longer formally recognise Taiwan. All three countries switched diplomatic recognition from Taiwan to China in 2018. We expect that nationalist sentiment is also likely to increase in Asia, given our view that the trade war is likely to endure until at least 2020. For China, reunification has long been designated a core national issue, and Xi Jinping, China’s president, may also view Taiwan as a legacy issue for his presidency. Moreover, if Mr Xi has concerns about China’s medium-term growth prospects, owing to issues such as an ageing population and unsustainable debt, he may be tempted to address these sooner rather than later. Consequently, risks are developing around the question of Taiwan, suggesting that the likelihood of conflict erupting at some point in the next five years is higher than it has been in decades.

The world’s other major power, Russia, is also expanding its global presence, presenting a challenge to the US’s dominance of global security. During a recent visit to India by the Russian president, Vladimir Putin, Russia signed a US$5.4  billion deal for the sale of S‑400 Russian air defense missile systems to India. The deal is in line with our view that Russia will strive to be on the same level as the US in terms of its economic and security relationships, a process that risks increasing tensions in the region. Other flash points also present a significant risk to the global economy, and, with the lack of co‑operation between the US, China and Russia, diplomatic options to resolve tensions look remote. North Korea continues to be a threat to global stability, despite the country’s current rapprochement with the US. A breakdown in talks is possible, as differences remain over the terms of denuclearization, and, with US‑China relations deteriorating, China is unlikely to give full support to the US’s engagement with North Korea. A return to heated rhetoric between the US and North Korea is possible, which would be of particular concern since the room for diplomatic maneuver is limited. In the Middle East, a conflict between Iran and Israel is a medium-term risk. The two countries are involved in a proxy conflict in Syria, but a direct confrontation would further destabilize the region. The source of this risk is Iran’s decision to consider restarting its nuclear program in the coming years, owing to the collapse of the Iran nuclear deal with the US. If the program were to be restarted, a direct attack on Iran by Israel would be a possibility.

Set against this backdrop of geopolitical shifts are the trends of declining democracy and authoritarian regimes. According to our 2017 Democracy Index, 89 out of 167 countries saw a decline in their democracy scores, and about one‑third of the world’s population lives under authoritarian rule. Following the decision by Mr. Xi to abolish presidential term limits, authoritarian rule is set to endure in China. Russia is also an authoritarian regime under Mr. Putin’s rule. Examples of authoritarian-leaning, strongman leadership also exist in Hungary, the Philippines, Turkey and Saudi Arabia. Brazil could join this group if Jair Bolsonaro wins the second-round presidential election against his opponent, Fernando Haddad. Given this picture, we expect a growing number of economic and diplomatic disputes, and although we do not expect a major power conflict to occur, businesses should be cautious of bilateral tensions escalating to a breakdown of relations between countries.

The US-China trade war will escalate and endure

The US president, Donald Trump, has moved ahead with tariff increases on a further US$200 billion-worth of Chinese imports. China responded with additional tariffs on US$60 billion-worth of US imports. The trade dispute is likely to escalate further, and we now expect the Trump administration to move ahead with tariffs on most of the remaining Chinese imports that have yet to be covered in the dispute. At the heart of the dispute between China and the US is a disagreement over intellectual property and China’s technology transfer practices, although the US trade team is divided on this issue, with Mr. Trump also focusing on the US’s trade deficit with China. Given this, discussions thus far between the two countries have failed to resolve the dispute, and a resolution looks unlikely in the short term. By 2019 this will dampen growth in both economies and act as a drag on growth in the wider global economy. We expect that, combined with softening economic growth in key emerging markets, especially those in Latin America, global growth will slow to 2.7% at market exchange rates in 2019, from 3% in 2018.

Growth in the US and China will slow more than expected in 2019

The trade war comes at a challenging time for the Chinese economy. Concerns over the strength of domestic demand have returned as momentum in both private consumption and investment has weakened. The effects of tighter monetary policy, corporate deleveraging efforts and a crackdown on shadow financing have become more apparent in the economy this year, having raised the cost and availability of capital for both firms and consumers. The trade war will lessen the focus on deleveraging, with authorities needing to take measures to support growth in the short term. We are likely to see a moderate easing in fiscal policy, such as cuts to taxes and fees, together with an easing of reserve requirements from the People’s Bank of China (the central bank). There is recognition from policymakers, however, that capacity to support the economy will be limited by China’s debt profile. On the back of these assumptions, in July we revised down China’s growth forecast for 2019 to 6.2%, from 6.4%. Although we expect growth to be maintained to reach the government’s target of doubling real GDP this decade, the trade war has again raised the spectre of China’s financial vulnerabilities, which will cloud the economy’s outlook for the foreseeable future.

The trade war will also affect the US economy, which has so far had a stellar year in 2018. We have revised up our forecast for real GDP growth in 2018 to 2.9% (from 2.8%), to reflect faster than anticipated growth in the second quarter, of 4.1% in annualized terms, and heightened expectations of a similar rate of growth in the third quarter. The economy continues to receive support from the Trump administration’s fiscal policies, as well as from the ongoing strength in the labor market. However, the escalating trade dispute with China will start to weigh on growth later in 2018 and into 2019—we expect growth to slow in 2019 to 2.2%. The US manufacturing and agricultural sectors will be hit by the trade dispute, and rising interest rates will cause private consumption to slow. Growth will continue to slow in 2020, to a low of 1.3%, as the lingering effects of the trade dispute, higher interest rates and softening corporate balance sheets result in a business-cycle slowdown. A mild recovery will take place in 2021‑23 as these effects unwind, with growth averaging 1.9%.

Financial market volatility will remain high in 2019-20

The US-China trade war and growing geopolitical tensions will add to the risks facing emerging markets. Volatility in emerging-market currencies in recent months has fueled fears of a full-blown crisis. Capital flight has so far led to genuine currency crises in Turkey and Argentina, and we expect recessions in both. The Argentinian and Turkish crises have intensified the sell-off in emerging-market assets, which began in April because of the strengthening US dollar. Further periods of market volatility are likely as several key trends—tightening monetary conditions, the global trade dispute, heightened geopolitical risk and, in many emerging markets, a significant increase in debt levels in recent years—interact in challenging ways. Turkey and Argentina have experienced a perfect storm of external imbalances, namely weak monetary policy credibility and political risk, which few other economies currently share. As a result, we expect future exchange-rate crises to remain confined to the most vulnerable countries, with non-Organization for Economic Cooperation and Development (OECD) economic growth remaining steady in 2019‑20. However, there is a moderate risk (21‑30% probability) that a souring of market sentiment towards emerging markets as an asset class could lead to a noticeable slowdown in emerging-market growth in 2019‑20.

Our forecasts crucially assume that US monetary tightening will remain controlled and relatively gradual in 2019‑20, with inflation picking up only modestly. However, there remains a risk that US inflation and interest rates could rise faster than the rate that is currently built into financial market pricing, leading to falls in a wide range of asset prices that have been supported by years of extraordinary monetary policy support. Financial markets could also prove more sensitive to rises in interest rates than we currently assume. By keeping long-term interest rates extremely low through quantitative easing programs, major central banks have forced investors to look elsewhere for attractive returns, pushing up the prices of bonds, stocks and property. The effects on financial markets of withdrawing huge amounts of monetary stimulus are not well understood. The sharp sell-off in global share markets in October, amid rising US bond yields, shows the fragility of financial market sentiment. We have raised from low to moderate the likelihood of a sharp global slowdown brought about by a faster than expected increase in US interest rates.

World economic Growth forecast

World economic Growth forecast 2

Global GDP forecasts OCED

Nov 27, 2018 | 13:49 GMT

Asia-Pacific

The Asia-Pacific is home to more people than any other region. Centered on the western rim of the Pacific Ocean, this region includes the easternmost countries of continental Asia as well as the archipelagos that punctuate the coast. Several of these countries, most notably China, experienced rapid economic growth in the second half of the 20th century, giving the region a new sense of global economic relevance that continues today. That relevance, however, depends largely on China, a power in transition whose rise is testing the network of U.S. alliances that have long dominated the region. How effectively Beijing manages its transition will shape the regional balance of power in the decades to come. Read the Synopsis

Paddy fields

(Thoyod Pisanu/Shutterstock.com)

Table of Contents

OVERVIEW


Key Trends for 2019

China Weathers the Trade Storm

Beijing will try to keep its lines of communication with Washington open on trade by offering to buy more U.S. goods and selectively lower barriers to investment, but its concessions won’t meet U.S. demands for structural economic reform. Still, China will only respond in kind to U.S. measures targeting Chinese firms and entities and not take any blanket punitive action against U.S. businesses. Beijing will also deepen public-sector reforms by soliciting foreign investment for its financial, auto and energy sectors. Furthermore, it will ease restrictions in sectors that align with China’s prime interests, such as medical services and education.

China’s refusal to concede to U.S. demands will prolong the ongoing trade dispute.


The United States will maintain its demand that China ease state support for its tech sector, but that will only compel Beijing to accelerate its efforts to ease China’s dependence on foreign technology and diversify its supply chain — thereby necessitating increased state support for the sector. China’s refusal to bow to U.S. pressure on tech will prolong their trade dispute. At the same time, China will strive to acquire technology and cooperate on sector-specific activities with advanced tech powers like Japan, Israel, Taiwan and the European Union, but such activities will face increased scrutiny over concerns about Chinese investment and industrial espionage. Read more on China’s efforts to reform its state sector.

Chinas Domestic market Share percents

Beijing Battens Down the Hatches

Because the extended trade war threatens the economy in China’s coastal regions (and, thus, social stability), Beijing will ease its tight regulations designed to contain debt and protect the environment while upgrading infrastructure, generating credit and offering direct subsidies to boost growth. China will also carefully manage the yuan’s value to mitigate the damage to exports, allowing it to cope with reduced growth. But an accumulation of debt and the fragility of the housing market will limit Beijing’s ability to use massive credit flows and sharp currency devaluations as a means of economic stimulus.

China will have to rely more on fiscal stimulus — including reducing taxes — to encourage consumption and private sector activity.

It will also encourage the increased use of the yuan in currency swaps and in trade with countries participating in the Belt and Road Initiative to mitigate currency volatility. And to keep hedging against U.S. trade pressure, Beijing will pursue bilateral and regional free trade agreements, such as the Regional Comprehensive Economic Partnership in the Indo-Pacific region and trilateral negotiations with Japan and South Korea, all while forging ties with new export markets along the Belt and Road and in Africa. Southeast Asia’s emerging economies, meanwhile, will be ready to lure any factories that relocate from China amid the trade war. Threats to the overall regional supply chain and external financial volatility could also present challenges to countries with higher debt or current account deficits, such as Malaysia, Indonesia and the Philippines. Learn more about why state-owned enterprises are so important to China.

China Local Govt debt risk

Chinese Household debt

Great Power Competition in the Asia-Pacific

As it tries to chip away at the U.S. regional alliance structure, China will continue its conciliatory outreach to Japan, India and the member states of the Association of Southeast Asian Nations (ASEAN) by privileging dispute resolution efforts and economic partnerships while also making overtures to Australia, whose April elections could foster some rapprochement. At the same time, Washington will bolster its naval presence in the South China Sea and the Taiwan Strait and further challenge the One China principle by elevating Taipei’s status at international associations and regularizing arms sales, naval patrols and high-level visits.

The U.S. Navy will be more prevalent in the South China Sea and the Taiwan Strait, which will provoke China to adopt a more robust military posture.

In response, China will adopt tougher naval and aerial postures to assert its territorial claims, increasing the chances of accidents involving the U.S. military. The United States is considering making a naval port call in Taiwan — an event that would trigger a more direct Chinese military response. Japan, India and Australia will increase security cooperation with Washington, but they will refrain from joining U.S. freedom of navigation operations in the South China Sea or patrols in the Taiwan Strait. Elsewhere in the region, U.S.-ASEAN military exercises and U.S.-Vietnamese defense cooperation will complicate Chinese efforts to limit the further regional expansion of U.S. influence. Find out more about Taiwan’s role in U.S.-China competition.

A Fraying Consensus on North Korea

The United States is intent on extracting tangible concessions from North Korea in 2019. But this is also the year that Pyongyang hopes to squeeze the most out of the Trump presidency before the United States becomes distracted by its election cycle. Given the obviously high stakes of open warfare, neither will deliberately scuttle the dialogue. North Korea will carefully offer tangible pledges but will also expect concrete progress on sanctions relief or toward a peace deal; throughout the process, it will obfuscate and delay where it can. Pyongyang will also insist on assurances that any bilateral deal will have staying power beyond the current administration.

The United States will hesitate to extend an economic lifeline to North Korea by lifting sanctions, but time is on Pyongyang’s side as the international consensus on maintaining sanctions unravels.

For the moment, Washington’s veto power on the U.N. Security Council will allow it to block any effort to repeal the multilateral measures, even as China and Russia push for the international community to reward North Korea for its cooperation. At the same time, the United States will pressure others to fall into line on sanctions by shaming transgressors and threatening secondary sanctions against those who deal with Pyongyang. Complicating matters, inter-Korean detente is reaching the point where it cannot proceed much further without sanctions exceptions — something the United States will only approve after careful consideration. The growing discrepancy between the pace of the inter-Korean dialogue and the pace of the U.S.-North Korean discussions will leave room for China to extend its influence on the Korean Peninsula. Overall, while swings towards breakthroughs and breakdowns will occur throughout the year, North Korea will still maintain possession of many elements of its hard-won nuclear program at the end of 2019.

connecting Koreas.jpg

Moving the Belt and Road Forward

With its access to U.S. markets under strain, Beijing will redouble its efforts to find new export markets and partners through the Belt and Road Initiative. Washington will work principally with Japan and Australia to offer alternative infrastructure investments to counter China’s ambitions in the Indo-Pacific, but Beijing will temper potential partners’ concerns regarding financial sustainability, political influence and national security threats by attracting third-party investors. It will also work to undermine Washington’s regional initiatives by pursuing joint projects with middle powers, including Japan, the European Union and India. Take a more in-depth look at the resistance to the Belt and Road Initiative.

China Port Investments.jpg

A Japanese Awakening

Secure in his position through 2021, Japanese Prime Minister Shinzo Abe will aim to pass constitutional reforms before the end of 2019 while offsetting the economic impacts of a consumption tax hike through public works spending, incentives for private sector investment and tax exemptions for certain products. And though Russia and Japan will continue to negotiate over the disputed Kuril Islands, a larger standoff between Moscow and the West will scuttle any hopes of a deal.

When it comes to trade, the United States and Japan have an arrangement for now, but much will depend on how far Washington pushes Tokyo.

Meanwhile, Tokyo will grant concessions that will partly placate U.S. trade concerns — so long as the U.S. push for agricultural access does not exceed the limits outlined in the Comprehensive and Progressive Agreement for Trans-Pacific Partnership (CPTPP) and EU-Japan trade deals. If Washington pushes further, Tokyo will experience a backlash from its powerful farming lobby — although it will weigh whether to sacrifice its agricultural sector to avoid U.S. tariffs on its critical auto sector. Beyond that, Tokyo will also resist U.S. attempts to limit any future Japanese trade deal with China. Read more on Japan’s calculations on automotive and agricultural trade in the face of U.S. pressure

japan Agriculture Imports

Related Forecasts

These Stratfor analyses provide additional insights for the year ahead

Key Dates to Watch

  • Early 2019: Release of a World Trade Organization panel report on China’s challenge of the European Union’s refusal to grant China market economy status.
  • Early 2019: Next Trump-Kim summit may occur.
  • Jan. 1: Date that the United States could possibly raise the tariff rate on $200 billion worth of Chinese imports to 25 percent.
  • Jan. 14: First day the United States can hold formal trade deal talks with Japan.
  • January: First round of CPTPP’s tariff cuts will take effect.
  • March: Joint U.S.-South Korean military exercises Foal Eagle, Double Dragon and Key Resolve normally held.
  • May 18: Australia’s Senate elections must be held before this date, with House of Representative elections due by November.
  • June 28-29: A G-20 summit is scheduled to be held in Osaka, Japan.

August: U.S.-South Korean Ulchi Freedom Guardian military exercise normally held.

emerging middle class

Emerging middle class promises bumper payday for asset managers Growth will come from harnessing demand for financial products as demographics shift

Chris Flood DECEMBER 2, 2018

Many asset managers describe their businesses as global because they invest in financial markets across the world. Yet not one has succeeded in building a truly global client base that can rival those of leading technology companies such as Google and Amazon. Building a client base in emerging markets requires international investment managers to confront myriad legal and regulatory obstacles that can pose a threat to expansion plans. Yet the prize for doing so is potentially huge.

The growing size and prosperity of the middle classes across many emerging markets offers a tantalizing reward to those managers that can address the needs of institutional clients and retail investors in these countries. “The investment industry is a natural beneficiary of the growth in wealth and savings among the middle classes in emerging markets,” says Kunal Desai, a portfolio manager with Mobius Capital, a London-based specialist emerging market boutique. “But it tends to get overlooked in favour of sectors that are seen as more obvious winners, such as consumer goods.” Investor assets managed in the Asia-Pacific, Latin America, Middle East and Africa regions will increase from about $16.1 trillion at the end of 2016 to $38.5 trillion by 2025, according to PricewaterhouseCoopers (PwC), a professional services provider.

Olwyn Alexander, a partner at PwC, says profiting from this rise requires cultural change. “Historically, there has been a lack of an investment culture in many emerging markets,” she says. “But even a small shift can present significant opportunities given the magnitude of the populations in some of these countries.” $420 billion New money expected to flow into the fund industry in India over the next decade Asset managers need to ensure they can cater to younger investors, Ms. Alexander says. “Asset managers will need technology capabilities to process large numbers of small dollar value transactions from mobile devices,” she adds. Among the fastest-growing managers in Asia, local and international, two common traits stand out. All are making big bets on China and have invested in new digital services to attract the growing middle class’s rising wealth.

A successful marriage between technology and asset management is exemplified by Yu’E Bao, a fund created as a repository for leftover cash from consumers’ online spending accounts by the Chinese company Ant Financial in 2013. Yu’E Bao has grown into the world’s largest money market fund with more than 400 million users. “The big fin techs are aiding China’s shift to a cashless society,” says Jacob Dahl, a senior partner at McKinsey, based in Hong Kong. “How asset managers position themselves to serve these digital platforms will be critical, not only in China but also in other Asian markets where fin techs are gaining ground.” China, which is on course to replace Europe as the world’s second-largest fund market behind the US, provides the single largest growth opportunity for global asset managers over the next decade. The country’s mutual fund assets could multiply five-fold to reach $7.5 trillion by 2025, creating a fee pool worth $42 billion a year, according to UBS. “But it all depends on the progression of reform and deregulation,” says Kelvin Chu, an analyst with UBS.

In India, a decade of consistently strong economic growth has helped to accelerate the rise of the middle class. The National Council of Applied Economic Research, a Delhi-based think-tank, has forecast that this group will number 547 million people by 2026, from 267 million in 2016.

Indias middle class.jpg

India’s middle class is expected to double to 550 million by 2026 © Alamy

India’s government has implemented a series of reforms that have significantly boosted inflows into fund management. “We estimate that around $420 billion in new money from domestic investors will flow into the fund industry in India over the next decade,” Mr. Desai says. “This compared with around $180 billion from both domestic and international sources over the past 10 years.”

Managers should be careful not to overlook Indonesia, Malaysia and Thailand, Mr. Dahl says. “We expect assets under management in these markets to nearly double over the next five years from a collective $600 billion today,” he says.

Across Asia as a whole, close to 90 per cent of financial assets sit outside the control of asset managers, with the industry overseeing a far lower share than in Europe or the US, according to McKinsey.

However, rising numbers of billionaires in Asian countries, the further growth of large government-sponsored sovereign wealth funds and the development of private pension systems to meet the needs of rising numbers of savers should all provide new sources of growth. “The Asia asset management revenue [fee] pool stands at around $66 billion today and we expect this to [reach] $112 billion by 2022,” says Mr. Dahl.

88% emering middle class.jpg

China Economic Update

eric wong

By Eric Wong
Managing Director, Canada Wood China

October 31, 2018

China to Reduce Wood Import Tariffs November 1

2018 Q3 highlights:

  • China’s GDP hit the lowest growth in September (6.5%) since the first quarter of 2009 during the global financial crisis and missed market consensus of 6.6%.i
  • China Economic growth slowed down in the third quarter due to:
    • to a decrease in infrastructure investment
    • a negative spillover from financial deleveraging
    • the impact of previous economic reforms
    • a cooling housing market.
  • However, export growth continued to grow strongly in Q3 in spite of trade tension with the U.S.ii
  • A recent government announcement effective November 1st, 2018 states that China will cut import tariffs on more than 1,500 products to lower the average import tariff to around 7.8%. Import tariffs on wood and paper products will be decreased to 5.4% from 6.6% which will help wood-based panels and other related imports to grow in China.iii

PMI (Caixin) index in September (50.0) dropped to a 16-month low and missed market consensus of 50.5 which was also the lowest point of the continuously descending trend started from May (51.1).iv China Exports achieved a 14.5% gain year-on-year to USD 226.7 million in September which was the fastest growth in outbound shipments since this February and also beat market consensus of 8.9%.v

china economy exports and manufacturing.jpg

China Consumer Price Index (CPI) started to go up from May (101.8) to September (102.5) which achieved the second highest month only after February (102.9).vi Similar to Q2, USD/CNY had also been on the rise in Q3, increased from 6.62 (July 1st) to 6.81 (August 1st) to 6.83 on September 1st;vii CAD/CNY kept the similar upward trend, went from 5.04 (July 1st) to 5.23 (August 1st) and hit 5.24 on September 1st.viii


Building material prices

Cement price increased slightly from RMB 435.67 to RMB 456.00 per metric ton (up 4.67%) over September 2018.ix Rebar steel price also went up slightly by 2.63% from RMB 4,415.38 per metric ton on September 1st 2018 to RMB 4,531.54 per metric ton on September 30th 2018.x The log price index in September 2018 was 1,096.96 points which decreased 0.26% less than August 2019 and reduced 0.84% compared to the same period year-on-year; the lumber price index in September 2018 was 771.05 points which went up slightly by 0.02% month-on-month and increased 0.36% year-on-year.xi

China-US Trade Dispute Update xii

The trade war between China and United States continues to impact markets.
During the first half of 2018 U.S. wood products made up:

  • 13% of China’s softwood log imports; was 54% in 2017
  • 2% of China’s softwood lumber imports; was 38% in 2017
  • 7% of China’s hardwood log imports;
  • 21% of China’s hardwood lumber imports.

China Wood Imports xiii

Russian softwood lumber imports have been rising steadily since this February when imports hit the highest in May (1,590,000 m3) and maintained at the level of 1,500,000 m3 in August; Canadian softwood lumber imports on the other hand maintained 350,000 m3 each month from June to August but decreased 29% in August to (327,000 m3) compared to the same month last year.

Logs and lumber inventory at Taicang, Wanfang and Meijing ports hit a new low in August (802,000 m3) which decreased consistently since this March, but winter and Chinese

New Year inventory volume at all ports will be on the rise based on previous trends. Import volumes of total logs and lumber fluctuated at reasonable curves and achieved 8,814,000 m3 in August, the second highest month so far in 2018.

China softwood lumber

china softwood lumber imports.jpg

china demand for wood total imports

Trading Economics (October 20th, 2018). China GDP Annual Growth Rate
ii Focus Economics (October 16th, 2018). China Economic Outlook
iii Wood Markets/FEA (October 2018). China Bulletin
iv Trading Economics (October 20th, 2018). China Caixin Manufacturing PMI
Trading Economics (October 20th, 2018). China Exports
vi Trading Economics (October 20th, 2018). China Consumer Price Index (CPI)
vii XE Currency Charts: USD to CNY
viii XE Currency Charts: CAD to CNY
ix Sunsirs (October 2018). Spot Price for Cement
Sunsirs (October 2018). Spot Price for Rebar Steel
xi BOABC (October 2018). China Wood and Its Products Market Monthly Report
xii Wood Markets/FEA (October 2018). China Bulletin
xiii Wood Markets/FEA (October 2018). China Bulletin

Who will benefit from the American timber tariff?

dora Xue

By Dora Xue

October 31, 2018

China announced a 25% tariff on U.S. imports, on a value of $16 billion from August 23rd. The taxed products include $1.83 billion of wood products and logs.

A large range of wood products are listed in the tariff list, including oak logs, birch logs, OSB, spruce, larch, teak, wooden window frames, shelves, furniture etc.

China is the biggest importer for American wood products. The United States exported 6.14 million m3 logs to China, accounting for 53.9% of U.S. logs, and 3.27 m3 lumber, accounting for 38% of U.S. sawn timber exports, according to the U.S Bureau of Statistics. The China market represents half of total U.S. log exports, and one third of its sawn timber exports.

The U.S. tariffs will increase the cost of U.S. wood imports, which will make America timber gradually lose its competitiveness and market position in China.
As forecasted by China Timber Website, Chinese buyers may turn to other countries such as Russia and Europe as the properties of timber from those countries are very similar to that of the U.S.

china US trade war.jpg

Korean Technical Mission Ends in Success

Tai Jeong.jpg

By Tai Jeong

Technical Director, Canada Wood Korea

October 31, 2018

Posted in: Korea

Canada Wood Korea has successfully completed its annual Technical Mission, visiting Canada and Japan from September 26 to October 7 with participation of 13 WFC industry leaders including renowned architects, structural engineers and prefab manufacturers and 1 media reporter.
Mission participants attended technical seminars both at FPInnovations and Canada Wood Japan office to learn about technical aspects and commercialization of the Midply Shearwall system, industrialization plants and various buildings sites both in Canada (British Columbia and Alberta provinces) and Japan to learn about innovative industrialized WFC systems including pre-fabrication, modular homes and tall wood mass timber construction.
All participants said It was a wonderful opportunity to experience actual applications of wood along with technical seminars. Especially, Mr. Je Yu Park, President-elect of the Korean Institute of Architects (KIA) who participated in the mission, agreed to sign an MOU with Canada Wood for technical cooperation and jointly hold the WFC Seismic Workshop for member architects in conjunction with the Forest Sector Mission to Korea led by the Minister Doug Donaldson this coming December 2018. Mr. Park also promised to establish a Wood Structure Design Advisory Committee Division at KIA after his inauguration next year.

Korean tour 1Korean tour 2

Korean tour 3

Korean tour 4.jpg

Korean tour 5

Canada Wood Korea signs agreement with Korean Institute of Architects

JOC News Service December 17, 2018

korean institute MOU.jpg

VANCOUVER — Canada Wood Korea and the Korean Institute of Architects have signed a memorandum of understanding (MOU) to help Korean architects work better with Canadian wood.

The technical co-operation agreement was signed on Dec. 7 by senior forest industry representatives on the Forestry Asia Trade Mission, which consisted of a group of more than 40 delegates including industry, research, labour, First Nations and government.

The group also visited the Gapyeong Canada Village Project on Dec. 8., which uses wood products from B.C. and other parts of Canada. The village is the result of a 2013 MOU signed by Canada Wood Korea, the Gyeonggi Urban Innovation Corporation and Dreamsite Korea.

Gapyeong Canada Village Project

Canada-Village-2


“South Koreans’ interest in wood construction is growing because they recognize that wood construction fares better than other materials in the event of earthquakes. By promoting the benefits of wood and sharing technical expertise, we can open up new opportunities in Korea for our province’s high-quality wood products. This, in turn, supports forestry jobs in B.C.,” said B.C. Minister of Forests, Lands, Natural Resource Operations and Rural Development Doug Donaldson in a statement.

The MOU is intended to raise the skill and knowledge levels of Korean architects and designers so they are better equipped to work with wood. The Institute will benchmark Canadian best practices for wood-frame residential housing, wood interior walls and Super-E/Net-Zero housing design, a standard designed by Natural Resources Canada where a home produces all needed energy from renewable sources and releases no carbon from the burning of fossil fuels.

South Korea is B.C.’s fifth-largest market for wood products, with softwood lumber exports totaling over $73 million in 2017.

Korea – Economic forecast summary (November 2018)

READ full country note (PDF)

Economic growth is projected to remain close to 3% through 2020, as fiscal stimulus offsets sluggish employment growth, which reflects double-digit hikes in the minimum wage in 2018-19 and restructuring in the manufacturing sector. Measures to stabilize the housing market have led to a decline in construction orders for residential property. Inflation is expected to edge up from 1½ per cent toward the 2% target, while the current account surplus will remain above 5% of GDP.

Hikes in the minimum wage should be moderated to avoid negative effects on employment. The “income-led growth” strategy, driven by minimum wage increases and higher public employment and social spending, needs to be supported by reforms to narrow productivity gaps between manufacturing and services, and between large and small firms. Short-term fiscal stimulus should be accompanied by a long-term framework to cope with population ageing, which will be the fastest in the OECD. With inflation below target, the withdrawal of monetary accommodation should be gradual.

Korea

korean economic stats.jpg

http://dx.doi.org/10.1787/888933876974 

Korea Demand Output.jpg

Supportive macroeconomic policies should be accompanied by structural reforms The government is responding to weaker domestic demand with fiscal stimulus. Spending is to increase by 9.7% in 2019, the highest since 2009 in the wake of the global recession. Social welfare spending is the priority, along with outlays for job creation, which are set to rise by 22%. In addition, the government aims to boost public employment by 34% over 2017-22. Despite increased spending, the general government budget will remain in surplus at around 2% of GDP in 2019, while government debt is low at just under 45% of GDP. The policy interest rate has remained at 1.5% since late 2017. With consumer price inflation below 2%, the normalization of monetary policy should be gradual. Monetary policy also needs to consider potential risks to financial stability, including capital flows and household debt, which rose at an 8% pace in the first half of 2018. At 186% of net disposable household income in 2017, household debt remains a headwind to private consumption. Raising labour productivity, which is 46% below that in the top half of OECD countries, is increasingly important for growth as the working-age population peaked in 2017. The priority is regulatory reform, focusing on services, where labour productivity is less than half of that in Korean manufacturing. Policies to promote entrepreneurship and raise productivity in SMEs are also needed to promote inclusive growth. Increasing female employment and reducing the gender wage gap, which is the highest in the OECD at 37%, is another priority. Growth is projected to be stable Output growth is projected to remain close to 3%, despite sluggish employment growth in 2019, partly as a result of a hike in the minimum wage by a further 10.9%. Further large increases, as part of the government’s commitment to a sharp increase in the minimum wage, would damp employment and output growth. The improved relationship with North Korea is a landmark event that may also have positive economic implications. Moreover, progress with structural reforms to raise productivity in lagging sectors would boost output growth. However, trade protectionism remains a concern: with intermediate goods accounting for four-fifths of Korea’s exports to China, its largest trading partner, Korea is vulnerable to higher import barriers on Chinese exports to the United States.

Taiwan exports end 24-month rise

U.S.-China trade war played part in sudden drop: MOF

By Matthew Strong,Taiwan News, Staff Writer

2018/12/07 17:29

taiwan exports.jpg

Taiwan’s exports end 24 consecutive monthly increases. (By Central News Agency)

TAIPEI (Taiwan News) – Taiwan’s exports ended 24 consecutive months of increases by recording a drop of 3.4 percent for November, the government announced Friday.

The Ministry of Finance (MOF) identified lower-than-expected sales of high-end smartphones, a weakening of overseas investment needs, and the impact of the trade war between the United States and China as the three reasons why exports fell in November compared to the same period last year, the Apple Daily reported.

The value of exports for November totaled US$27.81 billion (NT$858.78 billion), a drop of 3.4 percent compared to November 2017 and of 5.9 percent compared to October 2018, according to MOF data.

However, for the period from January to November 2018, exports still rose from the same period last year to reach a total of US$307.46 billion (NT$9.49 trillion), the MOF stated Friday.

100 days under Pakatan

Economy faces mounting risksPrime Minister Mahathir Mohamad.jpg

Prime Minister Mahathir Mohamad said his government had realized over a third of its 60 election promises “to unshackle Malaysia from the issue of corruption and ensure good governance” .PHOTO: EPA-EFE

PUBLISHED

AUG 18, 2018, 5:00 AM SGT

KUALA LUMPUR • Malaysian Prime Minister Mahathir Mohamad marked his 100 days in office yesterday with risks mounting against the economy.

Gross domestic product in the second quarter grew at 4.5 per cent, its slowest pace in over a year, the current-account surplus narrowed sharply and the currency is facing pressure as an emerging-market rout worsens.

After a shock election win in May, Tun Dr Mahathir has moved quickly to deliver on promises to  a speech broadcast nationwide yesterday, Dr Mahathir said his government had realized over a third of its 60 election promises “to unshackle Malaysia from the issue of corruption and ensure good governance”. These measures included policies on declaring assets, bolstering anti-corruption institutions and protecting media freedom.

The political transition had an impact on the economy last quarter, with public sector investment contracting 9.8 per cent from last year.

Noting in his speech that the national debt was RM 1 trillion (S$334 billion), Dr Mahathir listed infrastructure projects that have been put on hold, including the Singapore-Kuala Lumpur High-Speed Rail, the third phase of the Mass Rapid Transit and the China-backed East Coast Rail Link.

Domestic demand remained strong and was buoyed by the scrapping of a 6 per cent goods and services tax in June, another election pledge.

singapore rally.jpg

Related Story

100 days under Pakatan: Mahathir, the strongman reformist?

Related Story

100 days under Pakatan: Malay, Islamic issues still dominate politics

Private consumption climbed 8 per cent last quarter from a year ago, while investment surged 6.1 per cent.

“The bigger picture we see going forward, private consumption will be modest as many Malaysians probably front-loaded their purchases ahead of the sales tax coming in September, so it’s hard to see how that’s sustained,” said Mr. Brian Tan, an economist at Nomura Holdings in Singapore.

Central bank governor Nor Shamsiah Mohd Yunus said the economy will probably expand about 5 per cent this year, lower than the previous government’s projection of 5.5 per cent to 6 per cent.

BLOOMBERG, BERNAMA

A version of this article appeared in the print edition of The Straits Times on August 18, 2018, with the headline ‘Economy faces mounting risks’. Print Edition | Subscribe

Destitute dotage

Vietnam is getting old before it gets rich

That makes caring for the elderly hard to afford

vietnamese wpmen.jpg

Print edition | Asia

Nov 8th 2018| HANOI

As dawn breaks in Hanoi the botanical gardens start to fill up. Hundreds of old people come every morning to exercise before the tropical heat makes sport unbearable. Groups of fitness enthusiasts proliferate. Elderly ladies in floral silks do tai chi in a courtyard. In the shade of a tall tree, dozens of ballroom dancers sway to samba music. Others work up a sweat on an outdoor exercise-machine. Tho, an 83-year-old with a neat white moustache, says he comes to walk round the lake every day, rain or shine.

In the next few decades the gardens will become busier still. Vietnam has a median age of only 26. But it is greying fast. Over-60s make up 12% of the population, a share that is forecast to jump to 21% by 2040, one of the quickest increases in the world (see chart). That is partly because life expectancy has increased from 60 years in 1970 to 76 today, thanks to rising incomes. Growing prosperity has also helped bring down the fertility rate in the same period from about seven children per woman to less than two. In the 1980s the ruling Communist Party started to enforce a one-child policy. Though less strict than China’s, it has hastened the decline.

Demography is changing in similar ways in many Asian countries. But in Vietnam it is happening while the country is still poor. When the share of the population of working age climbed to its highest in South Korea and Japan, annual GDP per person (in real terms, adjusted for purchasing power) stood at $32,585 and $31,718 respectively. Even China managed to reach $9,526. In Vietnam, which hit the same peak in 2013, incomes averaged a mere $5,024. Indonesia and the Philippines are expected to reach the turning-point in the next few decades, with an income level several times higher than Vietnam’s.

old before its time

This shift brings headaches. First, will the government be able to support millions more Vietnamese in old age? Only the extremely poor and people over 80 (together around 30% of the elderly) get a state pension, which can be as little as a few dollars a week. The most recent survey of the old, in 2011, found that 90% of them had no savings worth the name. Debt was common. Supporting them will become ever more expensive. The IMF predicts that pension costs, at the present rate, could raise government spending as a share of GDP by eight percentage points by 2050. That is faster than in any of the other 12 Asian countries it examined.

The problem is worse in the countryside, where most old folk live. Previously the young cared for their parents in old age. Today they tend to abandon village life to seek their fortune in the city. Surveys suggest that the share of old people living alone is rising, especially in villages. Many work until they die. Around 40% of rural men are still toiling at 75, twice the rate of city-dwellers. In Britain that figure is 3%. Often they do gruelling manual jobs, such as rice farming or fishing.

Providing health care for millions more old people is another worry. Alzheimer’s, heart disease and age-related disability are growing. In the botanical garden Toau, a 78-year-old in a white sports t-shirt, says he is there on doctor’s orders, before taking a pill for his bad heart and joining an exercise group. About a third of over-60s do not have health insurance, which is costly. Many provinces still have no proper geriatric departments in hospitals. Informal health-insurance groups have popped up to fill the gaps. For a fee, members get exercise classes and free check-ups. But few doctors are trained or equipped to treat more serious conditions.

The government is starting to implement policies to reduce the fiscal burden and improve the lot of the elderly. Last year it relaxed the one-child policy. In May it said it would increase the retirement age from 55 to 60 for men and 60 to 62 for women, and reform the pension scheme to provide wider coverage. Next year it plans to begin revamping the health-insurance and social-assistance systems.

But none of that will change the structure of the economy. Usually as countries climb the income ladder, they shift from farming to more productive sectors, like services. By this yardstick, Vietnam is lagging its neighbors. When the working-age population peaked in 2013, agriculture accounted for 18% of the economy. At the same juncture in China, agriculture was just 10% of GDP. Worse, farmers’ output tends to decline with age, unlike, say, that of managers. This over-reliance on agriculture partly explains why three-quarters of Vietnam’s workers are in jobs where they become less productive as they get older. In Malaysia that is the case for only about half the labour force.

Boosting productivity will be tricky. The government is still wedded to “statism”. State-owned enterprises dominate many industries. Most university students, meanwhile, waste at least a year learning Marxist and Leninist theory. Many countries in Asia are ageing fast. But growing old before it becomes rich makes Vietnam’s problems all the greater.

Economists fret over trade tensions, shave forecast for Singapore growth in 2019

WED, DEC 12, 2018 – 12:00 PM

ANNABETH LEOW leowhma@sph.com.sg@AnnabethLeowBT

singapore growth

For 2018, Singapore’s economy is expected to grow by 3.3 per cent, a tad up from September’s forecast of 3.2 per cent.
ST PHOTO: KUA CHEE SIONG

PRIVATE economists unanimously fingered higher US-China trade tensions as a downside risk to Singapore’s growth, as they dialed down their forecast for 2019 in a recent industry poll.

Economists expect Singapore’s gross domestic product (GDP) growth to ease to 2.6 per cent in 2019, from an estimated 3.3 per cent in 2018, according to results out on Wednesday from a quarterly survey by the Monetary Authority of Singapore (MAS).

They had previously projected in September’s poll that the national GDP would notch 3.2 per cent growth in 2018 and 2.7 per cent in 2019.

The subdued showing is expected to come on the back of a marked slowdown in manufacturing growth – from an estimated 7.4 per cent in 2018, to just 3 per cent in 2019 – and cooling growth in the finance and insurance sector, from 6.9 per cent in 2018 to 5.4 per cent in 2019.

The weakness is expected to extend to the accommodation and food services sector, where growth could ease from 3.4 per cent in 2018 to 2.8 per cent in 2019.

SEE ALSO: Singapore retail sales inch up by 0.1% in October as growth tapers off

Such declines would offset the anticipated improvement in wholesale and retail trade – with growth expected to pick up from 1.3 per cent in 2018 to 1.7 per cent in 2019 – and a turnaround in the construction sector, which could go from a year-on-year contraction of 3.5 per cent in 2018 to an expansion of 1.5 per cent in 2019.

Growth in non-oil domestic exports is expected to fall by more than half, from 6.2 per cent in 2018 to 2.9 per cent in 2019.

Headline inflation was predicted to come in at 0.5 per cent for 2018, in line with official estimates, as private economists moved their forecast down from September’s 0.7 per cent.

They also trimmed their expectations for 2019’s headline inflation numbers, to a forecast of 1.3 per cent, from the 1.5 per cent that was anticipated in September.

The downgrade came on the back of an expected moderation in private consumption, from 3.4 per cent growth in 2018 to 3.1 per cent in 2019.

Estimates for core inflation – an MAS indicator that strips out private transport and housing costs – were kept intact at 1.7 per cent for 2018 and 1.8 per cent for 2019.

Meanwhile, trade protectionism was seen as the top risk to the economy by far – picked by all of the survey’s respondents, against 89 per cent of them in September – even as the share of watchers concerned by rising interest rates and a slowdown in China also edged up to 41 per cent of respondents, from 37 per cent in the previous survey.

“A growing number of respondents flagged slower growth in China as a downside risk, on the back of tightening credit conditions,” said the MAS in its summary of the survey results.

“Faster than expected US interest rate hikes, which could trigger financial market turbulence, also continue to be a downside risk for a number of respondents.”

But, on the bright side, cooling trade tensions could lift the growth outlook, said 47 per cent of respondents, up from 37 per cent in September.

Slower-than-expected monetary tightening in the US, as well as potential benefits from the diversion of trade and investment out of China and into the region, also appeared on the list of top three upside possibilities – both cited by 29 per cent of respondents.

The central bank’s December survey, which was sent out on Nov 22, netted replies from 23 economists who track the Singapore economy. It does not represent the MAS’s views or forecasts.

Philippines Q3 GDP growth slows, misses forecast

THU, NOV 08, 2018 – 11:00

Manila.jpg

[MANILA] The Philippines’ economic growth slowed in the third quarter due to weaker household consumption and exports, the statistics agency said on Thursday.

Gross domestic product grew 6.1 per cent in the third quarter from a year earlier, below the 6.3 per cent median forecast in a Reuters poll and slower than the previous quarter’s upwardly revised 6.2 per cent growth.

Details on quarterly growth are due to be released later.

REUTERS

https://www.businesstimes.com.sg/government-economy/philippines-trade-deficit-stays-above-us3b-imports-up-11

Thailand Needs More Skilled Foreign Workers

Thailand needs to attract skilled foreign workers, especially in the industrial technology sector

The minimum monthly income for highly-skilled experts Smart Visa has been changed to 100,000 baht and to 50,000 baht for experts in startups and retired experts

By Olivier Languepin On Dec 5, 2018

Thai skilled labor.jpg

Samut Sakhon One Stop Service

A Thai academic says the nation needs to attract skilled foreign workers to work in the country, especially in the industrial technology sector, to overcome a shortage of skilled-workers.

In a seminar held by the Institute for Population and Social Research of Mahidol University, a university researcher, Ms. Sureeporn Phanpueng , revealed that Thailand needs around 2.3 million more skilled employees to work in innovative and technological industries, robotics, and the health and food industries.

The event was attended by academics and those from related fields. Ms. Sureeporn proposed that the government solve the problem by offering work visas to skilled foreign workers who take up positions in Thailand and by creating an attractive living environment for them.

She also wants the government to promote the transfer of technological know-how between foreign experts and Thai workers, as well as international education in Thailand.

RELATED POSTS

Southeast Asia Internet economy to be worth $240bn by 2025

Nov 23, 2018

Thailand’s Smart Visa Requirements Made Easier

Nov 20, 2018

The government is now accepting four-year visa-free grants and free work permits under the “Smart Visa” programme which is targeting industry experts and foreign technology investors.

Thailand’s Smart Visa Requirements Made Easier

The Thai government has improved requirements and conditions for the Smart Visa in order to provide greater convenience for foreign investors and experts

For example, the government has changed the income condition for highly-skilled experts and senior executives from a monthly salary of no less than 200,000 baht to a monthly income that also covers bonuses and other incomes.

The minimum monthly income for highly-skilled experts has also been changed to 100,000 baht and to 50,000 baht for experts in startups and retired experts. The adjustments are aimed at increasing the country’s competitiveness and ability to attract more specialists.

Similarly, the government has improved various conditions in increasing access to capital for startups and strengthening venture capitalists. For example, investments can now be made through venture capital companies.

For the Thailand 4.0 policy to effectively push for digital transformation, Thai manufacturers will need to first improve the skills of their workforce,” said Karel Eloot, senior partner of McKinsey & Company, during an exclusive interview with The Nation.

The Thailand 4.0 policy is intended to modernize the Thai economy by promoting technologically driven industries. The development of the EEC region is a materialization of the Thailand 4.0 policy where the government aims to turn the three provinces of Chon Buri, Chachoengsao and Rayong into special economic zones.

“Re-skilling will be needed for the existing workers. We have identified up to 7 million employees in Thailand who will need to be reskilled for companies to digitally transform,” he said.

The re-skilling is needed because digital transformation will mean new roles and jobs will be created while old ones will be made obsolete, Eloot explained.

Australia’s economy is still booming, but politics is a cause for concern

Political infighting could harm the economy, says Edward McBride

australia

Print edition | Special report

Oct 27th 2018

The last time Australia suffered a recession, the Soviet Union still existed and the world wide web did not. An American-led force had just liberated Kuwait, and almost half the world’s current population had not yet been born. Unlike most of its region, Australia was left unscathed by the Asian crash of 1997. Unlike most of the developed world, it shrugged off the global financial crisis, and unlike most commodity-exporting countries, it weathered the resources bust, too. No other rich country has ever managed to grow so steadily for so long (see chart 1). By that measure, at least, Australia boasts the world’s most successful economy.

inRead invented by Teads

Admittedly, as Guy Debelle of the Reserve Bank of Australia (RBA, the central bank) points out, this title rests on the statistical definition of a recession as two consecutive quarters of decline. Had the 0.5% shrinkage of the fourth quarter of 2008 been spread across half a year, he notes, there would be no record. Yet by other measures, Australia’s economic performance is more remarkable still. Whereas many other rich countries have seen wages stagnate for decades, Australia’s have grown strongly, albeit less steadily in recent years (see chart 2). In other words, a problem that has agitated policymakers—and voters—around the world, and has been blamed for all manner of political upheaval, from European populism to the election of Donald Trump, scarcely exists in Australia.

And that is not the only way in which Australia stands out from its peers. At a time when governments around the world are souring on immigration, and even seeking to send some foreigners home, Australia has been admitting as many as 190,000 newcomers a year—nearly three times as many, relative to population, as America. Over 28% of the population was born in another country, far more than in other rich countries. Half of all living Australians were born abroad or are the child of someone who was.

In part, this tolerance for outsiders may be a reflection of another remarkable feature of Australian society: the solvency of its welfare state. Complaints about foreign spongers are rare. Public debt amounts to just 41% of GDP (see chart 3)—one of the lowest levels in the rich world. That, in turn, is a function not just of Australia’s enviable record in terms of growth, but also of a history of shrewd policy making. Nearly 30 years ago, the government of the day overhauled the pension system. Since then workers have been obliged to save for their retirement through private investment funds. The modest public pension covers only those without adequate savings.

Dinkum.jpg

Australia’s health-care system is also a public-private hybrid. The government provides coverage for all, by paying clinics and hospitals a set fee for every procedure they perform. Those who want more than the most basic service must pay a premium. The government encourages people to take out insurance to cover the gap between the reimbursement it provides practitioners and the rates most of them charge the public. As with pensions, everyone gets looked after, but the government bears only a relatively small proportion of the cost—an arrangement that remains a distant dream in most rich countries.

Not all is perfect, of course. A common concern is that the economy relies too heavily on China, which is the biggest buyer of Australian minerals, the biggest source of tourists and foreign students, even the biggest consumer of Australian wine. People worry that if the Chinese economy falters, it will drag Australia’s down with it. Another fear, somewhat at odds with the first, is that China might try to use its economic power to blackmail Australia into weakening its alliance with America.

australia pop growth by state

There are glaring domestic problems, too. The appalling circumstances of many Aboriginals are a national embarrassment, and the failure to answer their political grievances compounds the rancor. Even more alarmingly, global warming is making an already grueling climate harsher. Rainfall, never reliable, is scarcer and more erratic in many farming regions. Over the past two years unusually hot water has killed a third of the coral on the Great Barrier Reef, one of the country’s greatest natural treasures.

In theory both the governing Liberal-National coalition (which is right-of-centre) and the main opposition, the left-leaning Labor Party, are committed to cutting emissions of greenhouse gases. But in practice climate change has been the subject of a never-ending political knife-fight, in which any government that attempts to enact meaningful curbs is so pilloried that it either loses the next election or is toppled by a rebellion among its own Members of Parliament (mps).

Some see the failure to settle on a coherent climate policy as a symptom of a deeper political malaise. Australia used to have long-lived governments. Between 1983 and 2007, just three prime ministers (pm) held office (Bob Hawke and Paul Keating of Labor, and John Howard of the Liberals). Yet, since then, the job has changed hands six times. A full term is only three years, but the last time a prime minister survived in office for a whole one was 2004-07. The assassins are usually not voters, but fellow mps who dispatch their leader in hope of a boost in the polls. As part of the research for this special report, your correspondent interviewed Malcolm Turnbull, the prime minister at the time, who insisted his position was secure. He had been sacked by his fellow Liberals before the interview could be written up.

The changes of pm have come so often that Madame Tussauds, a wax museum, has officially given up trying to make statues of the incumbent, who will inevitably have left office before a likeness is ready. The constant revolution is not just fodder for comedians; it also makes consistent policy making much harder. For those who consider Australia’s unequaled economic performance the result, at least in part, of far-sighted decisions made 30 years ago, the current choppy politics seem like a harbinger of decline.

This special report will try to explain Australia’s enviable record, and ask how long its good fortune can last. Is it adopting the reforms needed to keep the economy bounding ahead? Will it have to choose between China and America? Is the current generation of politicians up to the job? Is Australia, in short, as lucky a country as its nickname suggests, or is its current streak coming to an end?

https://www.economist.com/special-report/2018/10/25/australia-takes-in-far-more-immigrants-than-other-rich-countries-with-less-friction

https://www.economist.com/special-report/2018/10/27/diversity-helped-australia-weather-the-resources-bust

https://www.economist.com/special-report/2018/10/27/clever-reforms-30-years-ago-helped-australias-growth

https://www.economist.com/special-report/2018/10/27/poisonous-politics-could-spell-an-end-to-australias-winning-streak


d6047eeff655adc8467106c3cf6d22f3.jpg