First Quarter 2016 Economic and Wood Product News and Blues

South-East Asian integration
More hat than cattle
A seamless regional economic bloc is just around the corner—as always

opening up

Jan 2nd 2016 | SINGAPORE | From the print edition
Opening up, ASEAN-style

GRANDIOSE statements from the Association of South-East Asian Nations (ASEAN) are the region’s Christmas crackers: they appear at regular intervals, create a commotion but contain little of substance. In November the leaders of the club’s ten members declared that the ASEAN Economic Community (AEC)—a single market around which goods, services, capital and “skilled labor” are supposed to flow freely—would come into being on December 31st.

So will South-East Asia’s 622m people wake up in a new world in 2016, or will the AEC prove another paper crown?
The answer probably lies somewhere in the middle. For one thing, much of the work towards economic integration has been done: by ASEAN’s reckoning, 79.5% of the measures the AEC involves have already been implemented. ASEAN already attracts large amounts of foreign investment, and its leaders have been talking up integration and regionalism since the organization was founded in 1967. So the AEC represents less a radical change than an attempt to accelerate existing trend

But anyone hoping that ASEAN is about to turn into an Asian version of the European Union will be disappointed. European integration is fundamentally a political project with an inward focus, argues Jayant Menon of the Asian Development Bank, which has led to a mushrooming of institutions. The AEC, in contrast, is an economic project, with almost no institutional heft—just a small secretariat—devoted to “outward-oriented regionalism”. It is designed to make the region an easier and more attractive place for foreign companies to do business and thus to boost trade and investment.

Those missions are helped by ASEAN’s economic dynamism. Between 2007 and 2014 regional GDP doubled, from $1.3 trillion to $2.6 trillion, and GDP per person grew from $2,343 to $4,135. Total internal and external trade grew from $1.6 trillion to $2.5 trillion, and foreign direct investment rose from $85 billion to $136 billion. Viewed as a single economy, ASEAN is the world’s seventh-largest and Asia’s third-largest, behind China and Japan. And while China and Japan are ageing rapidly, ASEAN remains young, with more than half its population under 30. China’s slowdown has taken its toll on the region—particularly on commodity exporters such as Malaysia and Indonesia—but its young workforce, improving infrastructure and rising incomes leave it poised for strong future growth.

Behind those aggregate figures, though, lie vast differences, not all of which are conducive to economic integration. Vietnam and Laos are communist dictatorships; Brunei an absolute monarchy; the Philippines and Indonesia rowdy democracies. Singapore was founded as a trading entrepot (or trans-shipment port) in 1819; Indonesia has a history of protectionism. Perhaps inevitably, the commitment of such a diverse bunch to regional integration, and the pooling of sovereignty it implies, is not as strong as ASEAN’s triumphant statements suggest.

Real-Singapore

There is no mechanism to enforce the group’s many agreements and treaties. Regional banking systems and capital markets remain unintegrated. Tariffs may vanish, but non-tariff barriers pop up in their place. Members continue to set their own intellectual-property, land-use and immigration policies.

The rules regarding the free movement of “skilled labor” provide a good illustration of the AEC’s limitations. Under its mutual-recognition arrangements (MRAs), certain professional qualifications from any member are deemed valid in all the others, allowing holders of them to work throughout the region. But the AEC’s MRAs cover only eight professions, accounting for just 1.5% of ASEAN’s total workforce. Moreover, even in these fields, other domestic regulations inhibit foreign workers. Nursing, for instance, is among the eight professions subject to an MRA, but to work in Thailand nurses still must pass a qualifying exam in Thai. As Mr. Menon points out, this is short-sighted: English-speaking Filipino nurses would be a boon to Thailand’s burgeoning medical-tourism sector.

Knitting South-East Asia together economically sounds appealing, but the political will to make it happen is hard to find. For the moment, ASEAN seems more focused on the letter than the spirit of regional integration.

Global inflation
Low for longer
Inklings of inflation in the rich world are outweighed by downward pressure on prices elsewhere

Jan 2nd 2016 | From the print edition

monitoring inflation

Research-live.com

Research-live.com

EVER since the financial crisis of 2008, forecasters have scanned the horizon for the next big disruption. There are plenty of candidates for 2016. China’s economy, whose might acted as a counterweight to the slump in the rich world in the years after the crisis, is now itself a worry. Other emerging markets, notably Brazil, remain in a deep funk. The sell-off in the high-yield-debt market in December has prompted fears of a broader re-pricing of corporate credit this year.
Yet one worry is absent: financial markets are priced for continued low inflation or “lowflation”.

reality check

A synthetic measure, derived from bond prices, puts expected consumer-price inflation in America in five years’ time at around 1.8%. That translates into an inflation rate of around 1.3% on the price index for personal-consumption expenditure (PCE), the measure on which the Federal Reserve bases its 2% inflation target. Ten-year bond yields are just 2.3% in America, and are below 2% in Britain and below 1% in much of the rest of Europe. The price of an ounce of gold, a common hedge against inflation, has fallen to $1,070, far below its peak in 2011 of $1,900. Yet market expectations are often confounded. Economic recoveries are maturing. Labour markets are tightening. Could inflation be less subdued than expected in 2016?

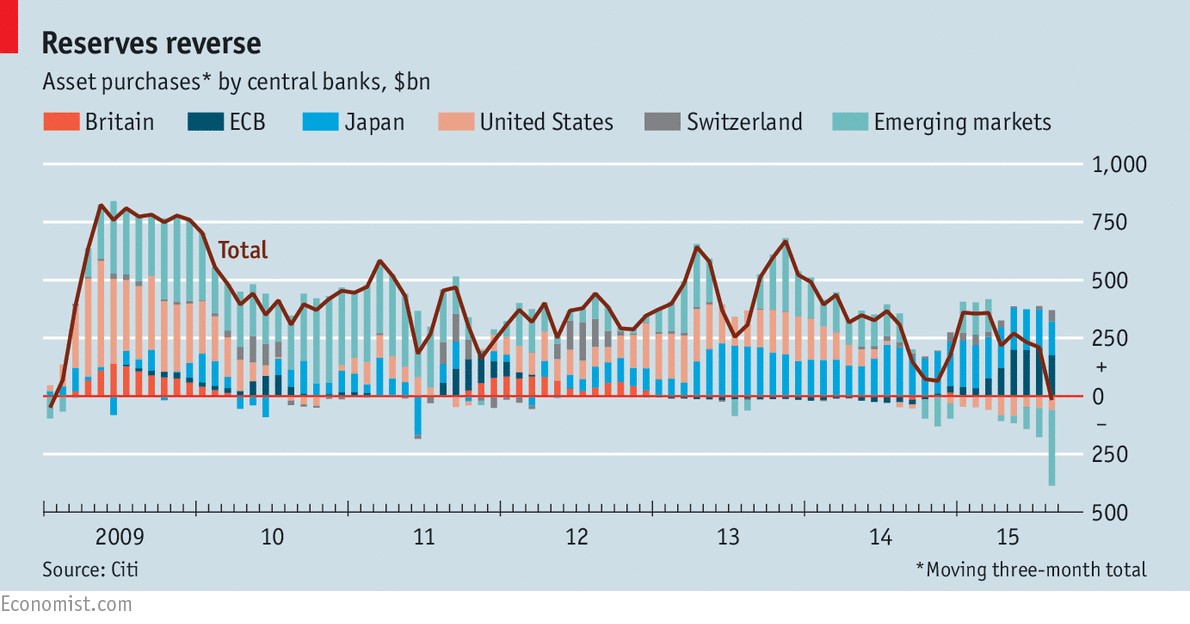
Rich-world inflation is currently depressed because of temporary influences. In America the PCE index rose by just 0.4% year on year in November—but that is in large part because of a sharp fall in consumers’ energy prices in early 2015, which will soon drop out of the annual comparison. The core measure, which excludes food and energy prices, has been stable at 1.3% for months. It might also be somewhat suppressed by the sharp fall in oil prices, which has held down the cost of producing other sorts of goods and services. An analysis by Joseph Lupton of J.P. Morgan finds that core inflation worldwide has crept up to 2.3%, a rate that has rarely been exceeded in the past 15 years. In biggish emerging markets, including Brazil, Russia and Turkey, core inflation is above the central bank’s target (see chart).

A low blow

lowflation

In the view of some, lowflation is a relic of the past. Even the euro zone is recovering from its prolonged recession; the business cycle in other rich economies is more advanced. The debt hangover that has troubled them for almost a decade has faded. Job markets are also a lot tighter than a few years ago, when deflation was a serious concern. Unemployment in America has fallen to 5%, a rate which is close to many estimates of full employment. The jobless rate in Britain is 5.2%. In Germany it is 6.3%. If the recent trend of low productivity growth in these economies continues, bottlenecks in the jobs market will emerge and higher inflation may not be far behind. For instance, if America’s GDP grows by 2.3% in 2016, its recent average, and growth in output per worker also matches its recent sluggish trend, the unemployment rate would decline further, to around 4%, reckons Mr. Lupton. The lower the jobless rate goes, the more likely it is that wages—and eventually inflation—will pick up.

As rich countries were wrestling to reduce their debts, emerging markets went on a credit binge for which the reckoning is just beginning. Debt in China in particular has risen sharply relative to GDP since 2008. Some of the resulting stimulus went into factories, leading to overcapacity and falling global prices for various goods, from steel to solar panels. But a lot of China’s debt went on financing housing and infrastructure, rather than its export capacity. Moreover, the Chinese authorities’ desire to avoid big lurches downwards in the yuan ought to minimize the risk that it exports lowflation to the rest of the world.

Nonetheless, the expectations projected by bond markets—that lowflation will persist—have sound underpinnings. For a start, the price of oil and other commodities does not yet seem to have reached bottom. The price of a barrel of oil fell to an 11-year low of under $36 before Christmas, before rallying a little on hopes of renewed stimulus in China. Saudi Arabia is pumping at close to capacity, in an effort to force out high-cost producers such as America’s shale-oil firms and thus grab a bigger slice of the global market. The strategy has had some success. For instance, the number of oil-rigs operating in America has fallen from around 1,500 a year ago to just 538, according to Baker Hughes, an oil-services firm. But oil production in America remains above 9m barrels a day, and Iran’s exports are likely to increase in 2016, thanks to the lifting of Western sanctions. For the time being, the oil market heavily favors buyers over sellers.

Where inflation can be found in the world, it is not obviously a function of capacity constraints. The biggish economies in which core inflation is above the central bank’s target tend to be commodity exporters that have suffered big falls in their currencies. That, in turn, has stoked domestic inflation. Core inflation is typically well below target in countries that are importers of raw materials. And despite tighter labor markets in rich countries, wages are not rising very fast. That might in part be because of low expectations of inflation.

It seems likely, also, that the debt burden in emerging markets, and the slower growth that usually comes after a credit binge, will bear down on global prices for a while. Even if China’s spare capacity is not fully exportable, plenty of other emerging markets have built mines and factories in expectation of higher Chinese growth that will now prove redundant. As nervous investors creep back to the comparative safety of developed markets, the upward pressure on big currencies, notably the dollar, will increase—adding to downward pressure on local prices.

As was the case in the late 1990s, rich-world policymakers will find that they have to keep their domestic economies primed with low interest rates to offset disinflation from abroad. The strong dollar has already caused a split in American industry between strong services and weaker manufacturing. Lopsided economies may prove as hard for policymakers to steer as deleveraging ones.
Buttonwood

Tales of the unexpected
Five potential surprises for 2016

Sustainable Brands Hanna Furlong

Sustainable Brands Hanna Furlong

INVESTORS often start the calendar year in a buoyant mood, only to be caught out by unexpected events. It is almost inevitable that the consensus will be proved wrong in some respects, not least because the views of most investors will already be reflected in market prices.

So this column would like to suggest five potential surprises for 2016. The definition of a surprise is something that the consensus (as judged by betting sites or polls of fund managers) does not expect.

The first surprise may be that the dollar weakens, not strengthens. The consensus view is that the Federal Reserve, having pushed up rates before Christmas, will tighten monetary policy two or three more times in 2016. Higher rates will make investors eager to buy the dollar, especially as both the European Central Bank and the Bank of Japan will keep their rates near zero. However, the dollar has already had a very good run, so higher rates may already be priced into the currency. As it is, investors seem to doubt that the Fed will tighten as much as the central bank currently projects. The actual outcome may be feebler still.

The second surprise may be too familiar to deserve the name. Commentators have been calling an end to the bull market in government bonds for many years now, and the pundits are expecting much the same in 2016. But persistently low inflation and the support of central banks have kept yields low to date, and may keep doing so. It is all reminiscent of Japan: since 2000, so many investors have failed to profit from betting on higher Japanese yields that the trade is known as the “widowmaker”. In the developed world, pension funds, insurers and retired workers are all eager buyers of fixed-income assets. Perhaps bond yields will edge higher in 2016, but not by very much.
These two surprises may have a common cause: the failure of the global economy to grow as rapidly as some hope. In turn, economic sluggishness seems likely to drive voter discontent. And that may lead to the third and fourth surprises.

Third Surprise American political risk could dog the markets in late 2016. At the start of 2015, investors probably anticipated a dynastic clash between Jeb Bush and Hillary Clinton. But the Republican candidate seems more likely to be either Donald Trump or Ted Cruz. The former has argued for a ban on Muslims coming to America and a wall on the southern border; the latter’s proposals include a flat income tax, a sales tax and a monetary system linked to gold. Although Mrs. Clinton would be the favorite in a race against either man, she is a flawed candidate, mistrusted by many voters. The prospect of a Cruz or Trump presidency would lead to considerable uncertainty in the markets: should either man be elected, would they try to stick to their campaign pledges and would Congress let them? Indeed, this uncertainty might be another reason why the dollar may struggle in 2016.

Fourth surprise. Political risk might also be a problem in Britain, which is likely to hold a referendum on leaving the European Union in 2016. It is widely assumed that Britons will vote for the status quo: that outcome has a 78% probability on the PredictIt website. But opinion polls show that the “remain” and “leave” camps are almost deadlocked and the press is fairly Eurosceptic. Voters might use the referendum as a means of protesting against high levels of immigration, which the government has promised, but failed, to reduce.
If Britain votes for exit, there will be much uncertainty about the country’s attractiveness to foreign investors. Scottish voters are much more pro-EU than English ones, and Brexit would prompt calls for a second independence referendum so Scotland could stay in the single market. David Cameron, Britain’s prime minister, would surely have to resign if his referendum gamble backfired. All this might be good reason to sell the pound.

The final surprise might be more benign: emerging markets could perform rather better than investors expect. A poll of fund managers in December by Bank of America-Merrill Lynch found that pessimists on emerging markets outnumbered optimists by 27 percentage points. There is plenty of bad news: China’s slowdown, falling commodity prices and recessions in Brazil and Russia, for example. But this may have been built into prices; the MSCI emerging-market index has fallen by 20% over the past six years while the S&P 500 index is up by 40% (see chart). It may be time for a rebound.

emerging markets
Not all of these surprises will come to pass, of course. But it seems likely that at least one or two will. Predicting which ones may mark the difference between success and failure for investors in 2016.

Economist.com/blogs/buttonwood

An unsettling year for the markets
The outlook is exceptionally cloudy

Philip Coggan
Mon Nov 02 2015
Finance

cloudy forecasts

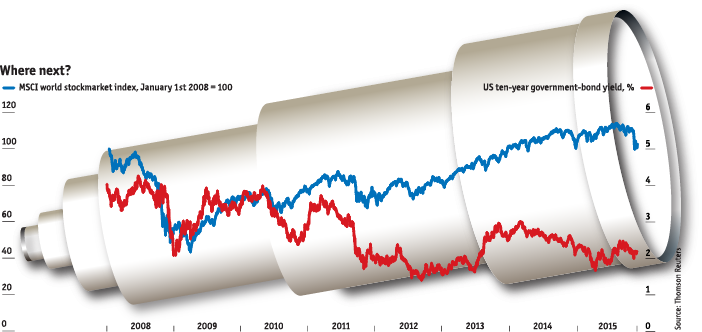
Investors face every new year with uncertainty. But the outlook for 2016 is especially hard to fathom because of two key questions: will the slowdown in the Chinese and other emerging economies continue? And how far will the Federal Reserve (perhaps the Bank of England) move to tighten monetary policy?

The pattern in recent years has been for investors to start the year in optimistic mode about the outlook for economic growth and corporate profits, only to temper their enthusiasm over the summer. But this time is different. Moody’s, a ratings agency, has reduced its GDP-growth estimate for G20 economies in 2016 from 3.1% to 2.8%. Global trade has been disappointing: volumes fell in the first half of 2015 for the first time since 2009.

where next

Since the financial crisis, investors have seen weak economic data as providing a good excuse for central banks to ease policy. That might be a bit much to expect from the Fed in 2016, but investors will be happy if any interest-rate increases are few and far between. The European Central Bank and the Bank of Japan still seem committed to monetary expansion. But the big hope is that China will respond to its slowdown with some policy stimulus, a move that would give a big fillip to other emerging markets, particularly commodity producers.

Equity markets in the developed world have benefited from low interest rates (which have steered investors out of cash and into risky assets) and from healthy profit margins, thanks to subdued wage pressure. But with American unemployment having fallen significantly, real wages are rising because of subdued inflation. And slowing emerging markets mean that companies cannot count on a bounce in global demand to keep profits motoring.

The waiting game

The-waiting-game

Bond investors must feel as though they are in a state of suspended animation. Every year, most commentators predict that the era of low yields is bound to end, because of a pick-up in growth and inflation, or a change in monetary policy. But the big sell-off has never really occurred; in 2015 quite a few European government-bond markets even had negative yields for a while. The default rate on corporate bonds remains low by historical standards and companies have managed to lock in low rates, easing the strain on their finances. Until inflation surges again, it is hard to see why bonds should sell off, and falling commodity prices and weak growth mean global inflation is likely to stay subdued. (Poorly run countries like Russia and Venezuela are exceptions.)

For commodities, the news has been so bad that the mood must change at some point. Investors have become convinced that the “supercycle” is in the down phase; abundant supply is overwhelming stagnant demand. Oil is the obvious example: Saudi Arabia’s attempt to put American frackers out of business in 2015 didn’t seem to work, and in 2016 production from post-sanctions Iran will be hitting the market. However, a lot of bad news may now be priced in.

Economic and profit fundamentals are not, of course, the only factors that could affect investment decisions in 2016; politics may come into play. The Greek crisis rattled markets for months in 2015. The big political event of 2016 will be the American presidential election. Investors will be sanguine about the outcome of a Bush-Clinton contest but will get nervous if the alternatives are Bernie Sanders and Donald Trump. British investors will get twitchy in anticipation of the country’s referendum on EU membership

The final cause of uncertainty may be market liquidity. For regulatory reasons, banks are no longer playing as big a role in market-making as they used to. The sell-off in August 2015 indicated that prices can crater for a while, with investors unwilling to hunt for bargains. The occasional “flash crash” is one thing; if they happen every month, investors might start to find zero returns on cash more attractive than before.

Philip Coggan
Buttonwood columnist, The Economist

Economic milestones of the year ahead

Jan 1st 2016, 13:46 by The Data Team

crowdfundingcross checking

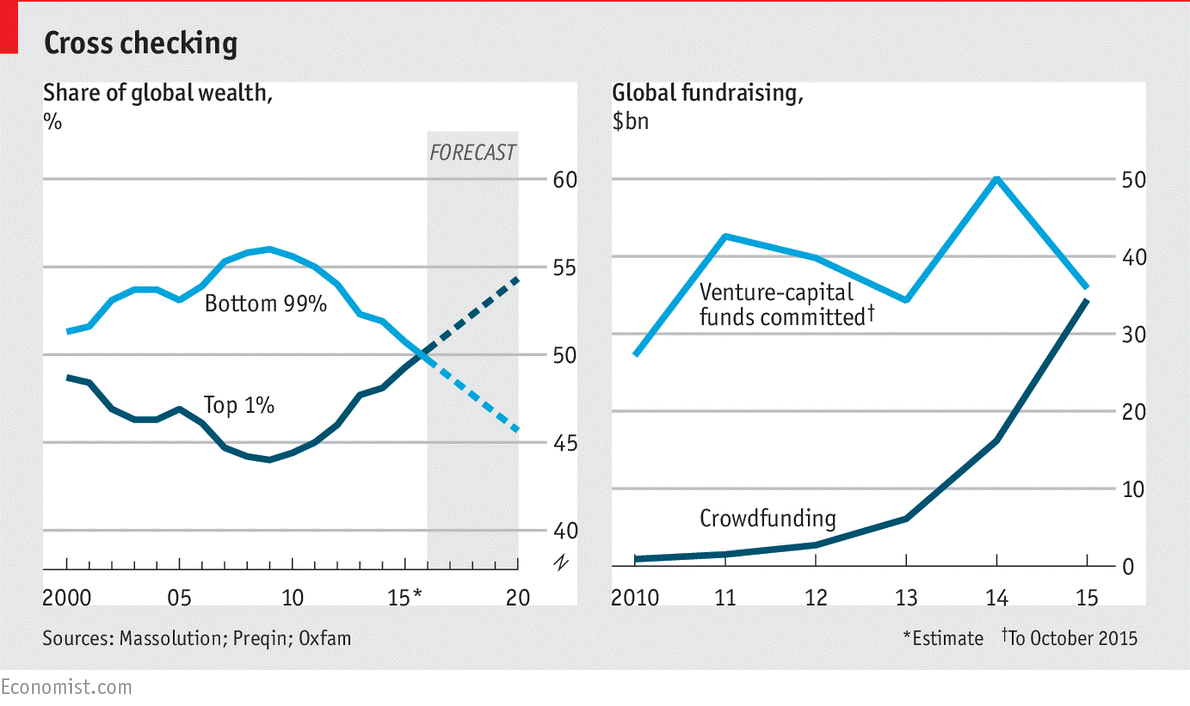
A NUMBER of economic trends that have been simmering for years will come to full boil in 2016—and result in some striking statistics. One example is in wealth inequality. The share of wealth of the richest 1% of the world’s population will, according to Oxfam, exceed that of the remaining 99% of people. Yet there is also some good news for ordinary folk: in at least one respect private investing is becoming more democratic. The amount of global crowdfunding investment is expected to reach $34 billion in 2015, and in 2016 will surpass the annual money committed by investors to venture-capital funds globally.

GDP forecasts
The fastest shrinking and growing economies in 2016

WORLD GDP is forecast to grow by 2.7% in 2016, according to the Economist Intelligence Unit (in 2015 the economy is estimated to have expanded by 2.4%). This moderate outlook reflects the fact growth is still lack-lustre in the euro area, Japan and emerging market economies as a whole.

The picture is particularly gloomy for commodity-exporting nations such as Venezuela, which is in deep economic recession. The outlook for Brazil is far from positive too, where falling oil prices combined with the implications of the Petrobras scandal will affect investment in oil and gas. War-torn countries also feature in the projected worst performers of 2016. Libya’s GDP has been contracting since 2013; continued conflict and political uncertainty means that it will continue to shrink this year.

drnk me eat me

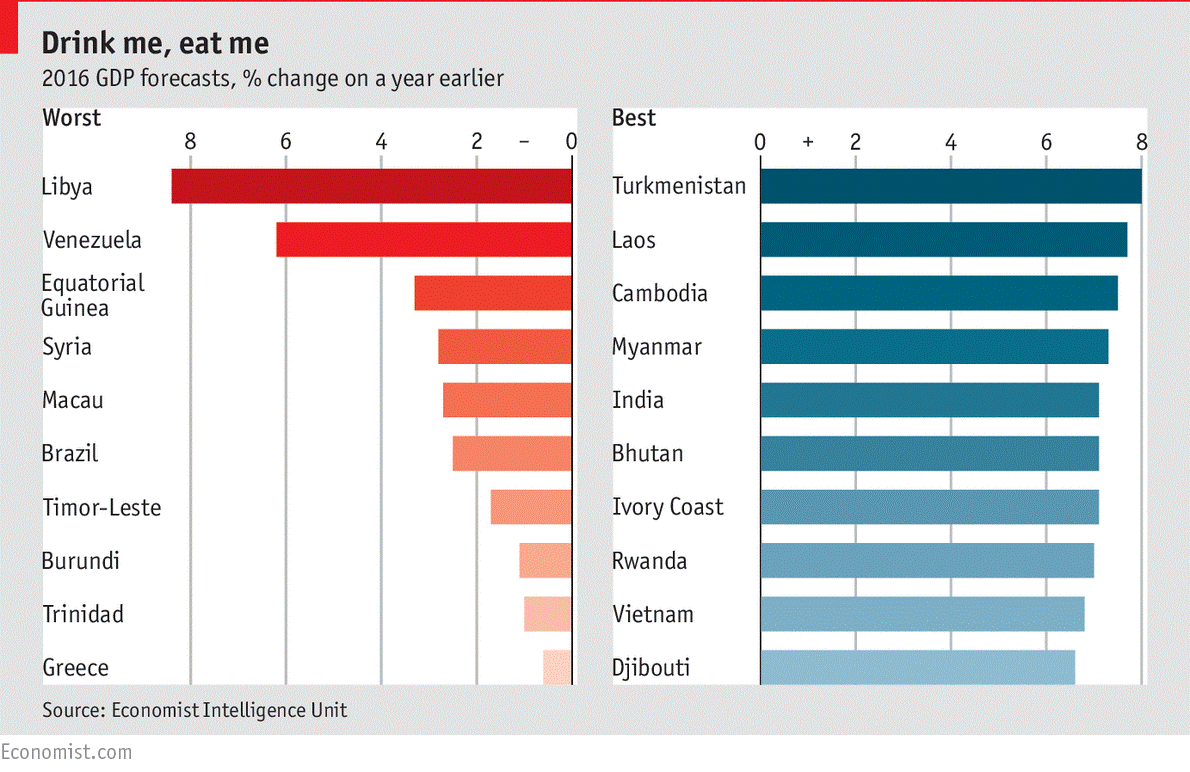
There are a few bright spots however. Although GDP growth in Turkmenistan is slowing, the construction of a new branch of the Central Asia-China gas pipeline should help to support exports. A scattering of emerging Asian countries make a notable appearance in the top-ten: growth in the region is buoyed by rising private consumption, and in particular a revitalized tourism sector in Laos.

Asia-Pacific Report: China has challenges ahead to make economy more efficient

By Chuck Chiang, Vancouver Sun January 3, 2016

confused chinese

Stock market instability was a major economic news story in China this past year.
For much of the past decade, a good portion of global trade and investment — and arguably the majority of trade in the Asia-Pacific — centred on the rapid growth of China’s economy, now the world’s second-largest.

With the stock market upheavals, currency fluctuations and moderating growth indicators in 2015, however, there are signs that the Chinese economy may be entering a “new normal” for 2016.
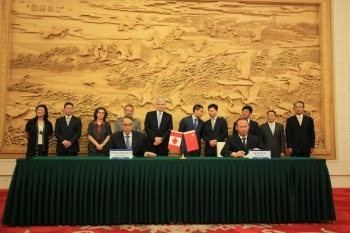
What changes are coming? Economies like Canada, whose exports to China reached $18.9 billion this year while imports hit $58.7 billion, are keeping a close eye.

In an analysis published by crowdsourcing consultancy Wikistrat , Asia Pacific Foundation senior fellow and seasoned Canadian ex-diplomat Hugh Stephens argues that Beijing’s economic challenges will likely mean further structural reforms in the way it attracts investment, as well as dealing with the performance of state-owned enterprises in the global market.

Stephens, a 35-year veteran in global trade and business management affairs, said some of Beijing’s reforms in the coming year may be unexpected, but are necessary to boost the country’s economy as targeted annual growth rests at 6.5 per cent for 2016, significantly lower than years past when double-digit figures where the norm. The efficiency of state-owned enterprises, he said, will likely be front and centre.

“The track record of Chinese overseas investment through state-owned enterprises has been less than stellar,” Stephens said. “Bad bets have been taken on a number of investments, (return on investment) has been disappointing, and corruption charges have been pursued against a number of senior state-owned enterprise executives.”

Canadians are most familiar with Chinese state businesses such as energy giant CNOOC, which paid $15.1 billion for Calgary-based Nexen in 2012 (in a deal that prompted Ottawa to close the door on controlling interest in Alberta’s oil sands projects to Chinese companies).

While the current slump in crude prices is the main culprit, Nexen has underperformed since becoming part of CNOOC’s portfolio. A Wall Street Journal report in July noted its Long Lake oil sands operation’s production reached 50,000 barrels per day, about 22,000 barrels below the planned capacity.

Stephens argued that Beijing should look to imbue its state-owned enterprises with more say in how it should operate, rather than reining them in, in order to have them succeed globally.

“China could do more of the same in terms of retrenchment/hunkering down and trying to clean up management,” he said. “Alternately, it can follow words with action and release the grip of the state on (these companies) and allow them greater flexibility to operate more like private companies, making market-based risk assessments rather than being ultimately governed by political considerations.”

Stephens also thinks China will pursue bilateral investment treaties with the United States and Europe. An investment protection agreement between Canada and China went into effect in late 2014, and similar deals with the U.S. and the EU will nudge China toward “eventual readiness to take on (Trans-Pacific Partnership)-type obligations in the future.”

It would also send a signal that Beijing, Stephens said, is ready to move toward “a more market-oriented economy” that would help China transition through its current slowdown.

chchiang@postmedia.com
© Copyright (c) The Vancouver Sun

Liberal economists
Three wise men

Wu Jinglian (left), Mao Yushi (center), Li Yining (right)

WuJinglian_s Mao Yushi li_yining

Ageing reformists diagnose the economy’s ills
Jan 9th 2016 | SHANGHAI | From the print edition

WHATEVER image you may have of the reformists hoping to shake up China’s creaking economic system, it is probably not one of octogenarians who fiddle with their hearing aids and take afternoon naps. But that is a fair description of three of the country’s loudest voices for change: Mr. Market, Mr. Shareholding and the most radical of all, the liberal. With growth slowing, the stock market once again in trouble and financial risks looking more ominous, their diagnoses of the economy, born of decades of experience, are sobering.

Wu Jinglian, Li Yining and Mao Yushi—their real names—were born within two years of each other in 1929 and 1930 in Nanjing, then China’s capital. Whether it was that or pure coincidence, all three grew up to demand an end to Soviet-style central planning and to propose, to varying degrees, capitalism in its place. Their influence has waned with age, but their powers of analysis remain sharp. And they do not much like what they see.

Mr. Wu is in some ways the most important of the group. He advised the government from the earliest years of China’s “reform and opening” in the 1980s, through the 1990s when the great China boom got under way (see timeline). He proposed that the Communist Party should declare China a “socialist market economy”, a twist of words (and a hugely controversial one—conservatives abhorred any positive mention of markets) that opened the door to private enterprise.

But Mr. Market, as he came to be called, thinks this kind of linguistic ruse has outlived its usefulness. Imprecise concepts have led to flawed actions, he warns. Though the private sector has flourished over the past couple of decades, the state still looms large, controlling financial flows and acting as gatekeeper for virtually all important decisions, from land deals to mergers. “Even a low-level bureaucrat can decide the life or death of a company. You need to listen to the party,” says Mr Wu, who now teaches at the China Europe International Business School in Beijing.

Mr. Wu notes contradictions in the official blueprint for reforming state-owned firms. The party promises to empower their boards, but still wants to retain authority over the appointment of top executives. “If you can’t solve this problem, it will be very difficult to develop effective corporate governance,” he says. Mr. Wu argues that political change is now needed to shore up the economy: the government must stop meddling in markets and instead focus on developing the rule of law. Holding up a copy of his recent book, he chuckles softly. “All my ideas are in here. No one pays them much attention.”

Getting heard is less of a problem these days for Li Yining, who has spent his entire academic career at Peking University. His former pupils include Li Keqiang, China’s prime minister. His big idea in the 1980s was that selling partial stakes in state-owned companies to the public would improve their performance—hence his nickname, Mr. Shareholding. The party eventually took his advice, though the companies remain hugely inefficient.

In diagnosing the problems of today, Li Yining is blunt: the previous few years of ultra-high-speed growth “did not accord with economic laws”. China wasted natural resources, damaged its environment, piled up excess capacity and missed opportunities to fix its economic model. Yet perhaps because of his connections to those in power, Mr. Li is by far the most sanguine of the old guard of reformers. “The new normal”—President Xi Jinping’s favorite economic slogan—is shifting the economy in the right direction, by aiming for lower growth and structural changes.

beijing traffic

China’s growth is slowing. A detailed look at what is behind the slowdown

Mao Yushi disagrees. And unlike many economists cowed by a frostier political climate, he is unafraid to say so. Mr. Mao started his career in the railway system, including a spell driving trains, before retraining as an economist in the 1970s. Always on the margins of Chinese academia, he founded the Beijing-based Unirule Institute of Economics in 1993, an independent think-tank. He champions deregulation and courts controversy in his criticism of Mao Zedong’s disastrous rule. Some diehard Maoists call the softly spoken economist “Mao Yu-shit” online, playing on a homonym of his name.

In Mr. Mao’s view it is already too late for the economy. China has too many empty homes and its banks have too much bad debt. “A crisis cannot be averted,” he says. Mr. Mao allows himself some optimism, however. The young generation is educated and open-minded. The waste of capital and resources of recent years implies that China still has good potential for growth, if it can operate more efficiently. But he believes that Mr. Xi, while espousing reform, is strengthening the state’s economic grip. “He has the power and the determination to fix problems, but in many cases he does not properly understand the problems,” says Mr. Mao.

Such unvarnished, open criticism of Mr. Xi is rare in China these days. Speaking in the living room of his apartment, its walls stacked high with books and yellowing newspapers, Mr. Mao says that his age and experience give him, and the other elderly reformists, a bit of leeway. “If it was someone else speaking, they would probably be arrested. But to me, the government is polite.” If only it would pay more heed to the elders’ advice, too.

Big mac index

Track global exchange rates over time with The Economist’s Big Mac currency index

MIGHT “Made in Russia” labels become common? If currency depreciation alone could boost exports, then yes. According to our latest Big Mac index, the Russian rouble is one of the cheapest currencies around, 69% undervalued against the dollar. The index compares the cost of the famous burger at McDonalds outlets in different countries by converting local prices into dollars using market exchange rates (as of January 6th). It is based on the idea that in the long-run, exchange rates ought to adjust so that one dollar buys the same amount everywhere. If a burger looks like a bargain in one currency, that currency could be undervalued.

big mac

These large currency devaluations can hurt, by raising the price of imports and spurring inflation. But although devaluations may not be pleasant, they are meant to be nutritious. Pricier imports should encourage consumers to switch towards domestic products and stimulate local production. A cheaper currency should also boost growth by spurring exports.

Between 1980 and 2014, according to an analysis of 60 economies by the IMF, a 10% depreciation relative to the currencies of trading partners boosted net exports by 1.5% of GDP over the long term, on average. Most of the improvement came within the first year.

But devaluations do not seem to have provided quite the same boost recently. Japan is the best example. The yen has been depreciating rapidly. A Big Mac was 20% cheaper in Japan than in America in 2013; now it is 37% cheaper. Yet export volumes have barely budged. This is a surprise: the IMF calculates that Japanese exports are around 20% lower than it would have expected, given how the yen has weakened. Devaluations in other countries, including South Africa and Turkey, have also disappointed.

A global contraction of trade in dollar terms may be obscuring devaluation’s benefits. Although exports from countries with weakening currencies may look limp, many of them are still securing a bigger slice of the shrinking pie. The collapse in commodity prices is also masking some signs of life. Take Brazil, where the volume of exports rose by 10% in 2015 even as their value plunged by 22%. Some of that is caused by commodity exporters compensating for falling revenue by selling ever more minerals and oil. But not all of it. In Australia, for instance, exports of goods other than raw materials jumped by around 6% in mid-2015, according to the Commonwealth Bank of Australia.

uncompetitive devaluation
But there are also signs that “Dutch disease” has taken a toll on the capacity of commodity-producing countries to ramp up other exports. When prices were high, capital flowed in, pushing up their currencies and thus making their other exports less competitive. Labour and investment flowed mainly to commodity firms. That has left other industries too weak to pick up the slack now that these once-soaring currencies have fallen back to earth.

Russia is a good example. Non-energy exporters appear to be struggling despite the rouble’s plunge. Over the first half of 2015, as the volume of energy exports surged, non-energy exports fell, according to Birgit Hansl of the World Bank. She points out that it is not enough to have a price change: “First you have to produce something that someone wants to buy.” The ruble’s weakness is an opportunity for industries that already export, such as chemicals and fertiliser. But boosting other exports requires investment in new production, which takes time.

Both the IMF and the World Bank have highlighted another possible explanation for the weak performance of exports in countries with falling currencies: the prevalence of global supply chains. Globalization has turned lots of countries into way-stations in the manufacture of individual products. Components are imported, augmented and re-exported. This means that much of what a country gains through a devaluation in terms of the competitiveness of its exports, it loses through pricier imports. The IMF thinks this accounts for much of the sluggishness of Japan’s exports; the World Bank argues that it explains about 40% of the diminished impact of devaluations globally. That leaves many manufacturing economies in a pickle.

VIETNAM

vietnam wood

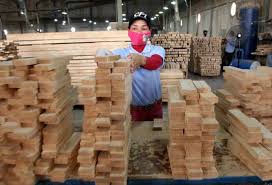
Vietnam’s wood industry is expected to gain a total export value of wood and wooden products of US$7.7 billion for this year, higher than $7.1 billion in 2015. According to the Vietnam Wood and Forestry Products Association (Viforest), exports of wood and forestry products from Vietnam will have the advantage of starting operations through the ASEAN Economic Community (AEC) and the Trans Pacific Partnership (TPP) deal.
Local enterprises have done good business with ASEAN partners for many years so the AEC will create favourable conditions for them to develop further business incoming time.
Meanwhile, TPP will also usher in opportunities for the domestic wooden product makers to have more legal wooden material for export processing because the TPP member countries have great potential for high quality wooden materials with legal origins, according to Nguyen Ton Quyen, chairman of Viforest.

That will create more opportunities for Vietnamese manufacturers to export their products to the European Union (EU) and the United States (US) where there is a high demand for licensed wooden products.

In 2015, Vietnam achieved total export value of wooden and forestry products at $7.1 billion, 8 per ent higher than 2014, according to the Ministry of Agriculture and Rural Development.
The three largest export markets of Vietnamese wooden products are the US, Japan and China, accounting for 67 per cent of the total export value.

Last year, there were many export markets of Vietnamese wooden products with high export value such as India with a growth rate at 64.45 per cent, Hong Kong with rate at 41.95 per cent, the US at 17.8 per cent and Germany at 10 per cent.
Quyen said the export value increase was due to high demand in the world market in 2015, the Thoi bao Kinh doanh newspaper reported.

For instance, the US market needs to import wooden products worth $27 billion per year while Vietnam exported wooden products between $1 billion and $2 billion per year. The EU market has a demand for wooden products worth $85 billion but Viet Nam’s export value to the EU reaches only between $700 million and $800 million per year.

Moreover, Vietnam’s wooden products had high competitive ability and a reputation on the world market. Therefore, Vietnamese enterprises would have numerous opportunities to export their wooden products to those markets, he said.

Fordaq

7 things that could go horribly wrong in 2016: Don Pittis
Forewarned is forearmed as we take a gloomy look around the world

By Don Pittis, CBC News Posted: Dec 31, 2015 5:00 AM ET Last Updated: Dec 31, 2015 1:24 PM ET

beggar

A beggar kneels in front of an advertising billboard in the centre of Vienna in November. If world economies weaken in 2016 it will become harder to narrow the gap between rich and poor. (Reuters)

Earlier during this holiday season I offered an optimistic view for the coming year that we would be possessed by animal spirits, making 2016 a boom year for growth and exports.
But a scan of financial stories looking to the year ahead shows there is a lot of pessimism out there as well. Here is a selection of some of the gloomier predictions of what could go wrong with the economy.

1. China crash
A perennial cause for worry, China’s economy has been so strong for so long, there always seem to be perfectly good reasons why everything could go terribly wrong.
In 2015 there were many new warnings, but an especially strong one from the Jim Cramer organ TheStreet.com says the middle kingdom faces a “sudden stop” in its economy.

A failing currency, a shrinking real economy, a real estate bubble, industrial overcapacity, say the worriers, all mean the Year of the Fire Monkey in the Chinese zodiac could spell doom for what is by some measures the world’s largest economy.

2. Emerging-market bankruptcy
International Monetary Fund boss Christine Lagarde has been warning for months what would happen to an unstable developing world if the U.S. began raising rates.
Convinced by global hype that BRIC countries were the future, companies and countries over-borrowed, leaving many with a giant hangover.
The Economist magazine says Brazil faces “political and economic disaster,” Russia has been hammered by falling oil prices, and China worries are mentioned above. That leaves India as the final BRIC success story. Can it last?

3. Oil to $20
There are few better indicators of global overcapacity than cheap oil.
But rather that scaling back on output, there are worries that new production from Iran could increase the glut just as a slumping developing-world economy cuts demand. Meanwhile, Saudi Arabia is cutting back on expenditures, saying it will pump cheap crude till other world producers cry uncle.
New York bankers Goldman Sachs say oil could fall below $20 a barrel in 2016.

4. Markets melt down
If oil and commodities continue their plunge in 2016, low prices could eventually cause serious damage to oil producers and mining companies that can’t be solved by layoffs.
There are distinct worries that the troubles of resource companies could be passed on to banks. Junk bonds and ETF markets are also a source of concern.

Janet Yellen, chair of the U.S. Federal Reserve, looks toward Thomas Perez, U.S. secretary of labor. Yellen has warned there is a 10 per cent chance of an economic shock that could drive the U.S. recovery off course. (Andrew Harrer/Bloomberg)
Any one of those things could represent the “10 per cent chance” of an unexpected economic shock that U.S. Federal Reserve chair Janet Yellen warned about in her last policy presentation.

5. Escalating global conflict
This is obviously not just an economic concern. In fact, an escalation of hot war could be an instant solution to the commodities glut.
As usual, the most frightening danger could come from an overwrought, unstable leadership such as those in North Korea or Pakistan popping a nuke at a hated enemy.
But according to The Atlantic Magazine, there are plenty of chances for expanding conflict. And that list only includes those that would directly affect the United States.

6. Canadian property crash
Other evergreen sources of doom and gloom in the Canadian economy are the overheated property market and record levels of consumer borrowing.
This week even the Globe and Mail, which is usually reluctant to be gloomy about real estate, warned that Canadian property may have “finally met its Waterloo” in 2016.
A combination of tighter mortgage rules, rising U.S. interest rates and crashing resource prices may conspire to slow the Canadian real estate rocket.
The question remains: Can, as optimists hope, the rocket stop and hover at the top of its trajectory, or must it reverse course?

7. U.S. failed takeoff
One of the only true bright spots in the global economy is a steady recovery in the U.S. In her most recent media outing Yellen said the U.S. domestic economy was on the upswing despite sagging exports.

But with everyone else from Europe to China to Brazil to Canada running on slow, can the U.S. pull itself up by its bootstraps? That may be difficult, especially when its currency is surging to new highs.

Without growth, the global spread between rich and poor will likely worsen. Continued U.S. weakness might be a short-term palliative for Canadian property prices, but without America to pull us all out of the long-term morass, we are more likely to stay there.

don't worry be happy


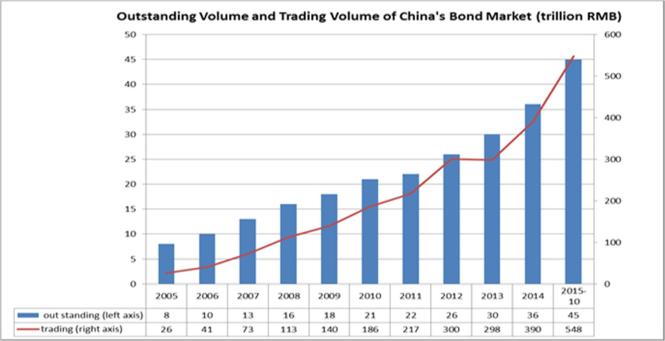
Why China’s Hefty Trade Surplus Is Dwarfed by Outflows
No wonder the yuan is under pressure: It appears capital outflow in 2015 came to around $750 billion

Aaron Back
The Wall Street Journal
Updated Jan. 13, 2016 12:15 a.m. ET

china's anual trade surplus
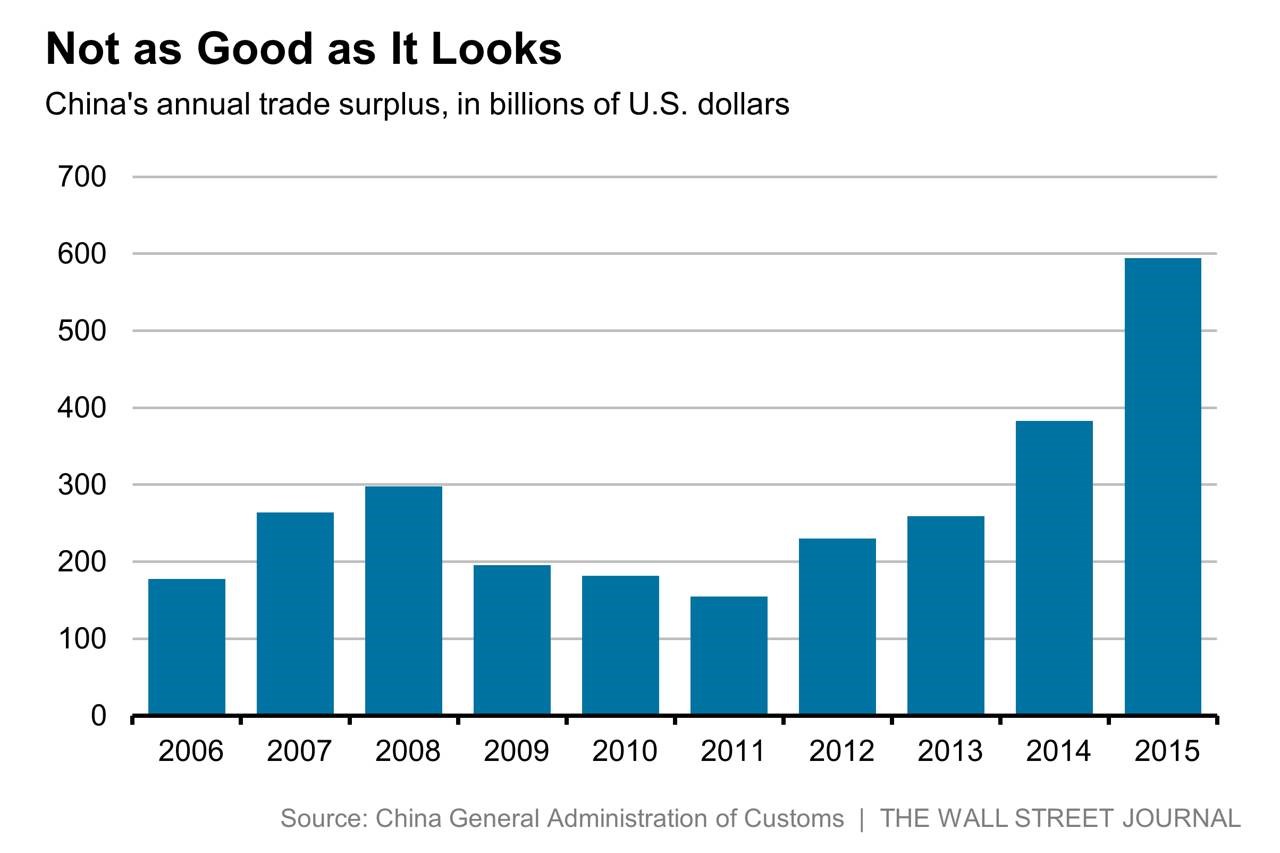
China’s fat trade surplus should be a source of comfort. But juxtaposed against falling reserves, it actually sends an alarming message about the degree of capital flight.
The surplus swelled by 55% in 2015, to $595 billion, figures released Wednesday showed. This news isn’t as good as looks. For one, it doesn’t reflect a boom in exports, which for the full year actually fell by 2.8%. The surplus widened because imports fell even more, by 14.1%.

Moreover, it raises a question: How did China manage to post a decline of $513 billion in foreign-exchange reserves last year? Since a trade surplus brings foreign currency into the country, and most exporters turn that currency over to the central bank, it should boost reserves by a corresponding amount. That reserves fell suggests fund outflows large enough to overwhelm even that trade surplus.

To get a full picture, more variables must be accounted for. Full-year data isn’t yet available for China’s foreign direct investment, overseas direct investment and services trade deficit. But based on numbers currently available, and adding the trade surplus, a rough estimate of total net inflows from trade and direct investment in 2015 comes to about $379 billion.

dock crane

There’s a dark side to the trade surplus. Photo: china daily/Reuters

This must be compared with the fall in reserves. In fairness, this decline was exaggerated by the stronger dollar, which makes China’s holdings in other currencies less valuable when they are reported in dollar terms. Taking these valuation effects into account, and based on estimates of the composition of its mostly secret portfolio, China may have sold a net $375 billion of reserves in 2015.

Putting these two figures together, it appears that there was roughly $750 billion of capital outflow in 2015. No wonder the currency is under pressure.

Write to Aaron Back at aaron.back@wsj.com
9:22 pm ET
Jan 12, 2016

Will the Pacific Trade Pact Really Put Pressure on China?

• By William Mauldin

container trucks

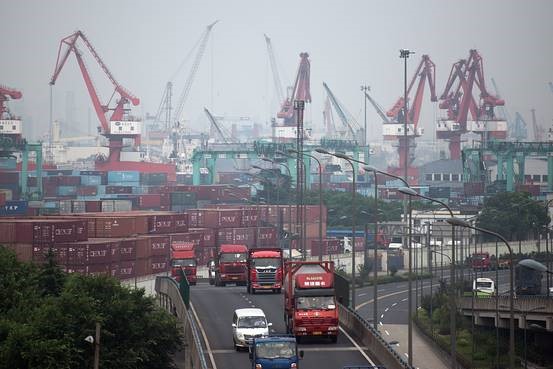
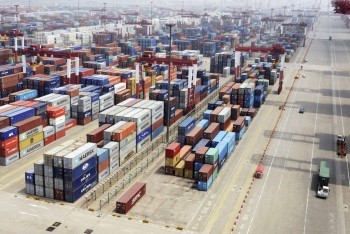
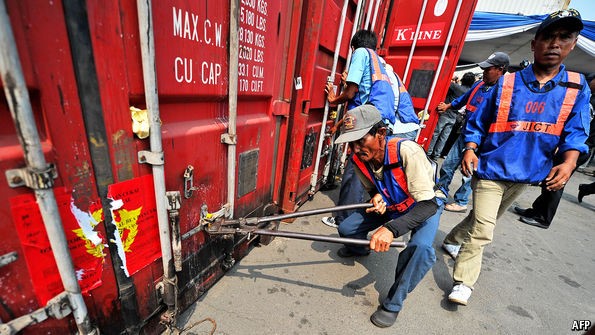
Container trucks leave the Port of Shanghai in August.

A recent World Bank study says China would see a tiny increase in trade and a “really negligible” reduction in GDP by 2030 due to its exclusion from the Pacific trade deal. JOHANNES EISELE/AFP/GETTY IMAGES

President Barack Obama, Donald Trump, and Sen. Rand Paul don’t agree on much.
So it’s not a surprise that each is espousing totally different views on how a big Pacific trading agreement will affect China, which is not a member of the trade bloc. And as it turns out, each can claim support from experts and economists.

Mr. Obama on Tuesday told members of Congress they should vote for the Trans-Pacific Partnership trade agreement because it will ensure that Washington’s commercial rules of the road become the norm in the Pacific, rather than China’s. “With TPP, China doesn’t set the rules in that region—we do,” Mr. Obama said in the State of the Union address, revisiting an argument he aired during his 2015 address, before the TPP was concluded in October.

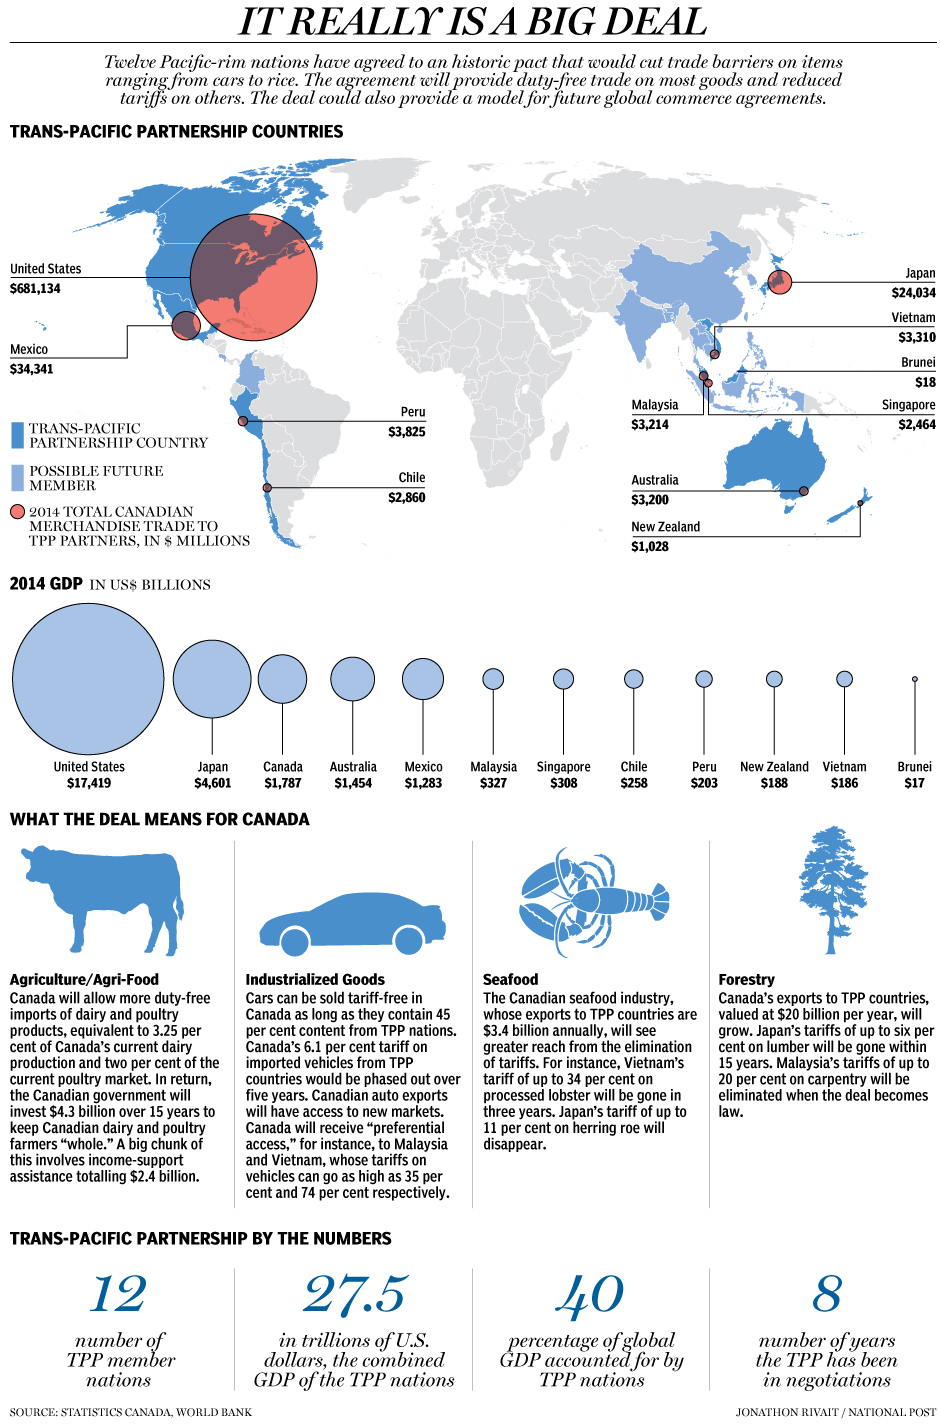
The 12 nations agreed to a deal that, if implemented, would not only reduce or eliminate tariffs but rein in the advantages of state-owned enterprises and impose binding environmental standards.

Even though Beijing isn’t part of the deal, Obama administration officials say the rules will still challenge China to reform its economy in other ways. The TPP, endorsed by many former military officers, would also boost Washington’s ties with its allies in the region a time when China is flexing its economic and military muscles.

Mr. Trump disagrees. “It’s a deal that was designed for China to come in, as they always do, through the back door and totally take advantage of everyone,” the billionaire GOP candidate said at the fourth GOP presidential debate, in November.

Mr. Trump’s warning echoes criticism from labor unions and Democrats from auto-producing states in the Midwest. They point to the “rules of origin” in the TPP that allow much of the content of cars and other products traded duty-free to come from outside the bloc—including China.

This week Public Citizen, a consumer-watchdog group, poked fun at the Obamas for inviting an American honey producer to attend Tuesday’s speech as a symbol of how the TPP can open up markets like Japan through lower tariffs. In trade circles, “honey laundering” is a symbol of how some imported Chinese products avoid U.S. tariffs by shipping through a third country, such as Malaysia—a TPP member.

Still, some politicians, such as Mr. Paul, seem to think all the talk about China misses the point. “You know, we might want to point out China is not part of this deal,” Mr. Paul said in a pointed response to Mr. Trump during the November debate. The Kentucky senator opposed legislation designed to expedite the TPP because he believes Congress, rather than the Obama administration, should be designing trade policy, whether it’s with China, Japan or the European Union.

Some economists are also saying the talk of China is overblown. A study published by the World Bank last week says China would see a tiny increase in trade and a “really


2016: Why India Is the World’s Fastest-Growing Economy

1/13/2016 7:02AM

imf-expects-india-to-retain-worlds-fastest-growing-economy-tag

According to the World Bank’s latest forecasts, India will be the world’s fastest growing economy in 2016, as China slows. Here’s why. Photo: Associated Press

http://www.wsj.com/video/2016-why-india-is-the-world-fastest-growing-economy/FA617B73-1B68-4C81-AF24-67C31D664855.html

Liquidity fears in indexed products have caused jitters this year

Liquidity fears

The next financial crisis will be played out in indexes and exchange traded funds. That is inevitable given the huge share that ETFs now take of investor fund flows, and their popularity as hedge fund trading vehicles.

What is less clear, and deeply controversial, is whether the structure of ETFs will itself contribute to the next crisis, or even cause it. Regulators, worried by past incidents when untested financial innovations helped exacerbate financial crises, are worried that it could.

ETF providers indignantly counter that they make the market more liquid, and less prone to sudden stops. Indeed, they complain that well-intentioned regulations exacerbate a problem they were meant to cure.

The scale of the ETF industry is not in question. They now hold more than $3tn in assets. But this raises the question of whether they have come to lead the market rather than follow it. This operates at two levels. First, there is a concern that the power of the indexes distorts markets over time, and second, there is the possibility that the structure of ETFs and index funds worsens market shocks when they happen.

Indexes’ influence spreads to virtually all institutionally managed funds. Benchmarking by the consultants on whom institutions rely when choosing fund managers is so widespread, that active managers have no choice but to watch the index they are compared to very closely, and are obliged to follow any major changes in its composition.

Examples are easy to come by. When the Russell indices — highly popular among US fund managers — are updated each year, they often drive the heaviest trading of the year. In June this year, Chinese A-shares peaked and began to fall shortly after MSCI, the most important index provider for emerging markets, decided to delay including them in its flagship index. This came as a surprise. Showing the importance of indexers, Chinese authorities had lobbied hard for inclusion, as this would have driven capital into the A-shares market. Many investors at the time said that the subsequent sell-off could in part be attributed to the knock to confidence that came with MSCI’s decision.

Indexers do their best to limit their impact on the market. Russell makes its methodology very public, so investors can see weeks in advance what changes are likely to its indices. MSCI conducts public consultations.

But while indexing and benchmarking remain so prevalent, the problem of overpowerful indexes seems impossible to avoid. It can merely be mitigated. For passive investors, rules for indexes must remain as clear as possible. For active managers, the solution may be to change benchmarking.

Rather than looking at past performance, which does not predict the future, consultants could look at investors’ past behaviour, or rate them on their degree of style discipline. If clients show that they are more interested in highly concentrated funds taking contrarian positions, and not in funds that merely shadow an index, then the industry would adjust to meet the demand, and the systemic problems caused by indexes should reduce.

Then there is the issue of market structure. Two incidents in 2015 raised concern. First, there was August 24, when US share prices gapped downwards at the opening in New York, and ETF prices were not available for a while. Second, in December, a gradual sell-off in high-yield bonds turned into a rout for ETFs holding high-yield bonds.

FT series  Market Shocks 2015

market shocks

Investors experienced plenty of shocks during 2015, the FT looks at the highs and lows including currencies, emerging markets, bonds, equities and commodities

Was this due to liquidity mismatches? It is a fair question. ETFs only offer prices throughout the trading day because market makers trade to ensure that there is no gap between the market price and the underlying price of the securities in the index they track, so this has to be a risk — especially when, as in the case of high-yield bonds, the underlying security is fundamentally less liquid.

There are two theories. One, held by the industry, is that the problems were driven if anything by regulations. Mandatory trading pauses following the 2010 “flash crash” made it harder for ETF managers to get a handle on the underlying price of their securities, and created problems. The other theory: there is indeed a mismatch.

Debate is healthy. The echoes of credit derivatives, which in 2008 helped to turn a serious housing downturn into a near-collapse of the world financial system, are clear enough. Without a major market disruption — and 2015’s turbulence barely ranks compared with the events of 2008 — it is hard to test whether new financial instruments will work as intended when under stress. Better for everyone, including ETF providers, to err on the side of caution.

If it’s the economy, stupid, what can be done?

By Harlan Ullman, Arnaud de Borchgrave Distinguished Columnist | Jan. 18, 2016 at 6:00 AM

SPD Bank China

A big decline in China’s stock markets is affecting global markets. Photo by Stephen Shaver/UPI
If the first 10 days of the New Year are indicative of the economic outlook for 2016, buckle up.
The precipitous decline in China’s stock markets has had dramatic financial and economic effect on global markets. The drop in oil prices to above $30 a barrel earlier this week will bring further turmoil.

So are we seeing the beginning of a global recession possibly as crippling as the 2008 financial meltdown was? Or is this merely a readjustment magnified by China’s economic troubles that will settle out? Strong arguments can be mounted on both sides.

Regarding a recession, here is why global economies may be headed for rough times. The shift in demand and consumption from the developed economies to the BRIC’s — Brazil, Russia, India and China — and emerging markets is considerable, and now accounts for more than 55 percent of the global total, with three of the BRIC in some form of potentially grave economic difficulty.

China’s real estate and market bubbles may burst. As consumer demand decreases, so, too, does Chinese appetite for imports, causing a global slowdown. Currencies are affected. Because of globalization, keeping this malaise from spreading may be impossible. Likewise the decline in the price of oil is doing great damage to the energy industry and obviously the foreign currency reserves of the energy-producing states.

To the degree that price-to-earnings ratios matter, in the United States historically, they averaged 14 -16/1. Today, P/E’s are running much higher, suggesting that stocks are overpriced. Hence, a market adjustment may be greatly accelerated by any economic slowdowns. The conclusion is a very bearish outlook.

Making the opposite case, in the United States, unemployment is running at about 5 percent. Job creation continues at a rapid pace. The economy is still growing, although modestly. Automotive sales set a record last year of more than 17 million. Interest rates remain low, and corporate profits appear sound.

In this analysis, declines in share prices will produce opportunities that can rejuvenate the bourses and stock exchanges, particularly in America where fixed income investments, i.e. bonds, still have relatively low yields in exchange for providing more security for the holders. Besides, over the long term and through depressions and recessions, equities markets ultimately grow and over time provide the larger returns on investment.

But who really knows? Economies and markets evolve, and past experience and history may or may not be relevant. The great 1987 stock market collapse; the bursting of the dot.com bubble in the late 1990s; and the 2007-08 financial crises stemmed from different causes and were resolved by different means, including the passage of time.

For those who regard a recession as the most likely outcome this year, given that monetary policy, i.e. interest rates, offers little positive leverage, fiscal policy, i.e. budgets, greater deficit spending is the way out. This Keynesean approach will increase the national debt that is about 100 percent of annual GDP approaching $20 trillion. However, so this argument goes, as the economy improves, so, too, will the revenue tax base ultimately allowing reducing debt and deficit?

Those who are more bullish are likely to argue that tax cuts and changes on the margin will be sufficient, as the economy is still sound. Time will settle this debate. But common sense argues that it may not be wise to wait. What to do is the issue.

How can the economy be stimulated without increasing the debt, which both deficit spending and tax cuts will do? The answer is remarkably simple: U.S. corporations hold about $1 trillion to $2 trillion in cash outside the United States. That money can be repatriated if there is a valid mechanism.

I have long argued for a national infrastructure bank, including in my latest book, A Handful of Bullets—How the Murder of Archduke Franz Ferdinand Still Menaces the Peace. The nation’s infrastructure is in dire disrepair. These repatriated funds, if invested in this bank, would receive tax relief. The bank would be open to other investors as war bonds once were. Interest payments over, say 30 years of 200 or 250 basis points above prime, would be guaranteed by the federal government and paid for along with the principal from tolls, user fees and the like from these infrastructure projects.

Some $1 trillion or $2 trillion would surely stimulate the economy. Whether that prevents or relieves a recession is moot. However, repair of the infrastructure would, at the least, set this country on a powerful economic footing for the 21st century.
_________________________________________________________________
Harlan Ullman is UPI’s Arnaud de Borchgrave Distinguished Columnist; chairman of the Killowen Group that advises leaders of government and business; and senior adviser at Washington, D.C.’s, Atlantic Council and Business Executives for National Security. His latest book is “A Handful of Bullets: How the Murder of Archduke Franz Ferdinand Still Menaces the Peace.”

TAIWAN
Is the bubble in this property market set to pop?

Taipei

Lam Yik Fei | Bloomberg | Getty Images

Leslie Shaffer | @LeslieShaffer1
Thursday, 4 Jun 2015 | 7:11 PM ETCNBC.com
SHARES 

Taiwan’s long-bubbly property prices appear headed for a correction, but it doesn’t look like bargain hunters will fill the breach.

“Quite a number of buyers want to sell…(and) speculators have left the market already,” said Cliff So, executive director at REPro Knight Frank, a property agency in Taiwan.

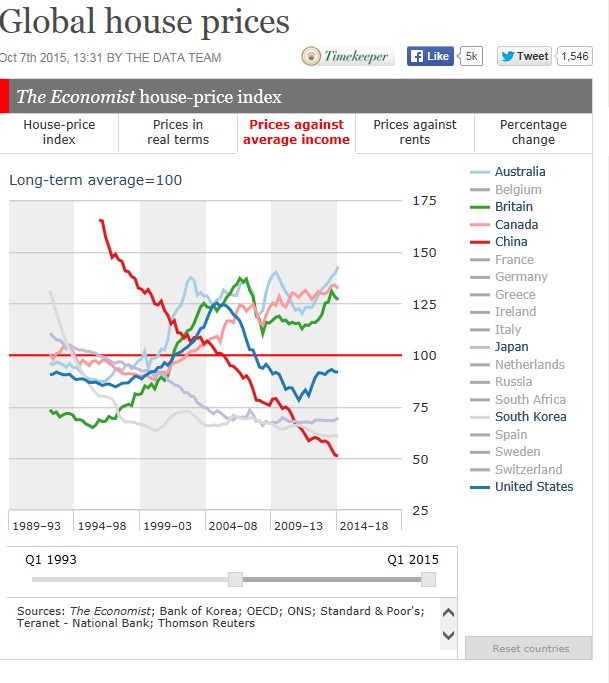
It’s quite a shift for what had become one of the world’s frothier property markets, with prices there nearly doubling since 2009. The capital of Taipei has some of the world’s least affordable housing, with home prices at around 15 times income, according to last year’s data.

That compares with Hong Kong’s median price-to-income multiple of 17.0, Sydney’s 9.8 and Tokyo’s average 4.9, according to Demographia’s housing affordability survey of 2014 data.

Read More While HK mulls limits, Taiwan welcomes China tourists

Taiwan’s government hasn’t taken the price increases lightly, introducing a series of cooling measures. The next step on deck is the one that’s shaken out many investors in the market: a new capital gains tax is targeted for 2016, with sellers taxed based on the market price instead of a government-assessed valuation, which is usually lower.

“Taiwan’s property market has cooled in the past year,” Emily Dabbs, an economist at Moody’s Analytics, said via email. “Unfortunately, buying a home remains unaffordable for most young Taiwanese, a situation we don’t expect to change in the medium term.”

Price rises and the numbers of transactions are showing signs of a slowdown, but that may not be enough to entice the average homebuyer. Taipei house prices still rose 1.2 percent on-year in the first quarter, but that’s down from double-digit gains a year ago, Dabbs said in a May note.
But the country’s transaction value for housing fell more than 20 percent in 2014, according to data from Sinyi Realty reported by The China Post.

“The demand is still very strong. There’s not a match for the type of property,” So said, noting that over the past couple years, developers have focused on large units of over 4,000 square feet. “For a small family, that’s too much for them.”

Investors are even having trouble leasing out those luxury units, So said, adding that he expects sharp price drops in that end of the market.

Indeed, REPro Knight Frank is launching a residential property agency in Taiwan, but that’s in large part to help local property investors look overseas instead.

Taiwanese buyers have increasingly been looking outside their home market, buying around $1.63 billion worth of overseas properties in 2014, up 25 percent from the previous year.
—By CNBC.Com’s Leslie Shaffer; Follow her on Twitter @LeslieShaffer1

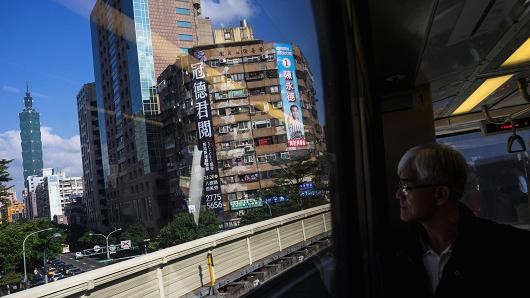
A Tsai is just a Tsai
The election of an independence-leaning president would put Taiwan back in the international spotlight

Jan 9th 2016 | TAIPEI |

tsai

UNDETERRED by the rain, the crowd leaps to its feet shouting “We’re going to win” in Taiwanese as their presidential candidate, Tsai Ing-wen, begins her stump speech. Some rattle piggy banks to show that their party, the Democratic Progressive Party (DPP), relies on, and serves, the little guy—as opposed to the ruling Kuomintang (KMT), backed by businesses and fat cats and one of the world’s richest political institutions. Taiwan’s voters go to the polls on January 16th in what is likely to prove a momentous election both for the domestic politics on the island and for its relations with the Communist government in China that claims sovereignty over it. Eight years of uneasy truce across the Taiwan Strait are coming to an end.

Since taking office in 2008, the outgoing president, Ma Ying-jeou, has engineered the deepest rapprochement between Taiwan and China ever seen, signing an unprecedented 23 pacts with the mainland, including a partial free-trade agreement. It culminated in an unprecedented meeting in November between Mr Ma and Xi Jinping, China’s president, in Singapore. But if the rapprochement under Mr Ma was a test of whether closer ties would help China’s long-term goal of peaceful unification, it failed. For the past six months Ms Tsai, whose party leans towards formal independence for Taiwan, has been miles ahead in the polls, with the support of 40-45% of voters.

The KMT’s Eric Chu has 20-25% and another candidate, James Soong, a former KMT heavyweight, about 15%. Taiwanese polls can be unreliable, and many voters are undecided. But if Mr Chu were to win, it would be a shock.

Taiwan elects its parliament, the Legislative Yuan, on the same day. That race is closer. But the DPP’s secretary-general, Joseph Wu, thinks his party can win it too, either outright or in coalition with two smaller parties—and the polls suggest he may be right. If so, it would be the first time any party other than the KMT has controlled the country’s legislature since the KMT fled to the island at the end of the Chinese civil war in 1949.

The election result will have regional consequences, but the campaign itself is being fought on livelihood issues. The economy appears to have grown by only 1% in 2015, less than in 2014. Taiwan is doing worse than other export-oriented Asian economies such as South Korea. Salaries are stagnant, youth unemployment is up and home ownership is beyond the reach of many. One study found that the capital, Taipei, has become one of the world’s costliest cities relative to income, with the ratio of median house prices to median household income rising from 8.9 in 2005 to 15.7 in 2014—nearly twice the level of London. Concerns like these have dented the KMT’s reputation for economic competence.
Self-inflicted wounds have not helped either. Most of the KMT’s bigwigs refused to run for president, fearing defeat. So its chairman, Eric Chu, put forward Hung Hsiu-chu, whose pro-China views proved so extreme that they nearly split the party. Mr. Chu ditched her just months before the poll and ran for president himself. Ms. Hung’s backers, many of them old-guard KMT voters, may abstain in protest. The party which for decades has dominated politics faces humiliation.

That would have profound implications for China. For years, the Chinese Communist Party’s policy towards Taiwan has been based on patience and economic integration. But the election campaign suggests that integration is a liability and that time may not be on China’s side. In 1992, according to the Election Studies Centre at National Chengchi University in Taipei, 18% of respondents identified themselves as Taiwanese only. A further 46% thought of themselves as both Taiwanese and Chinese. Today 59% call themselves Taiwanese, while 34% identify as both—ie, very few consider themselves Chinese first and foremost.

Patience doesn’t pay

Among 20- to 29-year-olds, three-quarters think of themselves as Taiwanese. For them China is a foreign country, and the political ripples of this change are now being felt. In early 2014 students occupied parliament for three weeks in a protest against a proposed services deal with China. This proved to be a turning point: the KMT went on to be thrashed in municipal elections in late 2014. Some of the student leaders have formed their own party to contest the legislative election, joining 17 other groups and 556 candidates, who range from a heavy-metal front man to a former triad crime boss.

The last time Taiwan chose a DPP president, Chen Shui-bian, in 2000, cross-strait tensions escalated. Given China’s increasing assertiveness in the region under Mr Xi, things could be even more dangerous now. China has been piling pressure on Ms Tsai. Mr Xi says he wants a “final resolution” of differences over Taiwan, adding that this is not something to leave for the next generation. China is demanding that Ms Tsai approve the “1992 consensus”, a formula by which China and the KMT agreed there was only one China—but disagreed about what that meant in practice. Ms. Tsai has long said no such consensus exists, though when asked about it in a presidential debate, she called it “one option”.

Ms. Tsai is a very different figure from Mr. Chen, who delighted in provoking China (and was later jailed for corruption). She is a low-key, English-educated lawyer schooled in international trade rather than in the rhetoric of Taiwanese nationalism. She has gone out of her way to assure China and America, Taiwan’s guarantor, that she backs the status quo and will be cautious. Many of her proposals, such as that Taiwan should expand its soft power through non-governmental organizations, seem designed to be uncontroversial. If her party takes control of the legislature, that would remove a source of instability: conflict with lawmakers made Mr. Chen’s presidency even more unpredictable than it otherwise would have been.

Yet whatever Ms. Tsai’s intentions, a lot could go wrong. Taiwanese politics is famously raucous, and the DPP’s radicals seeking formal independence might yet cause problems. Mr. Xi, in turn, could come under pressure from military diehards arguing that China has been too patient. In one of the last foreign-policy vestiges of the “one China” idea, China and Taiwan have similar claims in the South China Sea, a nerve-racking part of the globe. If a new government in Taiwan starts tinkering with its stance on the sea, China might easily take offence. The election of an independence-leaning president comes at a dangerous moment.

JAPAN
Japan Economy, Housing Starts & Lumber Shipments

shawn


By Shawn Lawlor
Director, Canada Wood Japan
December 16, 2015

Japan Economic Update:

boj-kuroda

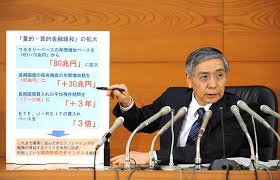
Bank of Japan Governor Kuroda

Japan edged its way out of recession as annualized GDP rose to 1.0% in the three months ending in September, following a contraction of 0.5% in the previous quarter. The increase was attributable to an 11% rise in capital spending. The Bank of Japan is maintaining the current rate of quantitative easing as BOJ Governor Kuroda expressed confidence that the economy is along a recovery path. Economists have commented however that it is likely that the LDP cabinet will table a further fiscal stimulus package late this year.

Masahiko Komura, newly appointed foreign minister, speaks during a news conference at the prime minister's official residence in Tokyo, Japan, on Tuesday, Sept. 25, 2007. Yasuo Fukuda was voted prime minister by the Japanese Diet after the first split vote in the houses of parliament since 1998. Photographer: Tomohiro OHsumi/Bloomnberg News.

Masahiko Komura,

Meanwhile the LDP cabinet has been busy negotiating details of the next consumption tax increase in April 2017 with National Diet coalition member Komeito. The legislators are aiming to soften the impact of the tax increase to low income families by exempting certain food staple products from the 8% to 10% hike. Next year will also see changes on the corporate tax front. Beginning in fiscal 2016 corporate taxes will drop from 32.11 to 29.97% as the Japanese government aims for Japan to become more tax competitive globally.

Tokyo 2020 Olympic Stadium in Wood?

wooden stadium

The selection for the National Stadium design for the Tokyo 2020 Olympics has been plagued by controversy. The initially approved proposal had an over the top futuristic design developed by British based Iraqi architect Zaha Hadid. This grandiose design fit in poorly with the surrounding neighborhood and ballooned to double the original budget of 130 billion yen. Prime Minister Abe then ordered the Japan Sports Council to shelve this plan and reopen a call for proposals for alternative designs.

It is now reported that two alternative designs have been submitted and both highlight wood in their construction. While the proposal proponents remain confidential, the initial responses to both proposals are positive due the selection of wooden materials, designs that fit better with the surrounding environment and are forecast to come below the 155 billion yen budget. One of the designs features extensive use of 72 massive wood pillars. The Japan Sports Council has yet to arrive upon a decision as to which design or general contractor company to award the project to. Canada Wood will monitor for opportunities for project involvement.

Jan 20th 2016, 17:42 by The Data Team Japanese housing starts fall below 900,000

japan wooden house
Source: Fordaq
October housing starts data from the Japanese Ministry of Land, Infrastructure, Transport and Tourism show a continuing decline for the second consecutive month.
Japan’s October housing starts were the lowest since June this year and were down 2.5% from the same month last year.
As of October annualised housing starts stood at 862,000 down from the September forecast of 900,000. Looking ahead for the balance of the year prospects do not look good as orders placed with construction firms are well down (-25%) compared to the same period last year.

THE International Labour Organization’s latest “World Employment and Social Outlook” expects recent labour -market growth to slow in the coming years amid uncertain economic prospects. In the aftermath of the financial crisis in 2008-09 many countries suffered heavy job losses and soaring unemployment, especially in the West. The ILO thinks that unemployment will rise again in the coming years, and it is also anxious that the progress made in reducing the number of those who work but remain in poverty will stall. In the past two decades, earnings in emerging and developing countries have improved significantly. Those deemed to be poor (earning less than $5 per day at 2011 prices) have dropped from 78% of the world’s working population (excluding already-rich countries) in 1991 to an estimated 46% this year. The reduction in the “extremely poor” has been even more pronounced, with a fall from around a half to just 11.5%.

Even so, because of the increase in the working population, 1.2 billion people in emerging and developing countries are considered to be in relative poverty. That is only 200m fewer than in 1991. For those at the very bottom, earning less than $1.90 a day, the reduction is steeper, from 890m to 320m people. There are noticeable differences between regions. The biggest improvement has been in eastern Asia, where the number of those in poverty has fallen from 600m to 190m, while its workforce has grown by 155m. Other Asian regions have made good progress too. Latin America, though having a much smaller workforce, is also much improved. Sadly, though Africa has made some headway, a third of its working people are still extremely
Marginal House Price Improvements in China
January 25th 2016
On a month-on-month comparison, in November 2015, of the 70 medium and large-sized Chinese cities, new home prices have declined in 27, and remained unchanged in all others. For November 2015 the year-on-year change was positive.
Prices for second-hand residential buildings fell in a minority of the cities surveyed but rose as much as 2% in some others. The improvement in house prices came as a surprise to many but were greeted as a sign that there could be a recovery beginning in a sector whose performance mirrors the overall economy.
The housing market is a closely watch indicator for the Chinese economy as it accounts for around 15% of GDP and trends in housing impact many wood product manufacturers.
Fordaq News
Korean won’s fall seen to last with no remedy in sight
Korean Herald Published : 2016-01-25 16:05

The South Korean currency will likely keep falling against the U.S. dollar for some time and may drop as low as 1,300 won, with local authorities having little means or will to halt its slide, analysts here said Monday.

The local currency closed at 1,200.1 against the greenback Friday after dipping to 1,214.00 won two days earlier, the lowest level in over five years since 1,215.6 won posted on July 19, 2010.

The won’s depreciation is largely attributed to a slowdown in the global economy, but also to the recent U.S. rate hike that has apparently prompted a mass outflow of foreign capital from Asia’s fourth-largest economy.

As of Friday, foreign investors remained net sellers of South Korean shares for 35 consecutive sessions since Dec. 2, offloading some 6.2 trillion won ($5.18 billion) over the cited period and lowering their combined stake in the South Korean stock market to 31.02 percent of overall market capitalization, the lowest since August 2009.

The U.S. Federal Reserve is expected to continue raising its key rate following its first rate hike in nearly a decade last month while the European Central Bank is expected to continue its quantitative easing, a move that may help boost growth in Europe but further push up the value of the U.S. dollar in the global market at the same time.

“We expect an additional U.S. rate hike to take place in or after June, keeping the won-dollar rate at around the current level for now but pushing it down to a new low in the second half of the year,” said Lee Chang-mok, a researcher at NH Investment and Securities.

A recent report from NH Securities forecast the won-dollar exchange rate to reach 1,250 won against the dollar in the second half of the year.

Daishin Securities sees the rate reaching as low as 1,300 won due to uncertainties in the world’s second-largest economy.

“The market may come to be stabilized for now, but in the long run, the foreign currency market and oil prices will again witness two or three large fluctuations as they are greatly affected by uncertainties in China,” Daishin Securities researcher Cho Yoon-nam said.

Morgan Stanley, too, forecast the won-dollar exchange rate to find a new low this year at 1,300 won per dollar.

The problem is that local authorities may have little or no means to change the direction of flows of foreign capital, the market watchers said.

One of surest ways to prevent a capital outflow is to raise the country’s own interest rate, offering higher yields for foreign investment and thus making the market more attractive.

A more serious problem is that the local authorities may be reluctant to even take what little means available to stop the won’s depreciation, hoping it will help boost the country’s exports that suffered an on-year drop every single month last year.

The BOK has kept its key rate frozen at a record low 1.5 percent since June in an attempt to help bolster growth.

“There may be many elements that could trigger capital outflow and they include financial market fluctuations in emerging market countries, namely China, the speed of the United States’ monetary policy normalization and movements in global oil prices,” BOK Gov.

Lee Ju-yeol said on Jan. 14 when the BOK’s monetary policy board decided to again keep its policy rate steady in January.

“However, our economy is differentiated from other emerging market countries in terms of economic fundamentals and foreign exchange soundness, so I believe the country’s capital outflow will also be differentiated from those of other countries,”

Market watchers say that like in all other economic events, some stand to gain while others will suffer losses from the won’s devaluation.

They said many exporting companies may enjoy a sudden boost to shipments with large, export-dependent automakers expected to benefit the most from a further decline in the value of the local currency that will provide them with additional price competitiveness.

According to NH Securities, the country’s two leading automakers — Hyundai Motor Co. and its smaller affiliate Kia Motors Corp. — are expected to see each of their operating profits go up by nearly 1 trillion won if the average won-dollar exchange rate drops to 1,250 won per dollar this year.

The combined operating profit of 10 listed auto-related firms here, including Hyundai and Kia, is expected to spike 15.4 percent on-year to 16.58 trillion won, it said.

Such an effect, however, cannot last long, especially as the local carmakers continue to expand their overseas production, the analysts said.

“Japan had once sought to drive down the value of its local currency against the dollar and euro in an attempt to boost exports, but the move did not lead to an increase in its exports,”

the Korea Institute of Finance said in a recent report.

Others say the won’s drop is a double-edged sword whose damage could far outweigh benefits.

“Traditionally, a drop in the won-dollar exchange rate has led to a rise in the profit of export companies. But a sudden drop, such as the recent drop in the value of the won, could highlight uncertainties, causing only an adverse reaction of the market such as an outflow of foreign capital,” NH Securities researcher Lee said. (Yonhap)

Happy New Year -The Year of The Red Monkey

China market crash

Holy Molly! We all got an early New Year surprise from the biggest economy in the world-China. This prompted me to do a quick update on China. Lots of Monkey Business in the global economy this year. Buckle up!!!

red monkey

See Bloomberg’s video http://www.bloomberg.com/news/articles/2016-01-05/china-said-to-intervene-in-stock-market-after-590-billion-rout

Global Stocks Selloff Escalates as Oil Drops, China Weakens Yuan

Stocks fell around the world and commodities slid after China’s central bank set the yuan’s reference rate at an unexpectedly weak level, a reminder of the shock depreciation in August that sparked a wave of financial-market turmoil.

U.S. stocks dropped to a three-month low and emerging-market equities fell to the cheapest since 2009. Developing-nation currencies sank to a record as Korea’s won weakened after North Korea said it conducted a nuclear test, adding to geopolitical risks already heightened by tensions between Saudi Arabia and Iran. Brent crude reached its lowest level since 2004 on glut concerns. The yen reached its strongest level since October and Treasuries rose for a fifth session on demand for haven assets.

“This is risk aversion right now,” Benjamin Dunn, president of Alpha Theory Advisors, which works with hedge funds overseeing about $6 billion. “This is like a replay of the same things that moved the markets in August. Not a lot of people had conviction coming into the year after a violently flat to down year and now we’re perhaps getting confirmation that China is as bad as people think. We’ve lost the tailwinds from the Fed and investor enthusiasm and this adds to the mosaic of fear that’s out there right now.”

China’s growing tolerance for a weaker yuan signaled the government is struggling in its efforts to shore up economic growth and stem a rout in its equities. The flight from risk assets Wednesday rekindled concern seen in August, when a shock devaluation sent U.S. stocks to their first correction in four years amid the slowdown would hamper global growth. Disinflation in Europe and a renewed selloff in commodities may make it harder for central banks to meet their policy goals.

Stocks

Macquarie Favors China, India, Korea, Philippine Stocks

The MSCI All-Country World Index fell 1.3 percent at 9:34 a.m. in New York. The Standard & Poor’s 500 Index dropped 1.4 percent to the lowest level since Oct. 6. The Dow Jones Industrial Average fell 250 points.

Sentiment has turned more cautious on stocks after the Federal Reserve’s first interest-rate increase since 2006 and forecasts for little to no growth in corporate earnings until March. A report Wednesday showed companies added more workers than projected in December, indicating the job market had momentum as 2015 came to a close. Gauges on services-industry growth and factory activity are also due today, as well as minutes from the Fed’s December rate-setting meeting.

The Stoxx Europe 600 Index slid 1.7 percent. Commodity producers and carmakers — companies with some of the largest sales exposure to China — led declines. Tuesday’s rebound from the worst-ever start to the year was short-lived and the Stoxx 600 is down 3.4 percent this week. The VStoxx Index, which tracks the cost of options protecting against swings on the Euro Stoxx 50 Index, rose 5.3 percent to trade near a three-week high.

Emerging Markets

The MSCI Emerging Markets Index slid 1.1 percent to the lowest since July 2009, with all all but one of the 10 industry groups retreating. Technology companies led losses, tumbling to the lowest level since September. Benchmark gauges in Hong Kong, Taiwan and Saudi Arabia dropped at least 1 percent.

The Hang Seng China Enterprises Index of mainland companies listed in Hong Kong fell 0.9 percent, while the Shanghai Composite Index jumped 2.3 percent amid efforts by authorities to support the market. Marc Faber, publisher of the Gloom, Boom & Doom Report said in an interview on Bloomberg TV the Chinese economy may be headed for a “hard landing” as borrowers are taking on record amounts of debt to repay interest on their existing obligations.

The Bloomberg-JPMorgan Asia Dollar Indexfell to the lowest level since April 2009 as China’s central bank weakened the yuan’s reference rate for the seventh day in a row. The gap between the yuan rate inside China and that for the currency traded offshore expanded, underscoring speculation the government faces pressure to devalue its currency to aid the economy. China’s yuan fell 0.6 percent in Hong Kong’s freely traded market.

“This isn’t good for the rest of the world. Until China stops weakening the yuan, global markets will struggle to stabilize,” said Koichi Kurose, Tokyo-based chief market strategist at Resona Bank Ltd. “The Chinese authorities may be trying to prop up the economy by boosting exports, but while that’ll help one part of China’s economy, it comes at the sacrifice of someone else.”

Malaysia’s ringgit, Russia’s ruble, Turkey’s lira and the South African rand slid at least 0.8 percent as the measure of 20 developing-nation currencies dropped 0.5 percent.

South Korea’s won fell 0.8 percent to the weakest level since September while the equity benchmark slipped 0.3 percent. North Korea said it successfully tested a hydrogen bomb, a move that escalates tensions on the peninsula with neighbors South Korea and Japan.

Currencies

The yen appreciated 0.5 percent to 118.42 per U.S. dollar and reached 118.25, the strongest since Oct. 15. Japan’s currency surged more than 1 percent against the yuan to the highest level since October 2014, just before the Bank of Japan expanded monetary easing.

The People’s Bank of China lowered its daily fixing by 0.22 percent to the weakest level since April 2011, raising the risk other nations will need to lower their exchange rates to remain competitive.

Australia’s currency fell 1.2 percent and reached the lowest since November while the New Zealand dollar tumbled 0.9 percent. China is the largest export market for both South Pacific nations.

Bonds

Treasuries advanced with the yield on 10-year notes falling five basis points to 2.18 percent.

Euro-region government bonds also gained, pushing the yield on 10-year German debt to 0.50 percent, the lowest in more than a month, as signs of slowing global growth and a further drop in oil boosted demand for fixed-income assets.

“We’ve started this year in a funk,” said Richard Kelly, head of global strategy at Toronto-Dominion Bank in London. “You had the big liquidity shock out of China the first day back, and from that perspective fixed income is still prone to rallying.”

Germany sold debt due in 2017 with an average yield of minus 0.38 percent, matching the lowest on record. The nation received enough bids to reach its sales goal. The securities were auctioned to yield minus 0.32 percent at a previous sale last month.

The cost of insuring corporate debt rose to the highest in about two weeks. The Markit iTraxx Europe Index of credit-default swaps on investment-grade companies climbed one basis point to 82 basis points. The Markit iTraxx Europe Crossover Index of swaps on junk-rated companies jumped 10 basis points to 339 basis points.

Commodities

Oil slumped before weekly U.S. government data forecast to show stockpiles rose in the world’s biggest crude consumer.

Brent crude for February settlement fell as much as $1.80 or 4.9 percent, to $34.62 a barrel on the London-based ICE Futures Europe exchange. West Texas Intermediate declined 3.3 percent after dropping 2.2 percent Tuesday.

U.S. oil inventories probably increased by 500,000 barrels last week, according to a Bloomberg survey before Energy Information Administration data Wednesday. The industry-funded American Petroleum Institute was said to report stockpiles fell by 5.6 million barrels while fuel supplies gained.

Gold for immediate delivery advanced 0.9 percent to $1,086.82 an ounce following two days of gains. Demand for the precious metal has been bolstered as gyrations in global stock markets enhance its allure as a haven investment.

Zinc on the London Metal Exchange dropped 2.3 percent to the lowest since Dec. 29. Copper fell 1 percent.

BloomburgBusiness

http://www.ft.com/cms/s/2/5bd011ce-78b7-11e5-933d-efcdc3c11c89.html#ixzz3wTffp3ci

November 20, 2015 1:19 am

Beijing’s economic competence questioned

Chinese President Xi Jinping (left) visits a local factory affiliated to TPK, a touch solution provider from southeast China's Taiwan, in Pingtan, southeast China's Fujian Province, Nov. 1, 2014©Alamy

Seeking change: Xi Jinping, China’s president, visits an advanced technology factory in the Fujian province

For more than two decades the Chinese Communist party has offered the masses an unwritten social contract — we will manage the country and allow you to get rich, as long as you stay out of politics.

Rapidly rising living standards and a bureaucracy that was remarkably successful at achieving high rates of growth left most ordinary citizens convinced this was a pretty good deal.

IN Doing Business in China

But a stock market crash and a series of policy mis-steps over the summer have left many investors questioning their faith in the infallibility of the mandarins in Beijing.

Meanwhile, the relentless slowdown in the broader Chinese economy that has been under way for the last few years appears to be worsening, and deep-seated problems in the real estate, manufacturing and financial sectors are becoming more acute.

As recently as two years ago, many Chinese officials were still confidently predicting that the economy would continue to expand at a steady rate of 8 per cent for at least two more decades.

But China will grow at its slowest annual pace in a quarter of a century this year as the Communist Party struggles to achieve its full-year target of “around 7 per cent” growth in GDP. According to official statistics, the economy expanded 6.9 per cent in the third quarter from a year earlier, after growing by 7 per cent in the first half.

Tao Wang, the chief China economist at UBS, predicts growth will slow to 6.2 per cent next year and 5.8 per cent in 2017.

“Downside risks [to these forecasts] will probably come mainly from a deeper and more prolonged property destocking process and a greater knock-on effect on the industrial sector, and to a lesser extent, from insufficient policy support to temper the downturn,” she says. “Either could aggravate the negative feedback loop in weak real activity, worsening deflationary pressures and increasing debt burdens; all against a backdrop of higher capital outflows and financial market volatility.”

Investors are unlikely to see any relief from China’s enormous export sector, which is struggling with weak global demand, rising environmental and labour costs and a strengthening renminbi.

At the start of 2015, the government set a target of 6 per cent expansion in total trade, but in the first 10 months of the year China’s trade with the rest of the world shrank 8 per cent from the same period a year earlier.

Woes in the export sector were one reason for the Chinese government’s decision to devalue the renminbi on August 11, according to people familiar with the matter. But the shocked reaction of global markets and the abrupt volte-face that followed that decision probably did more to harm Chinese leaders’ reputation for economic competence than anything else.

“The devaluation was clearly a policy miss-step,” says Derek Scissors, a resident scholar at the American Enterprise Institute in Washington DC. “It seems they were completely oblivious to the downside risk and how the rest of the world would react.”

In fact, global investors had already been losing confidence in the Chinese authorities for some time.

Around the middle of 2014 it became clear that the government had decided to encourage speculation in the country’s vast, but poorly regulated, equity market. By attaching its imprimatur to a bubble the government believed it could engineer a giant debt-for-equity swap as companies sold shares to pay off some of the crushing debt that was harder to service as growth slowed.

As the benchmark Shanghai index soared in early 2015 the People’s Daily, the official mouthpiece of the Communist Party, crowed in a front page editorial that this was only the start of a multiyear bull market. But barely two months later the bubble burst and prices of equities, that had been driven upwards by a flood of newly sanctioned margin trading, started to plummet.

Beijing’s knee jerk reaction was a massive state-sponsored rescue effort to buy stocks and stop the price falls. When that did not work the government banned large shareholders from selling any stocks. The market kept falling and eventually the “national team” of state-backed stock-buying funds abandoned their attempts to prop up prices — but not before they had spent more than $200bn trying to support the market.

“This was a huge hit to the government’s credibility and it just got worse with the failed devaluation attempt,” said one market participant with close ties to top financial regulators.

On August 11, the day the People’s Bank of China — China’s central bank — announced its devaluation, several of the PBOC’s most senior officials were on holiday and had to be recalled, according to several people with knowledge of the matter. These people said the PBOC had proposed the move as just one possible policy option and did not expect the central leadership to adopt it so promptly. At first glance the announcement appeared to be a master stroke.

In addition to a small “one-off” devaluation of less than 1 per cent against the US dollar, the PBOC also said it would now allow the market to play a much bigger role in setting the exchange rate — a reform the IMF and many other institutions had been urging for years.

That meant Beijing could devalue the currency to help struggling exporters while also appearing to be complying with IMF demands. Theoretically, this would not lead to competitive devaluations from other countries and China would not be accused of following a mercantilist policy. Over the next few days investors pushed the value of the renminbi down by close to 5 per cent, as Beijing had hoped.

As investment and GDP growth continue to slow, employment and wage growth may soften further– Tao Wang

But outside China’s borders global markets and regional Asian currencies were collapsing as investors worried about a currency war amid fears the Chinese economy was in much worse trouble than anyone had thought.

Within days the PBOC reversed itself and announced it was heavily intervening in the market, essentially to re-peg the renminbi to the dollar to try to calm panicky markets and trading partners. “The government was very surprised by the strength of the international reaction,” said one senior adviser to the Chinese leadership. “But once it feels it has sufficiently stabilised the market then we will see some more devaluation.”

If this prediction is correct it will have a vast impact on global companies and investors operating in or coming to China.

For years, the ever-rising value of the renminbi was as certain and stable as the Communist Party’s social contract with its citizens and that meant a one-way bet and an extra attraction for foreign investors pouring into renminbi assets.

Investors looking for a bright spot in China have pointed to resilience in consumption and service sectors, which have held up even as growth in investment, construction, manufacturing and heavy industries has plummeted. The government has encouraged this optimism by pledging to shift the Chinese growth model from investment and construction to consumption and services.

But in unpublished recent remarks to visiting foreign dignitaries, even China’s outspoken finance minister, Lou Jiwei, forecast four or five years of much lower growth as the economy digests massive industrial overcapacity, as well as excessive debt levels that are still rising. He also warned that he expects “labour pains” as unemployment rises.

“Although employment and consumption have stayed resilient so far, we expect both to face increasing headwinds in 2016 and 2017,” says Ms Wang. “Going forward, as investment and GDP growth continue to slow, employment and wage growth may soften further.”

As growth slows and debt piles up the government’s unwritten contract with the masses — and with global investors — is looking increasingly strained.


China’s Bond Market

chinese bonds.jpg

These comments come from various sources….

A key aspect of China’s financial reform in 2015 is the development of the domestic bond market. While China’s bond market is the third largest in the world, behind US and Japan, its share of GDP (around 70%)remains small when comparing to many other countries (e.g. 200% in Japan and 224% in US). China’s bond market is also mostly domestic, with very few foreign players both as issuers and as investors.

Chinese policymakers have increasingly recognized the importance of developing the local currency bond market as a source of financing for enterprises and as an asset class for both domestic and foreign investors. As part of China’s efforts to open up the capital account and internationalize the RMB, there have been some important measures in 2015 to open up the bond market for issuers and investors.

Overview

China_s Bond Market

China’s bond market has RMB 45 trillion (USD 7 trillion) outstanding as of October 2015, which is an increase of 25% from the 2014 volume and six-fold from a decade-ago, although about RMB 3 trillion is a result of the local government debt swap program implemented this year. The market is also very liquid – the trading volume, at RMB 548 trillion (USD 86 trillion) as of October 2015, represents an increase of 41% from end of 2014. Most bonds, around 93%, are traded on the interbank market (CIBM)which is regulated by the People’s Bank of China (PBOC) while the remaining bonds are traded on the Shanghai and Shenzhen stock exchanges, which are regulated by the China Securities Regulatory Commission (CSRC). About 30% of the outstanding bonds are treasury bonds, direct local government issuance and central bank bills. The remaining 70% of the market is dominated by financial bonds (issued by policy banks, commercial banks and other Chinese financial institutions), and corporate bonds (issued by non-financial companies, many of them SOEs).

The rapid growth of China’s bond market is expected to continue over the next several years. Commentators from PBOC/NAFMII (China’s self-regulatory entity for CIBM) and private sectors have all recently said that the current growth rate of 20%+ is expected to continue for the next five years, and a common assessment is that the market will reach RMB 100 trillion by 2020, overtaking Japan to become world’s second largest.

Source: NAFMII National Association of Financial Markets Institutional Investors

Foreign Investors

According to Citi, as of September 2015, there are 288 foreign investors in China’s domestic bond market, holding assets of RMB 764 billion (USD 119 billion), or less than 2% of the market. There are two main channels for foreign investors to access the market – through the QFII/RQFII program (which is open to most institutional investors) and through the PBOC CIBM program for foreign central banks, sovereign wealth funds (SWGs) and international financial institutions (IFIs). The most notable change this year is PBOC’s new policies for the CIBM program. In July 2015, PBOC announced that for foreign central banks, monetary authorities, SWGs and IFIs, the previous approval process to invest in the CIBM

is replaced with a simplified filing process. In addition, the range of transactions for these investors has been expanded to include repo, lending, forwards and derivatives and there will be no requirement for minimum investment period or minimum investment amount. The choice of trading and clearing agents is also expanded from just the PBOC to dozens of Chinese and foreign financial institutions. The new and improved PBOC CIBM program is considered by many as a major milestone to relax restrictions for foreign investors in China’s bond market. However, it seems that the July announcement has so far not resulted in significant increase in investment allocation from foreign central banks/IFIs/SWGs as many are still adjusting to the new program requirements and assessing new investment options – the pace of foreign investment growth may pick up in 2016 and beyond with RMB now in the SDR basket and increasingly considered an international currency.

Foreign Issuers

China’s bond market has also been mostly closed to foreign issuers until this year when the Panda bond market experienced major developments. A Panda bond is a RMB-denominated bond from a foreign issuer in China’s onshore market. IFC and ADB were the first ones to issue Panda bonds in 2005 but restrictions on the repatriation of proceeds outside of China have left this market dormant until recently.

Following this summer’s market turmoil in China, interests from both issuers and investors in the offshore dim sum bond market have been drying up. According to Reuters, dim sum issuance in 2014 reached RMB 337.8 billion ($53 billion), but the total year to date stands at just RMB 150.8 billion.

In contrast, yields on the onshore market are declining as a result of PBOC’s repeated rate cuts since late 2014 and onshore bond yields are now lower than comparable dim sum yields, making the Panda market more attractive for issuers. With active supports by PBOC and NAFMII, there has been visible progress in the Panda bond market. Since September 2015, HSBC (HK), Bank of China (HK), Standard Chartered (HK) and China Merchants Holdings (HK) have issued a total of RMB 3.5 billion, with the one-year yield at 3.03% and three-year yield at 3.5%. The Republic of Korea became the first sovereign government to issue Panda bond in December, with its three-year RMB 3 billion issue at 3%. The

Province of British Columbia became the first sovereign issuer to register its Panda bond program with NAFMII and has plan to issue up to RMB 6 billion. Other foreign issuers have also expressed interest in issuing Panda bonds next year, including DBS and IFC. While it has not been publicly announced, it is foreseeable that the new AIIB (Asian Infrastructure Investment Bank) and NDB (New Development Bank by the BRICS bloc) could also become Panda bond issuers as they become operational. While the Panda bond market will not completely replace the dim sum bond market, it is expected to grow rapidly, with IFC expecting the market to reach USD 50 billion in the next five years.

Investors’ demand for high-quality Panda bond issuance is expected to be strong – it is reported that Korea’s issuance was five-times subscribed. Despite the excitement, there are some outstanding issues for China to resolve to develop a mature Panda bond market.

Repatriation of funds: It is not clear the standard policy on whether foreign issuers are free to repatriate funds from the bond issuance. While this may be less of an issue for some issuers (such as sovereign and Chinese FIs) and regulators seem to be willing to discuss on a case-by-case basis, a clear policy may be needed if the number of issuers increase significantly.

Accounting recognition: Issuers of Panda bonds would need to follow China’s accounting standards, or standards that China recognizes, such as IFRS. US and Japanese companies following US GAAP and Japan GAAP may face the challenge of meeting different accounting standards, given that China does not yet have mutual recognition agreement of accounting standards with their governments.

Credit rating agencies (CRAs): China’s bond market has been mostly closed to foreign CRAs and the bonds are rated by domestic CRAs, which have a reputation to inflate ratings. Many Chinese bonds are AAA rated domestically. However, as more foreign issuers start to enter the market, differentiation of credit quality will become important. Korea, which is rated AA- by S&P, got a AAA credit rating from a Chinese CRA for its Panda bond. To grow the Panda bond market, Chinese regulators may need to consider more clear policies and standards on the use of CRAs.

Key Issues Facing China’s Bond Market

With the bond market’s opening up to foreign investors and foreign issuers, there is an increased degree of urgency to address some of the issues that are unique to China’s bond market, in particular, CRAs and default settlement process.

 CRAs: as mentioned earlier, foreign CRAs such as S&P, Moody’s and Fitch are largely kept out of China’s bond market and bonds are rated by domestic CRAs. There are four large Chinese CRAs, China Chengxin International Credit Rating (a JV with Moody’s), China Lianhe Credit Rating (a JV with Fitch), Dagong Global Credit Rating and Shanghai Far East Credit Rating. A large number of domestic issuers are rated AAA or AA by domestic CRAs, several notches above China’s international sovereign rating of A+ (Fitch) and AA- (S&P). Most large Chinese investment firms do not trust CRAs’ credit ratings and reply on extensive internal risk assessment. Several investment professionals have acknowledged that ratings by Chinese CRAs are inflated by around 2 to 5 notches. As China’s bond market develops and becomes more internationalized, a reliable credit rating system that meets international standards would be needed.

Default settlement: There had been no bond default in China before 2014 as government at various levels and state-owned entities would always bailout any issuers facing financial difficulties. The culture of automatic bailout has created serious moral hazard problems. In recent months, there has been evidence that policymakers are more willing to tolerate some defaults. Since the first default of Chaori’s debt in March 2014, there have been about 30 default events, including some SOEs. Notables ones include Sinosteel, Er Zhong and the latest, China Shanshui Cement. While government eventually intervened in a few cases (e.g. Sinosteel), some were allowed to go through the default settlement process. The government’s current policy seems to be “selective bailout”, in an effort to strike a balance between reform/reduced moral hazard and market stability. As economy slows and policymakers intensify efforts to reduce industrial over-capacity over the next several years, more frequent default events are expected, which underscores the need for a more transparent default settlement and investor protection regime. As bond defaults are relatively new, the legal system, regulators and market practitioners are still learning to figure out standards and best practices.

With RMB becoming increasingly internationalized and capital market continues to open up, China’s bond market will continue to grow rapidly, both in size and in product diversity. However, economic headwinds and government’s policy direction to move away from automatic bailout mean credit risks are rising, particularly for companies in the over-capacity industries such as steel, coal, cement and shipbuilding. Many Chinese enterprises are already facing high leverage and lower profits, and there are no improvements in sights. Facing such challenging environment, policymakers’ actions and new reform measures going forward would be critical to ensure the healthy development of China’s bond market into a more mature market that converges to international standards.

5 elements of business in china

With all this chaos in China, it  is important hang in there and remember the Fundamentals of Doing Business in China. Financial Times did this great special report video. Hope you enjoy .

http://video.ft.com/4652810474001/The-five-elements-of-business-in-China/Companies

Fourth Quarter 2015 Economic and Wood Product News Part 2

Asia-Economy-Bigstock-2015-jan-02-M

Wooden building materials receive more support in China -Fordaq

China’s Ministries of Industry and Housing have developed an action plan to promote the production and use of green building materials. The aim is to increase the proportion and quality of green building materials and will focus on energy consumption in manufacturing and the emission of toxic airborne substances.

According to the plan more wooden building will be developed in China in the near future. The use of wooden structures will be promoted in public building such as schools, kindergartens, nursing homes and in landscaping. In addition, wooden rural housing construction will be promoted in existing and new community developments.

In China, biomass building materials will play a prominent role in the implementation of the action plan and new technologies utilising biomass materials will be introduced.

Golden waterways

Golden waterway for trade – new Arctic shipping service-Fordaq

COSCO one of China’s state owned shipping companies has announced it will introduce regular shipping services via an Arctic route to Europe. The company has tested the feasibility for this new route by twice sailing a vessel through the north east passage.

This year a COSCO container vessel equipped for ice breaking took just under a month to cover the sailing from Taicang Port to Rotterdam via the Artic route.

This route results in a 30% saving on sailing time and a fuel saving as the route is 2,800 nautical miles less than the route through the Indian Ocean and Suez Canal.

China’s Xinhua News Agency reported that Chinese experts hailed the route as a “golden waterway” for trade.

Sino-Canada Eco-district project shows progress brad

By Brad Spencer

Deputy Managing Director

August 13, 2015

Posted in: China

MOU signing

Signing of MOU between BSD-TEDA and CW for CW technical support in Eco-district project

Canada Ambassador

Canadian Ambassador Saint-Jacques and BSD-TEDA senior officials at eco-district site

The Sino-Canada Eco-District project, which is located in the Tianjin Binhai Tourism area is making progress. The project area is 1.8 km2 with the first phase over a five year period of about 1 Km2.  The current investors/developers of the project are a joint venture (BSD-TEDA) between the TEDA Investment Holding Group and the Beijing Science Park Development Group. It is part of the larger Sino-Singapore Tianjin Eco-City Administrative region. The land use plan for the project has been developed and B+H, a leading Canadian design firm with extensive experience in China, has been selected to work with the local Design Institute to complete the Master Plan of the project and to reflect Canadian best practices for sustainable communities.

On June 25th, a significant milestone was reached with an event in Tianjin Binhai with the presence of Ambassador Saint-Jacques, senior officials from The Sino-Singapore Tianjin Eco-City Administrative Committee, Natural Resources Canada, Ca

According to the guideline, Beijing holds its position as a political, cultural, innovative and diplomatic center while Tianjin works as an experimental research hub for R&D, global shipping, finance and economic reform.

ecocity

Canada Wood, Presidents of both BSD and TEDA and the project team leader from B+H. Over 30 KPIs were developed by The Canadian and Chinese sides for this project, including one that says that the proportion of buildings that use various wood building applications needs to be at least 60% of all structures. This is a tremendous opportunity for Canada in that it will be the first large-scale community-sized demonstration area for wood in construction.  It is an opportunity, with exemptions approval from MOHURD, to demonstrate new wood technologies and innovations that go beyond current Chinese codes. Canada Wood signed a MOU with BSD-TEDA offering its technical support services for this project. Construction of the first structure is anticipated to start in the first half of 2016.

 North American markets hit by stunning free fall that has seen Chinese stocks drop by 30 per cent in past month

By Joanne Lee-Young and Chuck Chiang, Vancouver Sun July 9, 2015

stock broker

A stock trader covers his eyes at a brokerage house in Fuyang in central China’s Anhui province

Wednesday, July 8, 2015. China announced a flurry of new moves Wednesday to halt a stock market slide.

On a day when China’s stock market rout hit the share prices of B.C.-based commodity producers and spilled panic into North American capital markets, Vancouver resident Wendy Wu was focused on the pain in her own trading portfolio.

“I’m annoyed to death. Annoyed to death,” said an exasperated Wu, who has been day trading Chinese stocks since before she moved to Vancouver’s west side from Luoyang in central China.

“It has never been like this,” Wu said Wednesday of China’s falling markets. She estimated that in the last week, she has lost $820,000 as shares on exchanges in Shanghai and Shenzhen have plummeted and more than half were suspended to halt the free fall.

Wu has held Shenzhen-listed Chinese property developer Hna Investment Group since 2008, but just sold after watching it drop from a high of 17 yuan ($3.49) a share to about 6 yuan ($1.23).

A month ago, she hopped into Shanghai-listed Zijin Mining Group, China’s largest gold producer — then cringed to see its share price cut almost in half. Zijin recently invested about $80 million in Pretium Resources, which is developing the Brucejack underground gold project in northwestern B.C.

While institutional investors are starting to mix Chinese stocks into their funds, more than 80 per cent of the trading in Shanghai and Shenzhen is still done by individuals. Most live in China and are estimated to represent about 15 per cent of the country’s total population.

Within these official state figures, however, is a subset of traders like Wu, who have Chinese passports and live abroad.

Some fall into the approximately 320,000 immigrants who, between the years 2004 and 2013, moved from mainland China to Canada. Many of them ended up in Metro Vancouver.

In addition, there are also some 80,000 mainland Chinese students and others in Vancouver who have no citizenship tie to mainland China, but have opened accounts as it has become easier to catch a bit of what had been, for a good stretch, a crazy ride up.

Indeed, Chinese stock markets have seen unpredictable fluctuations in recent months.

The Shanghai Stock Exchange Composite Index hit a peak of 5,166.35 on June 12, rising 150 per cent in a year, but has since lost about 30 per cent. The sell-off since June has wiped away $3.8 trillion from Chinese equity markets. By comparison, Canada’s annual GDP is an estimated $2.3 trillion.

This has Beijing taking drastic and, some say, desperate moves, including stopping IPOs, capping short-selling and having brokers create funds for stock purchases backed by the central bank. To spur lending and trading activity, it also dropped the interest rate to a record low of 4.85 per cent.

It’s a heady mix when you consider the presence of short-term traders who tend to impulsively follow the market momentum regardless of its direction, according to Andreas Schotter, academic director at the Ivey School of Business at the University of Western Ontario, who has lived in China for more than a decade and is an expert in global business strategies.

“The situation in China cannot yet be compared to fully matured financial system like we have here in Canada or the U.S.,” Schotter said. “There are a lot of short-term traders that tend to cause more dramatic upward or downward swings. It’s the culture of the market.”

Chinese officials had been working toward letting the market play a larger role in the country’s economy, leaving some observers now concerned that Beijing’s heavy-handed return to the stock markets is a sign this won’t continue.

Schotter, however, isn’t concerned: “I do not see the measure taken by the Chinese government as a sign of reversing liberalization.”

It’s not clear what all this means for the B.C. businesses that trade with China and the desire of entrepreneurs with access to Chinese cash to continue making real estate and commercial investments here.

There are likely investors in several situations: company executives and large shareholders who cannot sell stocks because of new government restrictions; people who bought on margin and lost more than they invested; and, people who got out before the market tanked, according to Andrey Pavlov, who specializes in real estate finance at Simon Fraser University’s Beedie School of Business.

Those who had fortunate timing might now be even more highly motivated to take their money out of China. However, having been torched “by an over-extended market built on cheap credit,” these investors might also take extra care to diversify away from a Canadian market that is “highly exposed to China and the world’s commodity markets in general,” said Pavlov.

Shares of coal-and-copper focused B.C. miner Teck Resources dropped 77 cents, or 6.3 per cent, to $11.49 on the TSX Wednesday, while shares of copper producer First Quantum Minerals slid 29 cents, or 1.9 per cent, to $14.73.

JLee-young@vancouversun.com

chchiang@vancouversun.com

© Copyright (c) The Vancouver Sun


The yuan joins the Special Drawing Rights (SDR)

Maiden voyage

yuan strong and stronger

Reserve-currency status might make for a weaker yuan

Dec 5th 2015 | From the print edition

PASSING through the Suez Canal became easier earlier this year, thanks to an expansion completed in August. Now it is about to become a little bit more complicated. Transit fees for the canal are denominated in Special Drawing Rights, a basket of currencies used by the International Monetary Fund (IMF) as its unit of account. This week the IMF decided to include the yuan in the basket from next year, joining the dollar, the euro, the pound and the yen.

If lots of things were priced in SDRs, the IMF’s decision would have forced companies around the world to buy yuan-denominated assets as soon as possible, to hedge their exposure. That would have prompted China’s currency to strengthen dramatically. But few goods or services are priced in SDRs. Instead, admission to the currency club is significant mainly for its symbolism: the IMF is lending its imprimatur to the yuan as a reserve currency—a safe, liquid asset in which governments can park their wealth. Indeed, far from setting off a groundswell of demand for the yuan, the IMF’s decision may pave the way for its depreciation.

The reason is that the People’s Bank of China (PBOC) will now find itself under more pressure to manage the yuan as central banks in most rich economies do their currencies—by letting market forces determine their value. In bringing the yuan into the SDR, the IMF had to determine that it is “freely usable”. Before coming to this decision, the IMF asked China to make changes to its currency regime.

Most importantly, China has now tied the yuan’s exchange rate at the start of daily trading to the previous day’s close; in the past the starting quote was in effect set at the whim of the PBOC, often creating a big gap with the value at which it last traded. It was the elimination of this gap that lay behind the yuan’s 2% devaluation in August, a move that rattled global markets. Though the yuan is still far from being a free-floating currency—the central bank has intervened since August to prop it up—the cost of such intervention is now higher. The PBOC must spend real money during the trading day to guide the yuan to its desired level.

Inclusion in the SDR will only deepen the expectations that China will let market forces decide the yuan’s exchange rate. The point of the SDR is to weave disparate currencies together into a single, diversified unit; some have suggested, for example, that commodities be quoted in SDRs to reduce the volatility of pricing them in dollars. But if China maintains its de facto peg to the dollar, the result of adding the yuan to the SDR will be to boost the dollar’s weight in the basket, defeating the point.

What would happen if China really did give the market the last word on the yuan? For some time it has been under downward pressure. The simplest yardstick is the decline in China’s foreign-exchange reserves, from a peak of nearly $4 trillion last year to just over $3.5 trillion now—a reflection, in part, of the PBOC’s selling of dollars to support the yuan. Were it not for tighter capital controls since the summer, outflows might have been even bigger.

And the yuan does look overvalued. Despite China’s slowing economy, its continued link to the surging dollar has put it near an all-time high in trade-weighted terms, up by more than 13% in the past 18 months (see chart). With the Federal Reserve gearing up to start raising interest rates at the same time as China is loosening its monetary policy, the yuan looks likely to come under more downward pressure, at least against the dollar.

It would be foolhardy to predict that China will suddenly give the market free rein. That would go against its deep-seated preference for gradual reform. But while basking in the glow of its SDR status, China must also be aware of the responsibility to minimise intervention that comes with it. A weaker yuan may well be the result.

From the print edition: Finance and economics


New Chinese sawmill in Russia

avic forestry

In 2016, the Chinese AVIC Forestry will launch a new sawmill – the third out of ten enterprises whose construction is planned within the framework of the Asino industrial park –  in Tomsk Region, Russia. In 2008-2015 there was invested 18 billion rubles (EUR 241,19 million as of Dec 12, 2015) in this project, reports TASS with the reference to Boris Kaznacheev, deputy CEO of AVIC Forestry’s subsidiary Roskitinvest.

“Next year we are planning to launch a sawmill whose capacity will come up to 200,000 m3 of edged boards per year. As expected, China will be the main export market,” commented Kaznacheev.

He underlined that it is rather difficult to assess the exact investment amount, since investors allocate money to several projects at the same time: while paying to construct one mill, they may also be involved in creating infrastructure for others. “As of today, investments have come up to 18 billion rubles,” he said, noting that the complex contruction started back in 2008, but the active stage began in 2012.

All in all, says TASS, it is planned to construct and launch 10 woodworking plants as a part of Asino industrial complex. In February 2015, the first one was launched. It is a veneer plant with the annual capacity of 100,000 m3. The 2nd plant – the MDF plnat (200,000 m3 per year) and a power plant are planned to be launched in 2016. These two enterprises will be followed by a plywood plant and a laminated flooring plant (each producing 80,000 m3 of the end product per year), a furniture factory (200,000 units) and so on.

By 2020 the total investment amount will have come up to 30 billion rubles (about EUR 402 million as of Dec 12, 2015). The industrial complex in question is expected to provide 5,500 new jobs. 2,000 jobs have already been created.

China: Less interest in imported furniture

children-bedroom-furniture-china-1050

December 09, 2015

Source:

Fordaq/ITTO

In order to boost domestic sales imported furniture traders have recently reduced prices by as much as 30%. However, even with such big discounts domestic sales did not pick up. Analysts report that the enthusiasm of Chinese consumers for imported furniture has fallen and efforts at promotion are not delivering results.

It now seems consumers in China are more price conscious and are returning to purchasing domestically manufactured furniture which is cheaper than imports even with the heavy price discounts offered on imported products.

China enters custom furniture age

The sales of imported furniture fell this year and local analysts put this down to changing life styles rather than the economic slowdown.

There are many more home owners now in China and most houses and apartments tend to be small or medium sized and are owned by those born in the 1980s and 1990s.

These young home-owners demand functionality as well as artistic and personalised furniture. Because of this there is a growing trend to custom tailored furniture and innovative furniture makers now offer whole house furniture customisation.


Fourth Quarter 2015 Economic and Wood Product News part 1

Sawmills in U.S. South and Russia achieve highest global sawmilling earnings

Since 2008 until very recenty, the U.S. South had had the best figures in terms of sawmilling industry sales. The ongoing decline in foreign currency exchange rates of major producing and exporting regions against the U.S. dollar caused a massive erosion of lumber prices in many markets around the world. Nevertheless, the situation on some markets has changed dramatically. 

As International Wood Markets emphasizes in its 2015 Global Cost Benchmarking Report, the Russian ruble saw a 50% reduction (2014 average vs. Q1/2015 average) and this contributed to the Russian sawmills facing major cost reductions as well as soaring lumber revenues in U.S. dollar terms.

Wood Markets’ survey took into consideration 32 countries and/or regions. Among them, U.S. South and Russian mills accounted for 6 of the top 8 positions in terms of earnings (EBITDA) at top-quartile mills. The global EBITDA average in 2014 for top-quartile mills was double that of 2012 on the strength of improved lumber markets, stable global economic conditions and a slow strengthening of the U.S. dollar.

US Mills Rise to the Top

On the North-Amercian scene, U.S. mills are still getting better overall earnings than the Canadian ones. As the Wood Markets underlines, the Softwood Lumber Agreement (SLA) is likely to be a key factor. The U.S. South sawmills performed best.

Currently, Canadian mills have to face rather low lumber prices. Despite this, local producers may see better earning with the local currency getting weaker agains the U.S. dollar and the non-renewal of the SLA starting on October 12, 2015, says International Wood Markets’ President Russell Taylor. 

In Q1/2015, good earnings seen by North American mills, slid down due to weak demand, declining lumber prices, and excess production. The downward tendency continued both into Q2 and Q3 of 2015. Regardless, the U.S. South remained the highest margin region in the world in Q1/2015.

Russian Mills Achieve Stellar Results

Russia’s best mills have been improving their results in each global survey over the last four years, says Wood Markets. Mostly driven by curriency fluctuations, mills reached top earnings in 2014. Buyers were able to quickly push Russian lumber prices lower in US-dollar terms, especially in China.

Thus, in  2014 and Q1/2015, overall earnings of the Russian and U.S. mills were approximately on the same level.  “With a huge windfall of cash, a number of Russian sawmill companies have embarked on capital spending programs to create higher production, lower cost mills, not to mention considerable investments in lower cost Scandinavian logging equipment.” commented Russell Taylor cited in Wood Markets’ press-release. 

European & Southern Hemisphere Mills Improve

Despite the rapid weakness in the euro relative to the U.S. dollar, European sawmills weakened through into Q1/2015. Earlier on, they managed to improve moderately over the disastrous results of 2012. 

A similar tendency was observed in the Southern Hemisphere regions (Australia, New Zealand, Chile, Brazil and South Africa): better results over 2012 earnings, but general weakness in Q1/2015.

Wood Markets underlines that since 2002 South Africa and Australia fared pretty well. Australia out-performed South Africa in 2014 and Q1/2015 at “top-quartile” mills to achieve the highest earnings of mills “down-under”

 Fordaq Oct 1 15 Referencing International Wood Markets

Container shipping

The big-box game

The largest container lines are bulking up to try to withstand a fresh downturn

Oct 31st 2015 | From the print edition

Add this article to your reading list by clicking this button

Container ship

SINCE the financial crisis, the tide of recovery has not lifted all boats equally. But in few industries is that more true than in shipping. Demand for oil tankers has boomed: a combination of weak spot prices and higher futures prices, driven by the assumption that supply and demand for crude will eventually rebalance, has encouraged traders to hire tankers to store oil at sea and cash in on the price gap. Meanwhile, bulk carriers, which carry such things as iron ore and coal, have been hit by massive overcapacity, as Chinese demand for such commodities has collapsed (see article).

Until the start of this year, the container-shipping business—which carries around 60% by value of all seaborne trade in goods—looked more like that for oil tankers. Rising global trade volumes, and firm steel prices that made it worthwhile for owners to scrap old ships, had kept capacity in check, and container-freight rates seemed to be steadying. As recently as August last year, demand for container shipping was so high that BIMCO, an industry association, was warning of a capacity shortage. And at the start of this year Drewry, a shipping consultant, forecast a bumper year: owners of boxships would rake in profits of up to $8 billion in 2015, they thought, helped by low fuel costs.

But since then the industry has been rattled by renewed weakness in freight rates, prompted by a fall in the volume of seaborne trade. The cost of sending a container from Shanghai to Europe, for instance, has almost halved since March, according to the Chinese city’s shipping exchange (see chart). And the absence of the usual pre-Christmas pick-up is worrying both analysts and investors, according to Rahul Kapoor of Drewry. On October 23rd Maersk, the world’s largest container line, told investors to brace themselves for a fall in profits when it announces its third-quarter figures on November 6th.

Shanghai Containerized index

Some of the shipping lines’ problems are due to factors beyond their control. At a time when weak trade volumes should be prompting them to scrap more old vessels, the steel price has slumped. So, 60% fewer boxships have been scrapped so far this year compared with the same period last year. However, some shipping groups have made a rod for their backs by taking on too much debt. This also makes it hard for them to scrap unprofitable vessels, since their balance-sheets would struggle to cope with the resulting writedowns.

Worse still, critics say, is that shipowners have embarked upon a building boom. Orders for new container ships were 60% higher in the first five months of this year, than in the same period in 2014, according to Alphaliner, a data provider. In June Maersk ordered 11 ships that can each carry up to 20,000 standard-sized containers, in a deal worth $1.8 billion. Next week Hapag-Lloyd, another operator, plans to raise $300m by floating on Frankfurt’s stock exchange, to help pay for six giant new ships, ensuring that it stays in the game.

Hapag-Lloyd has had to delay its IPO a week because demand for the shares has been so weak. And investors have good reasons to be hesitant. All the extra capacity should depress rates further, adding to the industry’s problems. But for those lines that can afford it, ordering big, new ships may be a sensible reaction to falling freight rates. There are still sizeable economies to be gained from increasing the size of vessels. As Hapag-Lloyd’s boss, Rolf Habben-Jansen, recently pointed out, a ship capable of carrying 19,200 containers needs half as much fuel to shift each box by one mile as a vessel with a capacity of 4,900.

As a result, the capacity of the largest container ships afloat has risen from around 14,000 before the financial crisis to just under 20,000 today—and boxships are taking the place of oil supertankers as the giants of the seas (see diagram).

shhip classes

Among the winners from this flight to scale will be the world’s largest three lines—Maersk, Mediterranean Shipping Company (MSC) and CMA CGM. They have the industry’s lowest costs, because they have the biggest ships and the cheapest finance costs. They also have the advantage of being based in Europe: demand to transport goods across the Atlantic has remained strong. Analysts expect the big three to stay profitable over the next few tough quarters, even as their revenues fall.

Maersk and MSC have also formed an alliance, 2M, to save more money by sharing space on their ships on transatlantic and transpacific routes. As the strongest lines get stronger, through fleet renewal and alliance-building, smaller lines that cannot cut their costs quickly enough or obtain cheaper finance to build bigger ships will suffer. China’s two biggest lines, China Shipping Group and Cosco, were losing money before the current downturn started. They have recently swung back into profit, but only thanks to generous state aid to help them scrap old vessels. The government regards it as vital to have a national merchant fleet, so it will not let the two go to the wall. But it plans to merge them to save money, and to stamp out corruption at Cosco which, according to internal documents leaked this week, is another reason for its poor performance.

The hardest hit, however, will be the smallest container lines that do not enjoy state backing. Several smaller Japanese and South Korean operators, in particular, are sailing close to bankruptcy, analysts say. The pressure to cut costs is also hitting container lines’ suppliers; several shipping-services firms in Denmark and container-logistics firms in Britain have gone bust in the past year.

The move towards ever bigger vessels poses a risk to ports which lack the capacity to handle them. International trade is shifting towards big, centralised hubs. And smaller ports, somewhat like smaller airports when the hub-and-spoke model for long-haul flights became dominant, are losing many of their direct connections. This has already happened at Portland on America’s west coast, which is no longer served by any regular container routes.

To avoid this fate, port authorities in some countries are now investing heavily in upgrading their infrastructure, to handle larger vessels. Recent development projects in Liverpool and London have already brought traffic back to those British ports. In a similar vein, Indonesia announced details of a $3.6 billion project to upgrade its container ports earlier this month, to ensure it does not lose routes to Singapore, the nearest big hub.

As falling volumes and weak shipping rates force the industry to consolidate, with fewer, bigger lines sailing ever-larger ships to fewer, bigger ports, the resulting gains in efficiency should mean cheaper transport costs, bringing benefits for consumers in many places. That is, unless the consolidation goes too far, and the surviving lines are able to jack up their rates. The 2M alliance now controls more than 28% of global container-shipping capacity, and almost a third on the Europe-to-Asia route.

Regulators are already worried about the impact on competition: in June last year, the Chinese authorities vetoed plans for a larger alliance, called P3, that would have involved all three of the world’s biggest lines. Cheaper container rates are a boon for firms engaged in international trade, and their customers. But there is a risk that the benefits will not last.

From the print edition: Business

Quantitative frightening

The world’s vast stockpile of reserves is falling, raising fears of dwindling global liquidity

Oct 10th 2015 | Economist

Add this article to your reading list by clicking this button

reseerves

  •  This has sparked warnings that the world faces a liquidity squeeze from dwindling reserves. When central banks in China and elsewhere were buying Treasuries and other prized bonds to add to their reserves, it put downward pressure on rich-world bond yields. Running down reserves will mean selling some of these accumulated assets. That threatens to push up global interest rates at a time when growth is fragile and financial markets are skittish. Analysts at Deutsche Bank have described the effect as “quantitative tightening”. In principle, rich-world central banks can offset the impact of this by, for instance, additional “quantitative easing” (QE), the purchase of their own bonds with central-bank money. In practice there are obstacles to doing so.Controlling for the range of things that influence interest rates, from growth to demography, economists have attempted to gauge the impact of reserve accumulation. Francis and Veronica Warnock of the University of Virginia concluded that foreign-bond purchases lowered yields on ten-year Treasuries by around 0.8 percentage points in 2005. A recent working paper by researchers at the European Central Bank found a similar effect: increased foreign holdings of euro-area bonds reduced long-term interest rates by about 1.5 percentage points during the mid-2000s.One explanation is that domestic variables outweigh foreign ones. Bond-buying by the Federal Reserve during its QE programed in 2008-14 mattered more in setting America’s long-term interest rates than increased reserve allocation by foreign central banks. In the past half year, the European Central Bank’s QE has had a dampening effect on euro-area yields. This suggests that changes in foreign-exchange reserves are not an insurmountable force. To the extent that a decline causes unwanted tightening, central banks in the rich world can counter it by buying bonds. Then again, although asset sales by central banks in emerging markets now exceed purchases by their counterparts in the rich world (see chart), the Fed shows little appetite to resume QE.Lost and foundBut even these concerns may be overdone. Reserves are not the only determinant of domestic money supply. Central banks soaked up much of the money created when they initially accumulated reserves, thus “sterilising” the impact. They can now undo that, for instance, by lowering the amount of money banks must keep at the central bank, as China has been doing. And just as central banks in the rich world use open-market operations—buying and selling domestic assets on a daily basis—to influence short-term interest rates, so can those in the developing world. Such operations require skill and deep capital markets, however.

Global housing markets

Upwardly mobile

House prices are on the rise again around the world

  • Oct 3rd 2015 | From the print edition
  • global housing prices

    WHEN the bottom finally fell out of America’s housing market in 2006, it triggered the worst global recession since the 1930s. But rising house prices need not spell disaster. The Economist’s latest round-up of house prices across the globe shows that prices have risen over the past year in 21 of the 26 economies we track, at a median pace of 4.7% (see table). Not every rise is alike, however.Not for long, perhaps. Activity is buoyant: sales of existing homes increased by 6.2% on the previous year. With 30-year fixed-rate mortgages at record lows, the effect of an interest-rate rise on the housing market is expected to be minimal.

  • Other countries’ housing markets are already well above fair value. Taking an average of our two measures, houses are more than 30% overvalued in six markets. Britain is perhaps the most supply-constrained of this group. Although prices have risen by 35% since their trough in January 2009, housebuilding is failing to respond. Just 140,000 homes were completed in the year to March 2014, some 25% below the long-term norm. That puts a firmer floor under prices than in other notably overvalued markets such as Canada and Australia.Hong Kong is the most extreme example of soaring prices and limited supply. Property prices in the territory appreciated by 21% in the year to June, and have now doubled in five years. Since 2009 the regulator has introduced seven rounds of “macro-prudential” measures designed to cork the rises. Its latest, in March this year, reduced the average loan-to-value ratio for new mortgages from 64% to just 52%. In practice, China’s recent stock market crash is likely to be a bigger dampener on demand, as wounded mainland investors put off new purchases.
  • To assess whether house prices are at sustainable levels, we use two yardsticks. One is affordability, measured by the ratio of prices to income per person after tax. The other is the case for investing in housing, based on the ratio of house prices to rents, much as stockmarket investors look at the ratio of equity prices to earnings. If these gauges are higher than their historical averages then property is deemed overvalued; if they are lower, it is undervalued. According to our measure, property is more than 30% overvalued in six of the markets we track, notably in Australia, Britain and Canada.
  •  
  • Explore the data in our interactive chart below (updated on October 6th 2015) and try to spot which market is looking most vulnerable. See full the article on global house prices here.
  • Global Housing Tool    This is really COOL!!!!!
  • Compare global housing data over time with our interactive house-price tool
  • What is more, construction is lagging. The National Association of Realtors, a trade body, has found that new house-building is failing to keep pace with job creation in many cities. For every 12 jobs created builders have historically gained construction permits for ten new homes. Between 2012 and 2014 that number fell to 4.8 permits. Some cities are sizzling again as a result: prices in San Francisco increased by 10% in the year to July, and are up by 75% since 2009.
  • America is still—just—in the category of countries where the housing market remains in recovery. House prices there increased by 4.7% in the 12 months to July, according to the Case-Shiller national index. Prices have now risen by 25% from their 2011 trough, but still remain 7% from their 2007 peak. The Economist measures national affordability by comparing prices to the long-run average of their relationship with rents and income. On this basis, we reckon house prices in America are broadly at their fair value.
  • Not for long, perhaps. Activity is buoyant: sales of existing homes increased by 6.2% on the previous year. With 30-year fixed-rate mortgages at record lows, the effect of an interest-rate rise on the housing market is expected to be minimal.
  • What is more, construction is lagging. The National Association of Realtors, a trade body, has found that new house-building is failing to keep pace with job creation in many cities. For every 12 jobs created builders have historically gained construction permits for ten new homes. Between 2012 and 2014 that number fell to 4.8 permits. Some cities are sizzling again as a result: prices in San Francisco increased by 10% in the year to July, and are up by 75% since 2009.
  • Other countries’ housing markets are already well above fair value. Taking an average of our two measures, houses are more than 30% overvalued in six markets. Britain is perhaps the most supply-constrained of this group. Although prices have risen by 35% since their trough in January 2009, housebuilding is failing to respond. Just 140,000 homes were completed in the year to March 2014, some 25% below the long-term norm. That puts a firmer floor under prices than in other notably overvalued markets such as Canada and Australia.
  • Hong Kong is the most extreme example of soaring prices and limited supply. Property prices in the territory appreciated by 21% in the year to June, and have now doubled in five years. Since 2009 the regulator has introduced seven rounds of “macro-prudential” measures designed to cork the rises. Its latest, in March this year, reduced the average loan-to-value ratio for new mortgages from 64% to just 52%. In practice, China’s recent stock market crash is likely to be a bigger dampener on demand, as wounded mainland investors put off new purchases.
  • As for China’s own housing market, it is one of only five in our index where prices are falling, joining Singapore and a trio of euro-zone countries—France, Greece and Italy. Prices are falling at a slower rate than before, however. The government has been trying to boost the market over the past ten months, cutting interest rates by 1.4 percentage points and relaxing rules on down payments. Prices are now rising on a monthly basis in many cities. In Beijing and Shanghai, they look positively frothy again.

real house priceslong term averagehouse price changes in real termslongterm average

THE Economist tracks the health of housing in 26 markets around the world, encompassing a population of over 3 billion. Prices are now rising in 21 of these markets at a median pace of 4.7% a year. China’s housing market is one of only five countries in our index where prices are falling, joining Singapore and a trio of euro-zone countries—France, Greece and Italy. The government has been trying to boost the market over the past ten months which is now slowly responding.

Explanation This interactive chart uses five different measures • House-price index: rebased to 100 at a selected date • Prices in real terms: rebased to 100 for the selected date and deflated by consumer prices • Prices against average income: compares house prices against average disposable income per person, where 100 is equal to the long-run average of the relationship • Prices against rents: compares house prices against housing rents, where 100 is equal to the long-run average of the relationship  • Percentage change: the percentage change in real house prices between two selected dates

TOKYO | By Tetsushi Kajimoto

Japan export growth slows sharply, raising fears of recession

  •  TOKYO  Japan’s annual export growth slowed to a crawl in September as shrinking sales to China hurt the volume of shipments, raising fears that weak overseas demand may have pushed the economy into recession.Ministry of Finance data showed exports rose just 0.6 percent in the year to September, against a 3.4 percent gain expected by economists in a Reuters poll.That was the slowest growth since August last year, following the prior month’s 3.1 percent gain. The weak yen helped increase the value of exports, but volume fell 3.9 percent, the third straight month recording an annual decline. Wednesday’s data was the first major indicator for September and is part of the calculation of third quarter gross domestic product. A third quarter contraction would put Japan into recession, following the second quarter’s negative GDP result, and could force policy makers to offer further stimulus.”Given this data, the economy probably contracted about an annualized 0.5 percent in July-September. External demand, capital spending and inventory investment were a likely drag, while consumption picked up,” said Koya Miyamae, senior economist at SMBC Nikko Securities.China’s slowdown and soft domestic demand weighed on factory output and the broader economy, although the Bank of Japan saw the effects of China’s slowdown as limited for now, sticking to its rosy growth outlook.Still, weak indicators will keep the central bank under pressure to ease policy again to hit its ambitious 2 percent inflation target next year.Some analysts expect the BOJ to move at its Oct. 30 monetary meeting, when it also issues long-term economic and price projections.

    “Weak exports were within the BOJ’s expectations so this data alone could not be a trigger. But there’s no doubt that pressure will mount on the BOJ to act if weakness persists,” said Taro Saito, senior economist at NLI Research Institute.

    Separate data by the BOJ, which captures trade movements in real terms by eliminating price effects, showed real exports rose 0.2 percent in July-September while real imports grew 2.6 percent. This suggests net exports weighed on third-quarter GDP, said Yuichiro Nagai, economist at Barclays Securities Japan.

  • Bank regulation in China

    Letting go

    China liberalises interest rates at last

    Oct 31st 2015 | Shanghai | From the print edition

  • imagine chins
  • There are strings attached
  • YI GANG, a deputy governor of China’s central bank, mused this week about shopping in Moscow in the 1980s. In the streets around Red Square, he said, visitors could find many big shops with identical low-quality goods. But among the drab displays were a few Yugoslav and Polish stores with better selections. These countries had experimented with competition earlier than the Soviet Union and the results were visible on the shelves of their outposts in Moscow.Banks, Mr Yi suggested, are no different from stores. If governments control them too tightly—as China has long done by dictating the interest rates they pay and charge—banks do not compete with each other and thus fail to develop the range of financial products their customers want and need. So on October 23rd, at the same time as cutting interest rates to support stuttering growth, the People’s Bank of China (PBOC) announced that it was setting banks free. They can now offer depositors whatever interest they like, at least in theory. That removes the last formal restriction on rates.
  • Progress will be gradual, however. The central bank will continue to publish benchmark deposit and lending rates. Although banks are no longer obliged to stick to them, the big, state-owned ones that dominate the financial system tend to hew closely to official guidance. Eventually, the PBOC says (without specifying when), it will stop publishing benchmark rates. Its approach would then resemble that of its counterparts in developed countries, which seek to influence rates through their own borrowing and lending, rather than by decree.
  • The full liberalization of interest rates should, in theory, change the face of China’s financial system. By keeping rates well below where they would have settled in a free market, the government transferred wealth from savers to banks and to borrowers. Banks benefited because regulators created a large gap, about three percentage points, between savings and lending rates, guaranteeing them easy profits when turning deposits into loans. This made them rich but lazy. Borrowers did well because lending rates were also held artificially low, providing them with cheap credit to fuel China’s investment boom. But savers—workers stashing a share of their hard-earned wages in their accounts—earned paltry returns.
  • Progress will be gradual, however. The central bank will continue to publish benchmark deposit and lending rates. Although banks are no longer obliged to stick to them, the big, state-owned ones that dominate the financial system tend to hew closely to official guidance. Eventually, the PBOC says (without specifying when), it will stop publishing benchmark rates. Its approach would then resemble that of its counterparts in developed countries, which seek to influence rates through their own borrowing and lending, rather than by decree.
  • benchmark lending rates
  • Indeed, the PBOC is already moving in that direction. The seven-day bond repurchase rate (in effect, the interest it charges financial institutions that borrow cash for a week, using bonds as collateral) used to be very volatile. Recently, the central bank has managed to flatten it out (see chart), creating what appears to be an anchor for short-term rates. The PBOC is certainly not bowing out altogether.From the print edition: Finance and economics
  • CHINA SYNDROME HITS TRADE POWERHOUSES

  •  
  • “Weak exports were within the BOJ’s (Bank of Japan) expectations so this data alone could not be a trigger. But there’s no doubt that pressure will mount on the BOJ to act if weakness persists,” said Taro Saito, senior economist at NLI Research Institute.
  • Still, weak indicators will keep the central bank under pressure to ease policy again to hit its ambitious 2 percent inflation target next year.
  • “Given this data, the economy probably contracted about an annualized 0.5 percent in July-September. External demand, capital spending and inventory investment were a likely drag, while consumption picked up,” said Koya Miyamae, senior economist at SMBC Nikko Securities.
  •  Ministry of Finance data showed exports rose just 0.6 percent in the year to September, against a 3.4 percent gain expected by economists in a Reuters poll.

    Economic rebalancing seen amid weak growth

    By ZHENG YANGPENG (China Daily)Updated: 2015-10-20 07:31

  • Third-quarter GDP expansion the slowest since 2009, but analysts see hopeful signals

China’s economy grew at its weakest pace in six-and-half years in the third quarter, but beyond the headline number, analysts see signs of rebalancing.

GDP growth in the third quarter beat market expectations slightly, expanding by 6.9 percent, the National Bureau of Statistics said on Monday.

Quarter-on-quarter, the economy grew by 1.8 percent, unchanged from the second quarter.

However, the expansion is the weakest since the first quarter of 2009, with Sheng Laiyun, spokesman for the bureau, attributing the slowdown to weak external demand and a reduction of inventory in traditional industries such as cement and steel.

But rebalancing is evident, and while traditional growth engines sputter, consumption and services are holding up, offsetting the slack.

Industrial output in September slowed further to 5.7 percent from 6.1 percent in August, while fixed-asset investment growth-a key driver of the economy-fell further to 10.3 percent in the first nine months.

Real estate investment was a particular drag on the economy, slowing to 2.6 percent in the first nine months, down from 12.5 percent recorded in the same period a year ago.

For the first time, service industries comprised more than half (51.4 percent) of GDP, 10.8 percentage points ahead of manufacturing.

From January to September, spending on consumption contributed 58.4 percent of growth, compared with 49.1 percent a year ago. Retail sales strengthened from 10.5 percent in July to 10.9 percent in September.

Sheng said: “The forces that prop up the economy and drag it down have reached a new equilibrium. The ‘propping-up’ forces include ongoing industrialization and urbanization, the untapped hinterland regions, and the upgrading of consumption.”

Premier Li Keqiang said on Monday that expansion of 6.9 percent is in line with the government’s annual growth target.

“The Chinese economy is running smoothly … the government has provided adequate employment. …Our goal to achieve around 7 percent annual growth this year can be achieved, and that will provide a stable outlook for the market,” Li said.

Tom Orlik and Fielding Chen, Bloomberg economists, noted that growth had avoided a hard landing because “a resilient service sector shrugged off the stock market crash and offset continued weakness in industry”.

Zhu Haibin, chief China economist at JPMorgan, said: “We expect that the ‘two-speed economy’ phenomenon will continue, in that service sector growth will continue to outperform the manufacturing sector. The manufacturing slow-down is the bigger problem for the Chinese economy in the near term.”

Economists cited accelerated loan growth as evidence that economic expansion may stabilize in coming months.

Most economists expect the central bank to cut interest rates by another 25 basis points and to lower the reserve requirement ratio by 50 to 100 basis points by the end of the year.

Reporting by Tetsushi Kajimoto; Editing by Eric Meijer)

Chinese, foreign executives expect yuan to become fully convertible in five years

By Chen Jia (chinadaily.com.cn)Updated: 2015-10-16 16:41

Global financial services providers expect the Chinese currency can achieve full convertibility in about five years, a report from the Economist Intelligence Unit said on Friday.

The report, titled “A delicate stage: The future of the renminbi as a global investment currency”, surveyed more than 200 senior executives from financial institutions both in China and abroad about the long-term future of the yuan as an investment currency.

Around 63 percent of respondents in China and 78 percent from overseas think that the yuan will become fully convertible and tradable without restrictions in five years’ time.

Majorities of both groups believe it will take slightly longer, seven to 10 years, for the yuan to become a global investment currency, said the report.

According to the British think tank, 60 percent of respondents in China believe the yuan will surpass the US dollar as the world’s most commonly used currency within the next decade.

This research, sponsored by UK Trade and Investment, also highlights the remaining challenges financial institutions face in addressing regulatory change and legal uncertainty.

“Despite recent market events, global financial services firms see onshore equities as one of the fastest growing international yuan business areas over the next three years,” it said.

Wu Chen, editorial director of the Economist Global Business Review, pointed that financial service companies expect their yuan business and revenues to soar.

Sherry Madera, minister counselor, director of Financial and Professional Services, UKTI China, said that “Financial institutions are striving to keep up with market challenge in China, but also need to make proactive changes to their existing operations to prepare for the inevitable increased role the yuan will play in global investment activity.”

“In the UK we have already seen recognition of this, with increasing numbers of partnerships between UK and Chinese firms and an open business environment that fosters innovation,” she added.

Crowds walk down Nanjing Road East in Shanghai, China, on Saturday, Oct. 1, 2011. China’s economy is entering a ‘new normal’ of slower, sustainable growth. (Qilai Shen/Bloomberg)

HELEN WONG

How Canadian business can profit from China’s new normal Add to …

HELEN WONG

Contributed to The Globe and Mail

Published Friday, Oct. 16, 2015 5:00AM EDT

Last updated Friday, Oct. 16, 2015 5:00AM EDT

Helen Wong is chief executive officer for Greater China at the Hongkong and Shanghai Banking Corp. Ltd. and member of the board of directors for HSBC Bank Canada.

After decades of supercharged growth, China’s economy is now growing at a more moderate pace. But given its sheer size, even less-than-rapid growth generates plenty of opportunities for Canadian corporations that cater to the changing needs of the world’s second-largest economy.

China’s economic transformation over the past 35 years has been rapid, far-reaching and multifaceted.

In 1978, the year before Beijing began to reform and open up the Chinese economy, the country was home to 22 per cent of the world’s population, but was responsible for just 5 per cent of the world’s economic output. By 2014, its share of the global population had slipped to 19 per cent, but its share of global gross domestic product had soared to 13 per cent.

Over the same period, millions in China left their farms for jobs in the cities. While agriculture’s share of the economy has fallen from around 30 per cent to less than 7 per cent, that of services has doubled to nearly 50 per cent

Many of China’s 1.36 billion citizens have become wealthier as a result. As recently as 2000, just 4 per cent of China’s urban households were considered middle-class. By 2012, that share had soared to 68 per cent.

Although Chinese private consumption as a percentage of GDP is much lower than that of most other major economies, it has been rising rapidly. Last year, U.S. online sales on Black Friday and Cyber Monday, at a combined $4.2-billion, were dwarfed by those in China on Nov. 11, better known as “Singles Day.” Chinese shoppers spent $9.3-billion that day, three times more than just two years earlier.

These changes have brought tremendous opportunities for foreign businesses, which, in the decades after China opened up to global trade and investment, seized on the country’s low-cost manufacturing prowess to source and manufacture goods for markets around the world.

From 2008 to 2013, the value of Canada’s exports to China increased at an average annual rate of 14.4 per cent, while the value of Canada’s imports from China rose an average of 4.3 per cent each year. China is now Canada’s second-largest source of imports as well as its second-largest export market. However, China-Canada bilateral trade accounts for only a small part of both countries’ total foreign trade, so there is room for growth.

Canadian commodity exporters, in particular, benefited from China’s ravenous appetite for metals and other raw materials and energy. China’s cooling growth has dulled that demand of late, but this does not mean that business opportunities have dried up.

The “new normal” in China means more realistic, sustainable expansion, where the emphasis is on the quality of growth, rather than its sheer speed. The goal is to reduce the old reliance on exports and low-value-added manufacturing, and increase the role of domestic consumption, private-sector activity and services, which now make up a bigger part of the economy than manufacturing.

While old-style manufacturing will not disappear, the government is making big efforts to move China’s manufacturing capabilities to the next level. Policies such as “Made in China 2025,” announced in May, promote advanced industries such as information technology, robotics, aerospace, railways and electric vehicles.

This presents opportunities for Canadian business.

Take urbanization. Despite the massive migration to China’s cities, the urbanization rate lags that of other countries at similar levels of development. The government’s target is to have 60 per cent of China’s population living in cities by 2020.

That means a continued, big need for investment in urban infrastructure – from subways, water-treatment systems and waste-management facilities to building technologies and airports.

Bombardier, for example, is close to sealing an order from a Chinese lessor for its biggest-ever jet. The company is forecasting the need for 2,450 commercial aircraft in China – deemed a “major opportunity” – in the 60-to-150-seat segment over the next 20 years, with deliveries to Greater China representing 19 per cent of the world’s total demand.

On the consumption front, the stars remain aligned for robust growth for many years to come.

The days of double-digit economic growth may be over, but salaries are still rising. While consumer appetite for some goods or brands may have dropped off, a lot of cash is simply shifting to other product categories or will be deployed a little later.

As Chinese consumers become wealthier, they will continue to buy iPhones, send their kids to universities in the West, travel to Toronto or Vancouver. China has emerged as Canada’s second-largest source of overseas visitors this year.

The recent stock market volatility has not put a stop to consumer spending. Retail sales data for August showed an increase of 10.8 per cent from a year earlier – more than analysts had expected.

Meanwhile, Beijing’s goal of boosting private-sector activity, increasing the service sector and raising living standards will bring new business opportunities in sectors such as financial services and health care.

Health-care spending alone is estimated to grow to $1-trillion in 2020 from $357-billion in 2011, according to McKinsey – and the government has signalled that foreign investment will have a role to play.

China is not an easy market, and the days when companies could record easy, double-digit annual growth are over. Foreign companies doing business in China have to be nimble, to be able to adapt to the constantly changing spending preferences of Chinese consumers and to be prepared to deal with periodic stock-market volatility. For those who do so, China will continue to be a must-be location and key export market.

Debt in China

Deleveraging delayed

Credit growth is still outstripping economic growth

Oct 24th 2015 | SHANGHAI | From the print edition The Economist

IN MOST respects, double-digit growth is a relic of the past for China. In the third quarter the economy grew by just 6.9% year-on-year according to official data, and probably by a percentage point or two less in reality. Yet bank loans increased by 15.4% in the third quarter compared with the same period in 2014. Having released a torrent of credit to buoy the economy during the financial crisis, China was supposed to have started deleveraging by now. Instead, banks are continuing to pump debt into the economy, while the authorities, apparently worried about the damage a contraction in credit might do, coax them on.

Growth in credit has at least slowed in recent years. A broad measure is “total social financing” (TSF), which encompasses bank loans, corporate bonds and a range of shadowy loan-like products. TSF growth soared to 35% in 2009 when the government called on banks to open the taps and support the then-faltering economy. It has since decelerated: it rose by 13% in the third quarter from a year earlier. The problem, though, is that nominal GDP growth has fallen much

This means that China’s overall debt-to-GDP ratio is continuing its steady upward march (see chart). Debt was about 160% of annual output in 2007. Now, China’s debt ratio stands at more than 240%, or 161 trillion yuan ($25 trillion), according to calculations by The Economist. It has risen by nearly 50 percentage points over the past four years alone, with slowing growth only serving to magnify indebtedness.

A rapid increase in debt in a short space of time has historically been a good predictor of financial trouble, from Japan in the 1990s to southern Europe in the 2000s. But there is no level that automatically triggers crises. Since most of China’s debts are held within the government-controlled bits of its economy (state-owned firms are the biggest debtors and state-owned banks their biggest creditors), the country has the means to avoid an acute crisis. It can, in effect, roll over bad loans as they come due or abstain from calling them in. However, although that spares the economy short-term pain, it leaves it with a chronic ailment. Ever more credit is needed to sustain growth. Loans that should have gone to sprightly companies with promising new ideas go instead to corporate zombies.

There are worrying signs that China is heading in this direction. In the six years before the global financial crisis, each yuan of new credit brought about five yuan of national output. In the six years since the crisis, that has fallen to just over three yuan. It is not hard to find examples of companies on life support that in other countries might have perished by now. In September China National Erzhong Group, which makes smelting equipment, received a bail-out from its parent. Investors in Sinosteel, a metals conglomerate, are now hoping for the same after it delayed payment on a bond this week.

It is not too late for China to bring its debts under control. Regulators have taken steps in the right direction. They have obliged local governments to provide better data on their debts and have forced banks to bring more of their shadow loans onto their balance-sheets, providing a clearer picture of liabilities. One reason that banks have been issuing loans so quickly this year—faster than overall credit growth—is that they are replacing shadowier forms of financing. China has also used both monetary easing and a giant bond-swap programme for local governments to reduce the cost of servicing debts. The weighted interest rate on existing liabilities has fallen from roughly 6% to 4.5% this year.

But some worry that these measures are just pushing risks elsewhere. A bond-market boom is the newest concern. Net bond issuance in the first nine months of 2015 reached 8.7 trillion yuan, up 67% from the same period a year earlier. At the same time, the gap between funding costs for companies and the government has narrowed sharply. The one-year yield on government bonds has fallen by nearly a percentage point over the past year, whereas corporate yields have fallen by 1.5 percentage points. In other words, investors are lending to companies as if they were becoming safer borrowers, even as their liabilities increase. Yang Chen of Bank of America Merrill Lynch notes that some investors are buying bonds with borrowed cash, believing that the government will wade in to spare them from any big defaults—as it has done in the past. If that impression persists, China’s debt mountain could grow bigger still.

The five-year plan

Command performance

The Communist Party is about to set its goals for 2020

Oct 24th 2015 | SHANGHAI Reprint from The Economist

IN 1953, taking cues from their Soviet advisers, Chinese leaders launched their first five-year plan. They charted a course for rapid industrialization of the then-agrarian country. Now they are drafting their 13th such document. It will show how much has changed. Its main message will be that industrialization has run its course and that China will have to find a new engine of growth. But the very existence of the plan (to run from 2016 to 2020) is indicative of how, in economic policymaking, much has stayed the same.

China will publish the first outline after an annual meeting of the Communist Party’s Central Committee at the end of October. It will be very different from the party’s early plans. It once set specific production targets for steel and grain, among other things—hallmarks of the central planning that led China so astray. Since the early 1980s, the role of the plans has been relaxed. They clarify medium-term policy priorities, but are not blueprints that must be adhered to slavishly.

Yet the plans are still important, not least because of the attention they receive. “They are large neon signs of where the party wants to take the country,” says Scott Kennedy of the Centre for Strategic and International Studies, a think-tank in Washington. Local officials scurry to adjust their rhetoric and policies to fall in line with the plan. Banks direct capital to the industries the plan seeks to boost. Companies, both state-owned and private, alter their business models accordingly.

In recent years, the plans have come to encompass a wider range of priorities. Almost all the binding targets in the current one relate to the environment or social welfare. Officials were obliged to build 36m units of public housing, limit energy use and expand primary-school enrolment—all of which they accomplished, albeit sometimes by fiddling the numbers. Purely economic targets such as income growth and job creation were considered predictive, not mandatory.

For all that, the most-watched part of the new plan will still be its target for GDP. The current one aims for average annual growth of 7% from 2011 to 2015. In reality, it is likely to be about 7.8%. In the past, targets were often set well below the potential growth rate. That could change with the new plan. State media have suggested the new target will be 6.5%, beyond what many forecast for the coming years.

This could have big implications for economic policy. The farther growth slips below target, the more the government will be under pressure to stimulate the economy or, failing that, to doctor data. Given China’s already-heavy debt burden (see article) and analysts’ abiding cynicism about official statistics, neither outcome would be welcome. Some economists have called on China to abandon its growth target altogether, to give itself more breathing space. But Kuang Xianming of the China Institute for Reform and Development, a think-tank, says the GDP figure will remain in the plan, because it serves as a lodestar for all other economic policies.

There will be plenty of other targets to aim for. Just over 70m people still live under the official poverty line; the plan is likely to include a pledge to expand welfare payments to lift them all above it. The government has already started to relax its one-child policy; some believe the aim in the next five years will be to abolish it altogether. There will probably be objectives for reductions in carbon emissions, investment in high-tech industries and the building of megacities. Full details will not be released until March, when China’s parliament approves the plan.

Perhaps the most intriguing element is one that will remain unmentioned by state media: the historic milestone of the new document. Such plans are one of China’s cherished inheritances from the Soviets. But the Soviet Union collapsed before it was able to see its 13th one to completion. Beating the Soviets may provide China’s party with a bigger-than-usual incentive for the rest of the decade.

Taiwan Manufacturing sector expected to contract this year

By Lisa Wang  /  Staff reporter

Staff members of the Industrial Economics and Knowledge Center yesterday hold a news conference in Taipei, predicting that the recovery of Taiwan’s manufacturing industry would be slow next year.

Photo: Wang Meng-lun, Taipei Times

The production value of Taiwan’s manufacturing sector is expected to contract 7.36 percent on an annual basis this year as demand from China slows, the Industrial Economics and Knowledge Center (IEK) said yesterday.

The decline would be the steepest since the global financial crisis in 2009 and the forecast is far greater than the 1.74 percent decline IEK projected in August.

“China’s economic weakness has afflicted its global trade partners, especially Taiwan, South Korea and Southeast Asian countries,” IEK senior researcher Peter Chen (陳志強) told a news conference.

China on Monday reported 6.9 percent annual growth in GDP for last quarter, dipping below 7 percent for the first time in six years.

IEK expects Taiwan’s manufacturing sector’s output to expand just 0.87 percent from an estimated NT$17.59 trillion (US$540.26 billion) this year to NT$17.75 trillion next year.

“As Taiwan is overly dependent on China, we do not expect a V-shaped recovery,” Chen said. “The growth next year will mainly come from the US and Europe as the economies stabilize.”

Chen said that the local manufacturing sector would be unlikely to return to growth until the second quarter of next year, while the nation needs to solve a long-term problem of upgrading its industry structure to higher-margin businesses.

The production value of information technology hardware, a major pillar of Taiwan’s economy, is expected to grow 1.9 percent next year to NT$6.1 trillion, an improvement from an estimated 0.6 percent contraction this year, Chen said.

However, production value of the basic metal and machinery segment, the second-biggest contributor to manufacturing output, is expected to shrink by 2.2 percent to NT$4.61 trillion next year, compared with this year’s 9.2 percent decline, IEK said.

The center blamed steel overcapacity in China for the slow recovery of the basic and machinery segment, and industry players agree.

“The machine tool industry’s outlook is bleak. We expect the decline to exceed IEK’s forecast in the fourth quarter and the whole year of this year,”said Carl Huang (黃建中), secretary-general of the Taichung-based Taiwan Machine Tool and Accessory Builder’s Association.

“We do not expect to see a significant improvement until the third quarter of next year,” Huang said.

China is the biggest export destination for Taiwanese machinery goods, receiving more than 30 percent of the sector’s overseas shipments.

The production value of the machinery tool sector is expected to drop by 10.4 percent to NT$135.2 billion this year and decline by another 2.1 percent next year to NT$132.5 billion, IEK said.

The petrochemical sector is expected to see growth in production value of 3 percent annually to NT$4.61 trillion next year, reversing an annual decline of 16.7 percent this year, thanks to steady global crude oil prices, the center’s data showed.

Taiwan’s industry, including tourism, is expected to be flat in terms of production value next year due to the sluggish economy.

IEK forecast that the industry’s production value could rise 0.6 percent to NT$2.43 trillion next year after growing 0.5 percent this year.

South Korea’s economy

Why a big slump in South Korea’s exports matters

The steepest on-year drop in trade since 2009 is a mark of sagging global demand

Sep 1st 2015 | SEOUL | Business and finance

A rarer sight these days

NEW trade figures from South Korea on September 1st surprised even the gloomiest of economic forecasters. The country’s exports shrank by the largest annual amount in six years, down 14.7% last month from a year earlier to under $40 billion, according to the ministry of trade, industries and energy. Few analysts had expected more than a 6% drop: though exports have dropped every month since January, they declined just 3.4% in July in annual terms. Morgan Stanley, an investment bank, tempered its growth forecast for South Korea down to 2.3% from 2.5% for the year.   Exports account for roughly half of South Korea’s GDP—and a quarter of all those go to China, its biggest trading partner. South Korea has been struggling with the rise of its currency, the won, against the Japanese yen in key export markets; now China’s successive devaluations have started to bite. Provisional figures released today showed that South Korean car shipments dropped steeply in August, by nearly a third. Though exports of smartphones rose, fast-rising Chinese handset makers are increasingly vying with Samsung Electronics of South Korea for global market share (its profits have dropped for five consecutive quarters). A weaker yuan is also keeping holidaying Chinese shoppers away—just as the country attempts to woo them back after an outbreak of Middle East Respiratory Syndrome (which infected 186 and killed 36) hit South Korea in May. Low global oil prices are also behind the startling figure. Petroleum products are a key South Korean export, and their price has dropped by over 40% from last August. The ministry of trade today pointed to this distortion to downplay concerns that falling exports might presage serious weakness in the domestic economy; by volume, it said, total exports actually grew by 3.8% in August from a year earlier. The ministry also argued that local manufacturers ought to be more profitable given the lower cost of importing raw materials. Only last month the finance minister, Choi Kyung-hwan, argued that a weak yuan could be a boon: if Chinese exports increased, so too would demand for intermediate goods, such as electronic components, which make up the bulk of South Korea’s exports to China. Market watchers are less sanguine. Frederic Neumann of HSBC, a bank, says the plunge is “pretty serious”, not least because South Korea has “long been a reliable bellwether” for global trade. South Korean manufacturing sits at the top of the production chain, he says: a big chunk of its exports do indeed go into other finished goods, like Chinese smartphones and American laptops. But if demand slows there, so do requests for chips and screens. That means that Korean macroeconomic data “picks up very early changes in the global industrial cycle”. Neither is a slowdown in China the only source of export weakness; South Korea’s exports to the euro area plunged by 21%, more than twice the decline in exports to China. Recent figures show that the economy expanded by a feeble 0.3% from April to June compared to the previous quarter: its weakest gain since 2009. The government has already cut its growth target from 3.8% to 3.1% since January; for its part the Bank of Korea has been cutting its key interest rate, now down to an all-time low of 1.5%. Ever more analysts expect South Korea’s central bankers to shave it again soon, and perhaps even as early as next week, when they gather for a policy meeting on September 11th. If South Korea’s bellwether status is anything to go by, central bankers elsewhere ought to be paying attention as well.

 China, Japan and South Korea

The first meeting of foreign ministers in three years heralds a milder spell

Mar 28th 2015 | BEIJING, SEOUL AND TOKYO | From the print edition The Economist

THE prospects for a summit between the leaders of China, Japan and South Korea had appeared bleak since an annual chin-wag, begun in 2008, was called off in 2013 over worsening territorial spats (between China and Japan, and between South Korea and Japan) and over accusations by China and South Korea that Japan was not facing up to its wartime past. Yet on March 21st the countries’ foreign ministers met for the first time in three years and agreed to push for a resumption of trilateral summits as soon as “convenient”. In a fraught region, this counts as progress.

In the meeting in Seoul, the South Korean capital, China’s foreign minister, Wang Yi, claimed that three-way co-operation had been put “back on a normal track”. It was the result of diplomatic shuttling and a cooling of tempers. In particular, a studiously sullen handshake in Beijing in November between President Xi Jinping of China and Shinzo Abe, Japan’s prime minister, helped unfreeze relations between those two countries after China had challenged Japan’s control of the Senkaku islands (Diaoyu in Chinese) and Mr Abe had visited Tokyo’s Yasukuni shrine with its militarist overtones. Chinese incursions into the waters surrounding the Senkakus have not decreased. But at least the two sides are discussing a military hotline and the incursions follow a choreographed routine. On March 19th they held their first high-level security talks in four years. More broadly, day-to-day relations between them have improved dramatically.

The talks in Seoul have now evinced a broader recognition that grievances must not be left to overshadow essential economic relationships. Common ground was found on disaster management, tourism, trade, the environment and ageing societies. A senior Japanese official said that President Park Geun-hye of South Korea had shown leadership in helping to broker the meeting. Strikingly, the three ministers also came up with a tripartite statement on North Korea’s threatening nuclear ambitions.

The foreign ministers’ meeting in Seoul was welcome, but the contentious issues remain, especially over matters of history in this, the 70th anniversary year of the end of the second world war. Mr Wang described discord between China and Japan over history as “a ridge that cannot be sidestepped”. Perhaps, but building the ridge higher, which China is doing by planning a provocative military parade in September, does not help. Nor do the historical evasions of those around Mr. Abe, and sometimes of the prime minister himself. They include questioning the definition of “invasion” to refer to Japan’s war in China from 1937. (What else was it?)

Yet at least Mr. Abe has pledged to stand by previous official anniversary apologies. He has appointed a panel to come up with some consensus on history matters in time for his expected statement on August 15th. The panel’s members expect no consensus, but they do hope their deliberations will foster a wider public debate.

As for the expected statement, that is up to Mr. Abe alone. Shen Dingli of Fudan University in Shanghai says that China is unlikely to take bolder steps, including towards a three-way summit between Mr. Xi, Mr. Abe and Ms. Park, until it hears what Mr. Abe has to say. America also wants to know. It may get a better sense when he visits Washington at the end of April, becoming the first Japanese prime minister to address a joint session of Congress. The template of his speech is likely to be one he delivered to Australia’s Parliament in Canberra in November, in which he offered his “sincere condolences” for the horrors of the war. But it is easier to say sorry to your friends.

America is certainly pleased by improving ties between its two Asian allies, South Korea and Japan. Tension between them, it says, has been a “strategic liability”. Yet Ms. Park is vacillating on another front that concerns America: accepting its advanced anti-missile defense system (known as THAAD, or Terminal High Altitude Area Defense). Though ostensibly designed to counter North Korean aggression, China has expressed displeasure to South Korea—fearing it may also be used to contain China. Despite their tentative rapprochement in Seoul, there is much still trying to pull Japan, South Korea and China apart.

India expected to grow 7.5% in FY16, higher next year: Moody’s

By PTI | 2 Nov, 2015, 06.05PM IST

NEW DELHI: Projecting stable growth rate for India, Moody’s Investors Service today said the economy would grow at 7.5 per cent in the current fiscal and improve marginally in the following year. “We expect that India’s real GDP will grow at 7.5 per cent in the financial year ending March 31, 2016 (FY16) and 7.6 per cent in FY17. “These growth rates would be slightly faster than the 7.4 per cent recorded in FY15 and substantially better than from FY12 to FY14,” it said in a r ..

Read more at: http://economictimes.indiatimes.com/articleshow/49631349.cms?utm_source=contentofinterest&utm_medium=text&utm_campaign=cppst

Trans Pacific Partnership- a Good Deal for Canada’s Forest Industry

TPP

From National Post Oct 6, 2015

Markets for Forestry and Value-added Wood Products Department Foreign Affairs and Trade

The Trans-Pacific Partnership is the most comprehensive trade agreement in the world. The TPP will help deepen Canada’s trade ties in the dynamic and fast-growing Asia-Pacific region while strengthening our existing economic partnerships with our partners in the North America Free Trade Agreement and across the Americas. It currently comprises 12 countries (Australia, Brunei, Canada, Chile, Japan, Malaysia, Mexico, New Zealand, Peru, Singapore, the United States and Vietnam), representing a combined market of nearly 800 million people and a gross domestic product (GDP) of $28.5 trillion. With the TPP, Canada has now concluded free trade agreements with 51 nations, ensuring Canadian businesses have access to over 60 percent of the world’s economy. The TPP and trade agreements with the European Union and South Korea make Canada the only G-7 nation with free trade access to the United States and the Americas, Europe, and the Asia-Pacific region.

In 2014, Canada’s forestry sector contributed close to $24.9 billion to Canada’s GDP and employed nearly 237,000 Canadians, most of them in jobs that tend to be highly skilled. Canada is one of the world’s largest producers and exporters of softwood lumber. By value, Canada is also the world’s leading exporter of newsprint and wood pulp and the fifth-largest exporter of wood panels.

Most of Canada’s wood is turned into value-added products that are sold around the world. These include coniferous lumber, plywood made of other woods, and window and door frames. The TPP Agreement will create new opportunities to further develop existing and new markets in the dynamic and growing TPP region.

TPP markets

Tariffs imposed by certain TPP countries on forestry and value-added wood products are preventing Canadian exporters from achieving their full export potential.

Japan has tariffs of up to 10 percent on forestry and value-added wood products. On forestry and value-added wood products, Vietnam applies tariffs of up to 31 percent, Malaysia of up to 40 percent, Australia and New Zealand of up to 5 percent, and Brunei of up to 20 percent.

The TPP will eliminate tariffs on forestry and value-added wood products and create new opportunities in key markets such as Japan, Malaysia and Vietnam.

Canada is currently the 4th-largest supplier of forestry and value-added wood products to Japan, with average annual exports of $1.7 billion from 2012 to 2014.

Under the TPP Agreement, Canada’s forestry and value-added wood products industry will be able to capitalize on the business opportunities created by the growing needs of the Japanese market, including products such as lumber, oriented strand board, worked coniferous and non-coniferous wood, builders’ joinery, plywood and veneer panels. Canada’s exports in this sector will also now have an advantage over competitors outside of the TPP region (for example, the European Union, Russia and China).

By generating opportunities for Canadian forestry and value-added wood products, the TPP will create advantages for Canadian businesses and workers.

Trade snapshot

From 2012 to 2014, Canada’s exports of forestry and value-added wood products to TPP countries were worth, on average, $20.4 billion per year.

TPP Forest product trade

Forestry and value-added wood products exports from Canada to TPP countries (2010-2014) (millions of Canadian dollars)

  • 2010 (19,348.6)
  • 2011 (18,734.4)
  • 2012 (18,140.9)
  • 2013 (20,496.5)
  • 2014 (22,652.1)

* Source: Global Trade Atlas

TPP Agreement highlights

Examples of Canadian exports of forestry and value-added wood products that will benefit from tariff elimination under the TPP Agreement include:

  • Lumber
    • In Japan, tariffs of up to 6 percent will be eliminated within 15 years.
    • In Australia, tariffs of up to 5 percent will be eliminated upon entry into force.
    • In Brunei, tariffs of up to 20 percent will be eliminated upon entry into force.
  • Builders’ joinery and wood carpentry
    • In Japan, tariffs of up to 5 percent will be eliminated within 10 years.
    • In Vietnam, tariffs of 5 percent will be eliminated upon entry into force.
    • In Malaysia, tariffs of 20 percent will be eliminated upon entry into force.
    • In Brunei, tariffs of 20 percent will be eliminated upon entry into force.
  • Oriented strand board
    • In Japan, tariffs of up to 6 percent will be eliminated within 15 years.
    • In Malaysia, tariffs of up to 20 percent will be eliminated upon entry into force.
    • In Brunei, tariffs of up to 20 percent will be eliminated upon entry into force.
    • In Australia, tariffs of 5 percent will be eliminated upon entry into force.
    • In New Zealand, tariffs of 5 percent will be eliminated upon entry into force.
  • Newsprint
    • In Vietnam, tariffs of 25 percent will be eliminated within three years.
    • In Malaysia, tariffs of up to 10 percent will be eliminated within five years.
    • In Australia, tariffs of up to 5 percent will be eliminated upon entry into force.
  • Uncoated paper and paperboard
    • In Vietnam, tariffs of up to 27 percent will be eliminated within three years.
    • In Malaysia, tariffs of up to 25 percent will be eliminated within 10 years
    • In Australia, tariffs of 5 percent will be eliminated upon entry into force.
  • Carton boxes and packing containers
    • In Vietnam, tariffs of up to 24 percent will be eliminated within three years.
    • In Malaysia, tariffs of up to 25 percent will be eliminated within five years.
    • In Australia, tariffs of 5 percent will be eliminated upon entry into force.
  • Sanitary and household papers
    • In Vietnam, tariffs of up to 25 percent will be eliminated within three years.
    • In Malaysia, tariffs of up to 30 percent will be eliminated within five years.
    • In Australia, tariffs of 5 percent will be eliminated upon entry into force.
  • Printed materials
    • In Vietnam, tariffs of up to 25 percent will be eliminated upon entry into force.
    • In Malaysia, tariffs of up to 20 percent will be eliminated within three years.
    • In Australia, tariffs of up to 5 percent will be eliminated upon entry into force.
  • Plywood and veneer panels
    • In Japan, tariffs of up to 10 percent will be eliminated within 15 years.
    • In Malaysia, tariffs of up to 40 percent will be eliminated within five years.
    • In Australia, tariffs of 5 percent will be eliminated upon entry into force.
    • In New Zealand, tariffs of 5 percent will be eliminated within seven years.
  • Worked coniferous and non-coniferous wood
    • In Japan, tariffs of up to 7.5 percent will be eliminated upon entry into force.
    • In Australia, tariffs of 5 percent will be eliminated upon entry into force.
    • In New Zealand, tariffs of 5 percent will be eliminated within seven years.
  • Sheets for veneering
    • In Japan, tariffs of up to 6 percent will be eliminated upon entry into force.
    • In Australia, tariffs of 5 percent will be eliminated upon entry into force.
    • In New Zealand, tariffs of 5 percent will be eliminated upon entry into force.


Beyond tariffs

The TPP contains strong provisions on non-tariff measures that will help ensure that market access gains in the forestry and wood building products sectors are not undermined by unjustified trade barriers. This will make it easier for Canadians and TPP partners to work together on the development of technical regulations and standards, and help to prevent the introduction of new technical barriers to trade, including in the areas of forestry and wood building products.

The TPP also establishes a Sanitary and Phytosanitary (SPS) Committee, where SPS-related issues and concerns can be discussed by experts to facilitate trade, enhance bilateral cooperation and resolve issues at an early stage.

The TPP SPS Chapter also contains provisions on regionalization, equivalence, and science and risk analysis, which is important for forestry exporters, and will help ensure that market access gains are not undermined by unjustified SPS-related trade restrictions.

Advantages of the TPP

The TPP Agreement will give Canadian producers, processors and exporters a competitive advantage over forestry and value-added wood products exporters who are not TPP members (such as competitors in Russia, China, Indonesia, and the European Union), and create a level playing field for Canadian businesses to compete within the TPP.

The TPP Agreement will ensure Canadian businesses’ continued participation in critical North American value chains and generate new opportunities in the dynamic and growing Asia-Pacific region.

New access for Canadian wood products

Imagine a mill that manufacturers and supplies pulp and paper products, including newsprint, to international markets. Under the TPP, such Canadian mills will benefit from the elimination of tariffs on pulp and paper products in several markets with which Canada does not currently have a free trade agreement. For example, tariffs on newsprint of up to 5 percent in Australia will be eliminated immediately upon entry into force, while tariffs of up to 25 percent in Vietnam will be eliminated within three years, and tariffs of up to 10 percent in Malaysia will be eliminated within five years. The enhanced market access will directly benefit these types of operations.

Date Modified:

2015-10-04

Economic and Wood Product News Clippings NE Asia and India Third Quarter 2015

 Economist poll

Reuters UPDATE 1-S&P downgrades Japan, doubts Abenomics can soon reverse deterioration

Bonds | Wed Sep 16, 2015

abe

* S&P cuts Japan to A+, four notches below AAA; outlook stable

* Economic support for sovereign creditworthiness weakens -S&P

* Downgrade follows cuts by rival credit ratings agencies

* Japan struggles to spur growth, little room left for stimulus (Adds analyst quote, detail)

By Tetsushi Kajimoto

TOKYO, Sept 16 (Reuters) – Ratings agency Standard & Poor’s on Wednesday downgraded Japan’s credit rating by one notch to A+, saying economic support for the country’s sovereign creditworthiness had continued to weaken in the past three or four years.

S&P cut its rating on Japan from AA- to A+, which is four notches below its top rating of AAA. The agency raised its outlook from negative to stable.

It was the first Japan downgrade by S&P since January 2011 and came 4-1/2 years after it last lowered its outlook, from stable to negative.

The downgrade brings its Japan rating into line with rival Moody’s Investors Service, which downgraded Japan to A1 in December last year. Fitch Ratings cut its rating on Japan by one notch to A in April.

The yen shrugged off the lowering of the credit rating. It briefly fell but then regained ground.

“We believe the likelihood of an economic recovery in Japan strong enough to restore economic support for sovereign creditworthiness commensurate with our previous assessment has diminished,” S&P said in a statement.

“Despite showing initial promise, we believe that the government’s economic revival strategy – dubbed ‘Abenomics’- will not be able to reverse this deterioration in the next two to three years,” it added.

The world’s third-largest economy shrank in the April-June quarter, and analysts expect any rebound in the current quarter to be modest as private consumption remains weak and China’s slowdown dampens prospects for a solid recovery in exports.

Prime Minister Shinzo Abe’s government aims to return to a primary budget surplus in fiscal 2020 and then lowering the debt-GDP ratio, which is the worst in the world, at around twice the size of the country’s $5-trillion economy.

Abe is putting more emphasis on economic growth and the higher tax revenue it brings, rather than austerity, to achieve the budget-balancing goal.

“S&P’s diagnosis about the uncertain economic outlook means that prospects for fiscal consolidation are becoming uncertain,” said Toru Suehiro, senior market economist at Mizuho Securities.

“Given that monetary and fiscal policies are stretched and it takes time to implement the ‘Third Arrow’ reform, Abe appears unlikely to find a way out of the doldrums any time soon, unless external demand turns for the better miraculously.”

A finance ministry official said it had no plan to issue a statement.

The S&P downgrade came the day after the Bank of Japan stood pat on policy, casting doubt about the central bank’s optimism.

BOJ Governor Haruhiko Kuroda voiced confidence that the economy can weather the hit from China’s slowdown and weak demand in the rest of Asia, suggesting that he sees no immediate need to expand stimulus further. (Editing by Clarence Fernandez)

BOJ Govenor

NewsonJapan.com BOJ chief shows optimistic view about Japanese economy

Kyodo — Sep 15

Bank of Japan Governor Haruhiko Kuroda presented Tuesday an optimistic view of the Japanese economy, saying it is expected to continue recovering though a slowdown in emerging market countries has started to hurt the country’s exports and production.

In standing firm on its massive asset purchases, the BOJ chief said the trend of rising prices has been picking up, but the timing of achieving a 2 percent inflation goal could be delayed from the first half of fiscal 2016 projected earlier by the central bank.

“It is true that developments of crude oil prices would affect (consumer prices) in the short term,” Kuroda said at a press conference after a two-day policy meeting. Japan’s core consumer prices were flat in July from a year earlier.

– See more at: http://newsonjapan.com/html/newsdesk/article/113738.php#sthash.Ll9k2Wxq.dpuf

 Industries | Tue Sep 15, 2015 4:01am EDT

Related: Financials

Reuters UPDATE 1-S&P raises South Korea sovereign credit rating

S Korea standard-poors

* S.Korea sovereign rating up to AA-minus vs A-plus

* Seen as overdue action after raises by other agencies

* Two other agencies raised ratings in recent years (Updates with economist’s comment, detail)

HONG KONG/SEOUL, Sept 15 (Reuters) – Standard & Poor’s raised South Korea’s sovereign currency rating to AA-minus from A-plus, commending the strength of its economic growth, decline in short-term debt component of external borrowings, and reduced foreign indebtedness of its banks.

“(South) Korea will maintain economic growth performance superior to most developed economies in the next three to five years,” the agency said in a statement.

It said the decline in its short-term debt composition and the reduced indebtedness of South Korean banks had cut the risk of a significant deterioration in external financing conditions.

The agency also affirmed the sovereign’s AA-minus local currency rating. The outlook on both ratings is stable.

This was largely seen as an overdue action after the other two of the three major global ratings agencies have already placed South Korea to the same level over the past three years, thus limiting any markets impact, economists said.

“S&P’s upgrade is not a forward-looking decision as markets have already priced it in and the won has been stronger than the other emerging-market currencies,” said Oh Suk-tae, economist at Societe Generale in Seoul.

Still it was the first time that South Korea’s sovereign ratings from S&P, Moody’s Investors Service and Fitch Ratings were set at AA-minus or the equivalent, the highest place that South Korea’s ratings have reached.

The upgrade came amid growing concerns in South Korea that foreign investors may pull out en masse ahead of or right after the U.S. Federal Reserve begins raising its interest rates, possibly later this year.

S&P’s announcement came after local markets ended trading.

“(The upgrade) will provide a foundation for the country to be differentiated from other emerging-market economies among foreign investors even if global market instability materialises in the future,” South Korea’s finance ministry said in a statement.

S&P said South Korea’s exports versus a year earlier have been shrinking for several months, but noted this was in line with the trend in the region. It also said South Korea’s per-capita income would keep rising to top $30,000 by 2018 from around $27,000 seen this year. (Reporting by Umesh Desai in HONG KONG and Choonsik Yoo in SEOUL; Additional reporting by Yeawon Choi; Editing by Eric Meijer)

ReutersSouth Korea takes stab at slaying zombie company menace

Industries | Tue Sep 15, 2015

zombie businesses

* S.Korea to set up first bank-backed restructuring company

* Ailing firms are “festering sores” for economy – regulator

* H1 losses at Daewoo Shipbuilding helped spur action

By Choonsik Yoo and Joyce Lee

SEOUL, Sept 16 (Reuters) – South Korea is getting serious about tackling its “zombie company” problem and will set up its first restructuring firm backed by the government and banks in November, spooked by some huge corporate losses and a darkening economic outlook.

Korea Development Bank (KDB) will also seek to sell some of the 118 non-financial firms it controls, the government said last week – a move seen as part of its new resolve to deal with the issue. About 20 companies controlled by the state-run bank are seen as struggling.

Zombie companies, often defined as firms which require constant bailouts or which don’t make sufficient profit to pay down the principal on their debt, have long plagued South Korea’s corporate landscape.

Large wayward borrowers have frequently survived, with the government and state banks fearful of the job losses likely to accompany a big bankruptcy. But with domestic indicators taking a turn for the worse, China’s growth slowing and U.S. interest hikes looming, key policymakers say failure to take action means Asia’s fourth-largest economy risks damage to its industrial prowess.

“It’s time to respond pre-emptively,” said Yim Jong-yong, chairman of South Korea’s Financial Services Commission, the regulator behind the new restructuring body and KDB’s plans to offload companies.

“We need to help usher in a virtuous circle by making money flow into productive areas and away from non-productive sectors by removing these festering sores,” he told Reuters in an interview.

DAEWOO SHIPBUILDING DISTRESS

While it remains unclear which company the new restructuring body will cut its teeth on, the government is widely seen as having been spurred onto action in part by ugly results at Daewoo Shipbuilding & Marine Engineering.

The recipient of a state bailout some 15 years ago as well as billions of dollars in loans from state-run banks, the world’s largest shipbuilder shocked in July when it swung to a first-half operating loss of about 3 trillion won ($2.5 billion).

The shipbuilder plans to sell non-core assets in the wake of the losses, while the state-run banks are conducting due diligence to determine the cause of the losses and the level of any capital infusion that may be required.

But even without Daewoo Shipbuilding, the restructuring body will have many potential candidates to pick from.

The proportion of South Korean firms deemed “marginal” by the central bank, or not generating enough operating profit to cover interest payments for at least three years, stands at 15.2 percent, steadily worsening from 12.8 percent in 2009 when data was first compiled. The survey covers firms large enough to be subject to an outside audit.

Economic indicators also point to further pain ahead.

The ratio of inventories to shipments at Korean manufacturers jumped in the first half-year to 126.7 percent while factory utilisation dropped to 74.3 percent. Both indicators are set for their worst showing since the Asian financial crisis in 1997/1998.

The new restructuring body will be backed by eight banks, a mix of state and private lenders, and is set to offer up to 2 trillion won in loans. Its initial capital base of around 250 billion won will later be expanded to 1 trillion won.

Similar bodies set up in Japan have had a fair degree of success – cleaning up the balance sheet of flagship carrier Japan Airlines and helping restructure Japan Display Inc – formed from the LCD units of three conglomerates.

Cho Ki-youn, Seoul-based executive director at restructuring consultancy AlixPartners, said the restructuring body needs more firepower if it is to be truly effective.

“Looking back at many large troubled Korean firms, banks lack the expertise in timing, management and operations to say they will hold a company for a long time, fix it then sell it,” Cho said.

“An entity that can handle the restructuring of a big company will be the most desirable outcome.” ($1 = 1,181.2800 won) (Additional reporting by Emi Emoto in Tokyo; Writing by Tony Munroe; Editing by Edwina Gibbs)

UK Telegraph China’s transition is complicated – but the dragon has not lost its fire

Predicting China’s long-term trajectory is vital not just for the global economy, but for the strategies of many businesses

By Vivek Tulpule 8:47AM BST 04 Sep 2015

china_webbanner

China has been the engine room of global economic growth over the past decade. So it is right to ask what the Dragon economy ‘s adjustment to a “new normal” means for the rest of the world.

First we need to assess what the new normal looks like. It does not mean that current economic conditions in China will prevail forever or that there is some future mythical stable state. It means that there will be a process of significant adjustment involving difficult structural reforms, a reallocation of resources, changes to public sector incentives and, inevitably, macroeconomic volatility.

While the transition to a new normal is complex, China’s fundamentals remain strong and it will continue to grow.

Predicting the trajectory of China is not only pivotal to the global economic outlook but it is crucial to the long-term strategy of many businesses, including the mining and metals industry. China is the world’s biggest consumer of iron ore – the key steel-making ingredient and a commodity often viewed as a portent of future economic growth because it is used in heavy­ metal manufacturing and the construction of new buildings.

Jeremy Warner: China has created a monster it can’t control

For a global business like Rio Tinto, which invests in assets with timeframes over decades, maximising shareholder value requires long-term planning. Our allocation of capital across alternative investments is heavily influenced by projected long-term trends in different markets. That’s why what is happening today in China is not as important as the long-term story. When looking at long-term trends it is imperative to see through near term volatility and cycles. At Rio Tinto we review our projections based on detailed primary research, on macroeconomic developments, industry costs, production trends and consumption drivers.

China’s factories will become more capital intensive

Yesterday we reaffirmed our analysis that Chinese crude steel production is expected to reach around l billion tonnes by 2030. This projection is the result of rigorous research conducted on the ground in China, India and other key markets.

Taking this bottom-up approach allows for a deeper interpretation of key trends, policy decisions and inflection points in each sector and region and under different macroeconomic scenarios. Reliance on top-down averages is often misleading in our view.

China is undoubtedly changing but the stunning migration of its population from rural areas to the cities will continue, with 220m new urban residents expected in the next 15 years, compared to the 320m people between the year 2000 and 2015.

That is still the equivalent of the combined populations of both Russia and Germany moving from the countryside into cities. There will be greater emphasis on improving the quality of this urbanisation and it will require more focus on public infrastructure, better public services and reduced pollution.

Construction growth in China will undoubtedly slow but its factories will become more capital intensive as the economy matures and manufacturing becomes more specialised.

Consumption, especially of services, will also form a greater share of economic activity. The net effect of this for China is a trend toward slower but higher quality growth. We see GDP growth trending from current reported levels of 7pc, or perhaps less, toward realised growth of 4pc to 5pc by 2030. Global steel demand is projected to grow by around 2.5pc a year between now and 2030, based on 3pc average global GDP growth a year.

So what are the implications for the leading mining houses and iron ore miners in particular? First, the world will continue to need increasing volumes of our products. Our projection is that the world will require 750 to 800m tonnes of additional iron ore by 2030 – an average increase of about 2pc a year.

AEP: China is in a serious bind but this is not yet a ‘Lehman’ moment

Second, emerging markets other than China will play a much more important role in the demand for iron ore. For example, some 25m people will move to cities in India and the south-east Asian nations such as Indonesia and the Philippines in the next 15 years. We expect demand for steel outside of China to increase by 65pc by 2030 – from 920m tonnes to just over l .5bn tonnes of crude steel.

Third, Chinese demand will remain critically important. Steel production is expected to grow by 1pc a year but that is from a very high base.

Construction growth in China is likely to slow

While China’s growth projections remain strong, its pattern of steel demand is expected to change. Replacement and renewal of capital stock will become much more important, as will exports of finished goods that embody steel.

A key part of the overall demand projection is the growth in exports from China, especially to other emerging markets. As these markets become more advanced, they will need to embark on a sustained process of building their own capital stocks and China will be well placed to export increasing quantities of capital good.

These will include machinery, construction equipment, transport vehicles – all requiring significant quantities of steel.

The nature of China’s buildings will also change. Today the average floor space per capita in China is about 32 square metres but we’re expecting that to grow to around 40 square metres per capita by 2030.

Between now and 2030 we expect a quarter of China’s building stock to be replaced, most involving the replacement of one and two-storey buildings with structures of seven storeys or higher. There is 40pc more steel per square metre in a high-rise building over 20 storeys than in a one to two-storey building.

We model urban residential demand by first projecting income growth on a province-by­ province basis at city level. We then analyse how much steel will be used in each metre of floor space, using a number of factors. For example, more stringent building regulation in China has resulted in 5% to 1O% increases in the steel intensity of buildings every decade.

While the new normal transition is undoubtedly complex and will be volatile, China’s fundamentals are still strong.

Vivek Tu/pule is Rio Tinto ‘s head of economics and markets© Copyright of Telegraph Media Group Limited

FINANCIAL TIMES

September 13, 2015 12:28 pm

China plans shake-up of state-owned enterprises to boost growth

Ben Bland in Hong Kong

china stock market

China has unveiled the much-awaited guidelines for reform of its bloated state-owned enterprise sector as the latest official data show its economy continuing to slow.

The guidance from the State Council, China’s cabinet, calls for a shake-up of SOEs with share sales and management changes planned to reduce losses and improve efficiency, reported Xinhua, the official news agency, on Sunday.

“The guidelines suggest that by 2020, the goals in all the main reform areas should be accomplished, constituting a system that is more suitable to the nation’s socialist-market economy,” said Xinhua. “The SOE system should be more modernized and market-oriented. It should make for higher control, greater influence and SOEs will be more risk-resistant.”

China has more than 150,000 SOEs, employing tens of millions of people in all sectors from banks to hotels and airlines to oil refiners. But while the vast majority are managed by local governments, there is a core of more than 100 large nationally strategic groups, including ICBC, the world’s biggest bank by assets, and China Mobile, the world’s biggest network biggest network by subscribers, controlled by Beijing.

The update from the State Council came as manufacturing and investment statistics revealed further weakening in the world’s biggest economy by purchasing power parity.

Fixed-asset investment, a key measure of the capital spending that has driven China’s economy, grew at the slowest pace since 2000 during the first eight months of the year.

It increased by 10.9 per cent compared with the same period a year earlier, which was lower than the 11.2 per cent forecast by economists. Factory output was also worse than expected, growing by 6.1 per cent year on year in August, compared with the 6-4 per cent forecast by economists.

In 2013, Beijing’s top leaders endorsed a set of proposals designed to make state companies more efficient while maintaining their role as the Communist-led country’s economic backbone.

Investors have been waiting for the detailed guidelines as the economy has slowed further and confidence in the government of President Xi Jinping has been rocked by its erratic response to the recent stock market tumult.

The State Council said that SOEs would be classified as either playing a social or commercial function, to better integrate them with the market economy.

The government will then “actively introduce different investors” and push SOEs for public share sales, although most analysts believe that wholesale privatisations are highly unlikely.

Analysts at ANZ argued last week that this round of SOE reform could be a “game-changer” in China’s economic development.

But they warned that “SOE reform will still be a gradual process” and it is “unlikely that the government will relinquish its tight control and involvement over the SOEs, especially those in strategically important sectors”.

Michael Pettis, a professor of finance at Peking University in Beijing, said that while the proposed SOE reforms might be good in principle, the key to resolving the imbalances in the Chinese economy was ensuring a better allocation of capital.

“What China needs to do is transfer wealth from the state to the household sector, for example by lending more to private enterprises and less to SOEs and local governments,” he explained. “But it’s tough to do so because it means taking away resources from those that have benefited over the last two or three decades.”

Mr Pettis said that while the government’s uncertain handling of the stock market boom and collapse had undermined investor confidence, it was vital for Beijing to “do everything it can” to maintain its remaining credibility. But he added that investors would also have to accept that reform will have its costs.

“Xi’s administration has inherited a country with deep imbalances and enormous amounts of debt,” he said. “There’s no precedent in history for a country resolving those issues without a significant slowdown.”

Printed from: http://www.ft.com/cms/s/O/aff90924-5a01-11 e5-9846-de406ccb37f2.html

© THE FINANCIAL TIMES LTD 2015 FT and ‘Financial Times’ are trademarks of The Financial Times Ltd.

FINANCIAL TIMES

 September 15, 2015 3:18 pm

A new Chinese export – recession risk

Martin Wolf

dragon dance

Is a global economic recession likely? If so, what might trigger it? Willem Buiter, Citi’s chief economist and the Financial Times’ erstwhile Maverecon (willem buiter’s maverecon)

Blogger, answers these questions: “Yes” and “China”. His case is plausible. This does not mean we must expect a recession. But people should see such a scenario as plausible.

Mr. Buiter does not expect world output to decline. The notion here is a “growth recession”, a period of growth well below the potential rate of about 3 per cent. One might imagine 2 per cent or less. Mr. Buiter estimated the likelihood of such an outcome at 40 per cent.

His scenario would start with China. Like many others, he believes China’s growth is overstated by official statistics and may be as low as 4 per cent. This is plausible, if not universally accepted.

It might become even worse. First, an investment share of 46 per cent of gross domestic product would be excessive in an economy growing 7 per cent, let alone one growing at 4 per cent.

 commodity prices

Second, a huge expansion of debt, often of doubtful quality, has accompanied this excessive investment. Yet merely sustaining investment at these levels would require far more borrowing.

Finally, central government, alone possessed of a strong balance sheet, might be reluctant to offset a slowdown in investment, while the shares of households in national income and consumption in GDP are too low to do so.

debt to gdp

Suppose, then, that investment shrank drastically as demand and balance-sheet constraints bit. What might be the effects on the world economy?

One channel would be a decline in imports of capital goods. Since about a third of global investment (at market prices) occurs inside China, the impact could be large. Japan, South Korea and Germany would be adversely affected.

A more important channel is commodity trade. Commodity prices have fallen, but are still far from low by historical standards. Even with prices where they are, commodity exporters are suffering. Among them are countries like Australia, Brazil, Canada, the Gulf States, Kazakhstan, Russia and Venezuela. Meanwhile, net commodity importers, such as India and most European countries, are gaining.

Shocks to trade interact with finance. Many adversely affected companies are highly indebted. The resulting financial stresses force cutbacks in borrowing and spending upon them, directly weakening economies. Changes in financial conditions exacerbate such pressures.

Among the most important are movements in interest and exchange rates and shifts in the perceived soundness of borrowers, including sovereigns. Changes in capital flows and risk premiums and shifts in the policies of important central banks exacerbate the stresses. At present, the most important shift would be a decision by the US Federal Reserve to raise interest rates.

As Warren Buffett said: “You only find out who is swimming naked when the tide goes out.”

According to the Bank of International Settlements, credit to non-bank borrowers outside the US totalled $9.6tn at the end of March. A strong dollar makes any currency mismatches costly. These may start on the balance sheets of non-financial corporations. But the impact will be transmitted via their losses to banks and governments. Thus, reversal of “carry trades”, funded by cheap borrowing, might wreak havoc.

A visible shift is a decline in foreign exchange reserves, driven by deteriorating terms of trade, capital flight and withdrawal of previous capital inflows.

foriegn exchange


This might cause “quantitative tightening”, as central banks sell holdings of longer-dated safe bonds. This is one of the ways that these shocks might be transmitted to the high­ income countries, including even the US. But this also depends on what the holders of the withdrawn funds do with it and on the policies of affected central banks.

What we might see, then, is a series of real and financial linkages: declining investment and output in China; weaknesses in economies dependent on that country’s purchases or on prices set by its buying; and reversals of carry trades and shifts in exchange rates and risk premium that stress balance sheets.

How might policymakers respond? China will surely let its currency fall rather than continue to lose reserves, not least because usable reserves are smaller than headline numbers, which include infrastructure investments in Africa and elsewhere that cannot quickly be sold. The policy space of other emerging economies will be forced to adjust to these shocks rather than resist them.

Meanwhile, the policy choices of high-income countries are restricted: politics has almost universally ruled out fiscal expansion; the intervention rates of central banks are near zero; and, in many high-income economies, private leverage is still quite high. If the slowdown were modest, nothing much might be done. The best response to a big slowdown might be “helicopter money”, created by the central bank to stimulate spending. But its use seems quite unlikely. The conventional rules.

In brief, a global growth-recession scenario “made in China” is perfectly plausible. If it were to happen, a decision by the Fed to tighten now would come to look downright foolish. We are not talking about the sort of disaster that accompanies a global financial crisis. But the world economy will remain vulnerable to adversity until China has completed its transition to a more balanced pattern of growth, and the high-income economies have recovered from their crises. That is still far away.

martin.wolf@ft.com

Printed from: http://www.ft.com/cms/s/0/486bc 716-5af0-11e5-9846-de406ccb37f2. htmI

© THE FINANCIAL TIMES LTD 2015 FT and ‘Financial Times’ are trademarks of The Financial Times Ltd.

FINANCIAL TIMES

 September 16, 2015 12:29 pm

Doubts rise over China’s official GDP growth rate

Josh Noble in Hong Kong

Chinese GDP growth

The view that China is growing far slower than official figures show is increasingly going mainstream, with big global investors among those now basing decisions on a rate of about 5 per cent.

According to government statistics China’s economy grew at an annual pace of 7 per cent in the second quarter of this year, in line with Beijing’s target for the year and the World Bank estimate of 7.1 per cent.

However, doubts have long lingered about the veracity of Chinese economic data, with many analysts believing them to be understated during times of rapid growth and overstated during the current slowdown. A strategist at one European asset manager described the official growth figure as “a very crude propaganda tool”.

The recent decision by the People’s Bank of China to devalue the renminbi, a move that rattled markets across the world, has been seen as further evidence that China’s economy is in far worse health than official data show.

Some have instead turned to alternative estimates, such as the “Li Keqiang index” -a composite of various indicators favoured by the Chinese prime minister, such as electricity production and railway freight volumes. Many of those gauges fell into outright contraction late last year.

Bob Browne, chief investment officer at Northern Trust, said the fund manager recently lowered its growth forecast for China for the next five years to “5 per cent and change”, which he said was a recognition that using official statistics was “really no longer appropriate”.

“We just can’t reconcile it with the private sector surveys or more valid government bottom­ up numbers,” he said.

The true nature and rate of Chinese growth is a key ingredient for investors and economists as they seek to measure demand for global commodities and forecast growth rates for the countries that produce them.

Sharp falls in the price of many raw materials, including oil, copper and iron ore, over the past year have been seen as added proof that China, the biggest consumer of many commodities, is actually growing well below the stated rate.

“If you look at the kind of hard data that are entering into the composition of the so-called Li Keqiang index, the growth is today probably closer to 5 per cent than to 7 per cent,” said

Jean-Louis Nakamura, chief Asia investment officer at Lombard Odier.

Some are even more bearish. Lombard Research reckons China grew at an average rate of 4.7 per cent in the first half of the year, while Citi’s chief economist Willem Buiter believes growth could already be as low as 4 per cent.Those views chime with a recent confidential survey conducted by Consensus Economics, a researcher, which asked economic forecasters what they believed the true rate of Chinese growth has been this year. Those polled gave an average growth figure for the second quarter of just 4.3 per cent, and a forecast for the current quarter of 5.1per cent.A separate Bank of America Merrill Lynch survey of fund managers released on Tuesday showed that the majority of investors now expect China to be growing at 4.1-5 per cent in three years’ time. Most gave an answer of 5.1-6 per cent just a month ago.Figures around 5 per cent contrast with the consensus estimate from investment bank economists, which is currently 6.9 per cent for 2015.David Meier, economist at Julius Baer, has an official forecast for this year of 6.7 per cent, but notes “suspicion that the figures could be 1-2 per cent overdone”.”At the end of the day, we have to comment, analyze and publish forecasts based on the official [gross domestic product] data series,” he said.© THE FINANCIAL TIMES LTD 2015 FT and ‘Financial Times’ are trademarks of The Financial Times Ltd

China Daily 8 regions selected as innovation zones

By Lan Lan (China Daily)Updated: 2015-09-16 10:18

big_questionx299_1

China aims to build a long-term mechanism that could spur innovation and drive economic growth.

The State Council has chosen eight regions, including the Beijing-Tianjin-Hebei cluster, Shanghai, and Guangdong province as pilot zones to carry out trials on innovation and reform.

Li Pumin, spokesman for the National Development and Reform Commission, told a news conference on Tuesday that these regions have been asked to map out detailed proposals for innovation reform in the fourth quarter.

The regions have been tasked with building a long-term mechanism for promoting innovation and making breakthroughs in promoting fair competition, intellectual property, scientific achievement and financial innovation, Li said.

Experiments will be carried out in these regions in 2016, while the NDRC and the Ministry of Science and Technology will evaluate the performance. Successful measures will be duplicated or promoted nationwide, said Li.

China’s economic growth will become more reliant on human skills and technology, as well as on improving productivity and resource allocation. However, in the short term, investment will continue to play the most crucial role, experts said.

Maintaining steady growth and promoting investment remain the focus this year against the backdrop of increasing downward economic pressure, Xu Shaoshi, chairman of the NDRC, said on Monday at a video conference.

Measures taken by the government for promoting investment have taken effect. In the first eight months of the year, infrastructure investment grew by 18.4 percent year-on-year, more than 7 percentage points higher than overall investment growth.

Lin Boqiang, director of the China Center for Energy Economics Research at Xiamen University, said the recovery remains weak.

“Investment remains the most effective tool in cushioning the slowdown, but we need to nurture drivers for future growth by spurring innovation,” said Lin.

Reuters India awards 10 permits to create small banks to help businesses

Business News | Wed Sep 16, 2015 9:54pm IST

MUMBAI

A money lender counts Indian rupee currency notes at his shop in Ahmedabad, India, May 6, 2015.

Reuters/Amit Dave/Files

The Reserve Bank of India said on Wednesday it has selected 10 financial institutions to set up separate small banks to lend to small businesses and farmers, who typically struggle to get funding from traditional lenders.

Private-equity backed Ujjivan Financial Services Pvt Ltd and Janalakshmi Financial Services Pvt Ltd were among the 10 granted approval to seek one of the niche small finance bank licences. Most of the others were microfinance companies that already make small loans to businesses and farmers.

Nearly half the population of India, Asia’s third-largest economy, did not have a bank account before a government programme led to millions of new accounts this year.

More than 100 million people in the country work at small businesses but only about 4 percent of small businesses have access to institutional finance.

Setting up small banks will enable microfinance firms to increase their loan ticket size although they must ensure that half of their loan book constitutes loans of not more than 2.5 million rupees ($37,700).

Existing non-bank finance companies, local area banks and micro-finance institutions were eligible to apply for the permits and 72 submitted applications.

The winners will in future be able to become fully fledged banks depending on their performance and if they comply with rules for banks, the RBI has said, although the transition will not be automatic.

Janalakshmi’s investors include Morgan Stanley Private Equity Asia and TPG, while Sequoia Capital and the World Bank arm IFC are investors in Ujjivan.

The other institutions selected for small bank permits included Au Financiers (India) Ltd, Capital Local Area Bank Ltd and Disha Microfin Pvt Ltd.

In a separate process, last month, the RBI had named 11 companies to set up payments banks that can take deposits and remittances but cannot lend. Big telecom carriers and Reliance Industries, controlled by India’s richest man, were among those selected for the payments bank permits.

($1 = 66.3234 Indian rupees)

(Reporting by Devidutta Tripathy; Editing by Susan Fenton

India Money Control : Indian economy an exception; to grow 7.2% in FY16: OECD

Sep 17, 2015, 07.49 AM | Source: PTI

Releasing its interim economic outlook report today, the Paris-based think tank said global growth prospects have weakened slightly and become less clear in recent months.

Indian economy an exception; to grow 7.2% in FY16: OECD
Releasing its interim economic outlook report today, the Paris-based think tank said global growth prospects have weakened slightly and become less clear in recent months.
Indian economy an exception; to grow 7.2% in FY16: OECD

India is projected to grow at a slightly lower pace than expected earlier at 7.2 per cent this fiscal but the country is an “exception” to the worsening picture in major emerging economies, says OECD.

Releasing its interim economic outlook report today, the Paris-based think tank said global growth prospects have weakened slightly and become less clear in recent months. Even as OECD marginally lowered the growth forecast for India for the current and next financial years, it said the country is “expected to be the fastest-growing major economy over the coming two years”.

“India will grow by 7.2 percent in 2015 and 7.3 per cent in 2016,” the Organisation for Economic Cooperation and Development (OECD) said. The latest figures are slightly lower than the projection of 7.3 per cent (2015-16) and 7.4 per cent growth (2016-17), respectively, made by OECD in June this year.

India’s economic growth slowed to 7 percent in the three months ended June compared to 7.5 percent expansion recorded in the January-March quarter, as per official estimates.

“World trade growth has stagnated and financial conditions have deteriorated. The recovery is nonetheless progressing in advanced economies, but the outlook has worsened further for many emerging market economies (EMEs),” OECD added. Emphasising that India is projected to continue to grow strongly, broadly in line with 2015, the think tank said EMEs like Brazil and Russia should see some improvement in 2016 if commodity prices do not fall further.

“The slowdown has been sharpest in countries heavily dependent on commodities and/or with close trade links to China, notably in East and South-East Asia. In 2014, over a third of all merchandise imports in China came from regional trading partners. “The main exception to the worsening picture is India, where growth is supported by strong consumer spending and public investment in infrastructure,” the report noted.

In 2015, China is expected to grow by 6.7 per cent and at a slower rate of 6.5 per cent next year. Brazil’s economy is expected to shrink by 2.8 per cent in 2015 and by an additional 0.7 per cent rate in 2016, it added. “A key puzzle in the short-term outlook centres on China, where recorded growth has held up well, but some indicators point to a slower underlying pace of economic activity.

“The marked slowdown in Chinese import demand has important spillover effects on global growth, particularly in emerging economies with close trade links to China, and those that depend on commodities,” OECD said.

The global growth forecast has been trimmed to 3 per cent this year from earlier projection of 3.1 per cent. The rate of expansion next year is expected to be 3.6 per cent lower than June estimate of 3.8 percent.

Canada Wood China Economy, Construction, Lumber Shipments

brad spencer 2

By Brad Spencer

Deputy Managing Director

August 13, 2015

Posted in: China

Qingdao Continer terminal

Growth in China’s real estate investment slowed to 4.3 per cent in the first seventh months of this year from a year ago, while the area of property sold rose an annual 6.1 per cent

The bank’s preliminary Purchasing Managers’ Index (PMI) came in at 49.6 in June, the highest in three months but still below the breakeven point of 50, HSBC said in a statement. The index, which is compiled by information services provider Markit and tracks activity in factories and workshops, is seen as a key barometer of the country’s economic health.

However, while it marked a fourth straight contraction, the figure was an improvement on May’s final reading of 49.2 and also beat a forecast of 49.4 in a survey of economists by Bloomberg News. The figures are the latest to show the economic powerhouse continues to slow despite three interest rate cuts since November as well as other measures to boost bank lending and the housing market.

While total new business and purchasing activity in

creased slightly this month companies continued to slash staff, with the latest reduction the sharpest in more than six years, Annabel Fiddes, an economist at Markit, said in the statement. Zhao Yang, a Hong Kong-based economist with Nomura, also said the overall growth momentum in China was “still weak” despite the improvement in the PMI reading.

“Monetary policy still needs to be further eased to counter the still-strong headwinds in the economy,” Zhao said in a research note. Chinese imports fell for a seventh straight month in May while exports also sank, according to official data, as the world’s second biggest economy shows protracted weakness despite government easing measures.

The disappointing figures, released, also come as leaders try to transform the economy to one where growth is driven by consumer spending rather than by government investment and exports.Imports slumped 17.6 percent year-on-year to $131.26 billion, the General Administration of Customs said in a statement.

The decline was much sharper than the median forecast of a 10 percent fall in a Bloomberg News poll of economists and followed April’s 16.2 percent drop.”The May trade data… suggest both external and domestic demand remain weak,” said Julian Evans-Pritchard, an analyst with research firm Capital Economics, in a note.

Exports dropped for the third consecutive month, falling 2.5 percent to $190.75 billion, Customs said, although that was better than the median estimate of a four percent fall in the Bloomberg survey.”The data add to evidence that the sector has lost growth momentum in Q2 as a whole, and suggests that the authorities may step up their efforts to stimulate growth and job creation in the second half of the year,” she added.

The sharp decrease in imports meant the trade surplus expanded 65.6 percent year-on-year to $59.49 billion.In yuan terms imports fell 18.1 percent, exports decreased 2.8 percent and the trade surplus expanded 65.0 percent.The figures provided further evidence that frailty in the Chinese economy, a key driver of world growth, has extended into the current quarter despite intensified government stimulus measures.

Industrial output, which measures output at factories, workshops and mines, rose 6.1 percent year-on-year in May, the National Bureau of Statistics (NBS) said in a statement.Retail sales, a key indicator of consumer spending, increased 10.1 percent in the same month, the NBS said.The industrial output figure was the highest since a reading of 6.8 percent growth in January-February, when the data were released for two months to iron out distortions related to Chinese New Year.

The May increase was also above the 5.9 percent recorded in April and marginally above the median 6.0 percent rise in a forecast of economists by Bloomberg News.

Source: Markit and others 

BC Forest Investment and Innovation Market Overview

With GDP growth coming in at less than the target of 7.4 per cent, China announced additional stimulus packages in 2013, including tax cuts for small businesses and increased spending on lowincome housing and infrastructure. As a result, wood consumption continued to trend upwards with growth of 17 per cent on a per capita basis. Unemployment, inflation and other key economic indicators showed little movement, while the Yuan fell by 4.8 per cent against the Canadian dollar, making imports of B.C. wood products more expensive for Chinese customers.

Demand for housing remained strong in tier-one cities (Beijing, Shanghai, Guanzhou and Shenzen) due largely to existing residents who were upgrading to higher value homes, in-migration from other parts of the country, and speculation by Chinese investors buying additional properties. Forecasts suggest that median incomes in tier-one cities will continue to rise and drive future property markets.

China’s declining trade surplus and a dampening of growth throughout the economy suggest that flat or declining demand for most commodities, including wood products, will be the dominant trend of 2014/15.

B.C. Softwood Lumber Exports to China, as of April’15

BC softwood lumber export volume to China in the first four months of 2015 was 2.263 million cubic meters as compared to 2.091 million cubic meters over the same period in 2014, an increase of  8.2%%.  BC softwood lumber export value over this same period was $461.77 million, an increase of 21.3%.  These comparisons are skewed as the 2014 numbers where impacted by the April Port of Vancouver strike.  We also continue to believe that both volumes and values will decline over the next few months because of large inventory buildups in China.

china lumber imports

BC Softwood Lumber Exports to China (including Hong Kong)

2013/2015 Cumulative

Volume of B.C. Lumber Exports to China (Incl. Hong Kong)

2014/2015

(Cubic Metres)

Commodity May Jun Jul Aug Sep Oct Nov Dec Jan Feb Mar Apr May Jun
SPF 674,656 616,490 612,135 624,223 524,782 590,172 471,345 423,993 352,391 414,810 542,888 619,524 550,871 522,326
Hemlock 120,165 94,579 56,118 70,513 80,106 97,250 94,148 78,130 38,189 67,516 85,447 51,691 67,759 54,747
Western Red Cedar 5,626 5,069 3,450 3,872 4,957 3,128 2,670 3,273 1,735 3,082 4,978 2,674 2,320 3,474
Douglas Fir 19,418 19,097 25,903 17,514 31,602 20,002 15,997 20,423 7,545 13,251 19,625 14,041 23,186 14,217
Yellow Cedar 3,657 2,082 2,113 444 485 269 1,745 779 24 306 143 924 2,229 948
Sitka Spruce 55 0 5,002 1,376 0 0 0 0 125 46 153 139 0 37
Other 7,492 8,329 13,310 6,676 4,747 5,007 3,772 10,998 1,696 9,973 9,475 1,825 4,226 2,651
Total 831,069 745,646 718,031 724,618 646,679 715,828 589,677 537,596 401,705 508,984 662,709 690,818 650,591 598,400

 Value of B.C. Lumber Exports to China (Incl. Hong Kong)

2014/2015

(000s of $CDN)

Commodity May Jun Jul Aug Sep Oct Nov Dec Jan Feb Mar Apr May Jun
SPF 121,116 110,749 111,551 115,438 93,326 109,354 95,424 82,038 67,829 82,194 114,451 121,422 104,728 95,897
Hemlock 25,730 19,636 14,273 15,643 16,993 20,765 18,652 16,335 9,111 14,284 18,169 11,383 13,165 11,113
Western Red Cedar 1,780 2,083 1,301 1,498 2,254 1,471 1,291 1,651 871 1,391 2,306 1,365 1,107 1,553
Douglas Fir 3,738 3,996 5,090 3,700 6,026 4,037 2,813 3,661 1,703 2,458 4,176 2,655 4,025 3,262
Yellow Cedar 968 499 459 126 120 105 421 389 18 81 71 567 692 326
Sitka Spruce 18 0 1,256 334 0 0 0 0 25 46 17 98 0 22
Other 1,832 2,068 2,685 1,451 1,028 1,193 867 2,139 387 2,331 2,121 501 925 651
Total 155,182 139,032 136,614 138,191 119,747 136,926 119,467 106,212 79,945 102,786 141,309 137,992 124,642 112,825

Year-to-Date Volume and Value of B.C. Lumber Exports to China (Incl. Hong Kong)

  Volume (Cubic Metres)   Value (000s of $CDN)
Commodity 2012 2013 2014 YTD 2014 YTD 2015   2012 2013 2014 YTD 2014 YTD 2015
SPF 6,463,716 6,739,150 6,272,267 3,025,617 3,002,810 880,959 1,137,732 1,138,312 531,181 586,521
Hemlock 692,434 841,798 960,216 483,951 365,349 124,080 174,091 207,204 104,542 77,225
Western Red Cedar 57,489 65,812 45,869 24,519 18,263 19,663 23,089 19,807 10,343 8,593
Douglas Fir 200,030 254,693 211,165 79,724 91,865 35,847 50,820 41,574 16,247 18,280
Yellow Cedar 14,613 18,824 15,001 9,166 4,574 4,609 5,485 4,042 2,422 1,756
Sitka Spruce 974 2,103 6,502 124 500 174 651 1,630 41 207
Other 76,924 75,966 88,750 44,240 29,846 15,001 16,795 19,428 10,065 6,916
Total 7,506,180 7,998,346 7,599,770 3,667,341 3,513,207   1,080,332 1,408,661 1,431,998 674,840 699,498

YTD = Year-to-Date to June

Japan Economy, Construction & Lumber Shipments

shawn Lawlor

By Shawn Lawlor

Director, Canada Wood Japan

September 3, 2015

Posted in: Japan

Japan Economic Update: Abenomics Stall  

Japan’s economy hit the brakes in the April to June quarter, with annualized GDP posting a 1.6% contraction. Consumer spending dropped 3.1% over the same period as real wages are failing to keep pace with rising taxes and inflation. With the Chinese economy cooling off and the depreciation of the Yuan, the outlook for Japanese manufacturing and exports remains challenging. To date, although Prime Minister Shinzo Abe’s economic policies have engineered notable increases in the equity markets, the gains do not appear to be trickling down to the broader consumer economy. As a result cabinet approval has steadily eroded from its peak, slipping to 37% at present. Since the beginning of the year, much of the legislative house agenda has been focused on pushing through unpopular national security bills and revisions to Japan’s pacifist constitution rather than focusing on economic issues. Popular criticism is mounting that the LDP needs to refocus efforts on revitalizing the economy. Some market analysts predict additional fiscal stimulus and continued quantitative easing, yet without addressing key structural reforms as initially promised under the Abenomics moniker, simply adding stimulus is unlikely to yield much in terms of incremental economic growth.

Japan Housing Starts Summary 

Japanese Monthly Housing Starts Summary for June 2015

June results surprised with the strongest showing since 2008. Total housing starts jumped 16.3% in June to finish at 88,118 units. Owner occupied single family starts increased 7.2% and rentals increased 14.6%. The mansion condominium market increased a staggering 82.8%. (This segment is typically more volatile depending on the timing of large new projects).

Total wooden housing increased 8.9% to 46,151 units. Post and beam starts were up 7.2% to 34,042 units. Wooden pre-fab starts increased 14.4% to 1,382 units. Platform frame starts posted a solid 14% gain to finish at 10,727 units; with custom ordered single family homes increasing 6.9% to 3,052 units and rentals up 21% to 6,383 units. However, built for sale 2×4 spec housing declined 2.6% to 1,240 units. 

B.C. Softwood Exports to Japan

The results for B.C. softwood lumber shipments to Japan year to date through until the end of June were as follows: total shipments were 1,027,603m3, a decrease of 6.5% over year prior results; SPF shipments totaled 699,155m3 (3.0%); Hem Fir shipments were 139,968m3 (16%); Fir totaled 119,531m3 (3.3%); and Yellow Cedar fell 19.1% to 42,694m3. The total value of shipments for the first half of 2015 totaled $354.9 million compared to $381.6 million in 2014.

 BC Forest Investment and Innovations BC Softwood Lumber Exports to Japan

2013/2015 Cumulative

japan accumulative import values

Cumulative Volume (Thousands of Cubic Metres)


  Jan Feb Mar Apr May June July Aug Sep Oct Nov Dec
Total 2013 166.8 386.1 605.3 871.6 1,101.2 1,341.9 1,547.8 1,770.7 1,983.6 2,249.5 2,435.4 2,626.4
Total 2014 160.9 346.9 418.5 626.4 872.3 1,099.4 1,238.0 1,404.7 1,612.4 1,810.3 1,968.4 2,135.7
Total 2015 160.0 305.9 509.4 682.7 869.6 1,027.6

Cumulative Value (Millions of Dollars)


  Jan Feb Mar Apr May June July Aug Sep Oct Nov Dec
Total 2013 42.7 106.7 172.1 252.0 325.1 404.0 469.8 543.5 614.5 700.6 760.0 825.3
Total 2014 52.8 120.2 148.1 221.4 304.7 381.6 428.6 485.0 552.4 617.7 673.3 731.3
Total 2015 55.6 107.8 179.0 238.9 299.5 355.0

Volume of B.C. Lumber Exports to Japan

2014/2015

(Cubic Metres)

BC softwood lumber exports Cdn m3

Commodity May Jun Jul Aug Sep Oct Nov Dec Jan Feb Mar Apr May Jun
SPF 178,907 153,241 86,007 117,766 143,988 140,469 107,479 109,022 108,402 98,063 133,675 125,354 133,991 99,670
Hemlock 26,347 29,266 22,399 19,792 36,440 28,389 24,108 24,347 24,458 17,231 28,737 18,520 26,158 24,864
Western Red Cedar 1,508 1,714 1,562 1,622 1,604 1,474 1,409 1,930 750 1,195 1,745 2,012 1,412 1,677
Douglas Fir 24,781 28,770 19,024 16,869 14,596 15,134 19,290 20,692 18,451 18,117 25,032 18,949 17,041 21,941
Yellow Cedar 7,773 9,371 3,910 5,286 6,878 5,314 2,996 8,905 5,449 8,147 10,976 4,962 5,255 7,905
Sitka Spruce 1,501 435 1,587 1,164 596 2,075 119 633 681 50 332 240 1,590 406
Other 5,050 4,347 4,049 4,224 3,633 5,013 2,704 1,815 1,843 3,102 3,009 3,238 1,415 1,558
Total 245,867 227,144 138,538 166,723 207,735 197,868 158,105 167,344 160,034 145,905 203,506 173,275 186,862 158,021

Value of B.C. Lumber Exports to Japan

2014/2015

(000s of $CDN)

BC softwood lumber exports Cdn $

Commodity May Jun Jul Aug Sep Oct Nov Dec Jan Feb Mar Apr May Jun
SPF 51,574 44,432 24,220 35,207 40,680 40,194 31,340 32,694 32,506 29,491 39,672 37,315 37,125 29,475
Hemlock 10,939 11,346 8,119 7,663 13,468 10,694 11,422 9,390 9,736 7,781 11,827 7,573 10,279 10,254
Western Red Cedar 1,352 1,313 1,426 1,253 1,556 1,208 1,362 1,704 739 1,154 1,916 1,768 1,411 1,697
Douglas Fir 12,590 13,160 8,805 7,553 6,649 6,477 8,420 9,344 8,469 8,448 11,175 8,785 8,050 9,319
Yellow Cedar 3,892 4,348 1,993 2,536 2,900 2,554 1,637 3,634 2,943 3,951 5,213 2,613 2,670 3,838
Sitka Spruce 928 303 856 535 551 1,686 75 435 307 26 119 171 342 166
Other 2,022 1,976 1,584 1,680 1,514 2,566 1,318 801 892 1,391 1,205 1,757 633 777
Total 83,298 76,877 47,002 56,426 67,318 65,378 55,574 58,001 55,593 52,243 71,127 59,981 60,511 55,526

Year-to-Date Volume and Value of B.C. Lumber Exports to Japan

  Volume (Cubic Metres)   Value (000s of $CDN)
Commodity 2012 2013 2014 YTD 2014 YTD 2015   2012 2013 2014 YTD 2014 YTD2015
SPF 1,611,329 1,784,953 1,425,378 720,647 699,155 327,313 474,749 413,494 209,159 205,584
Hemlock 404,819 404,046 322,308 166,833 139,968 161,171 153,542 128,822 68,067 57,450
Western Red Cedar 19,538 21,720 18,197 8,596 8,791 13,403 16,626 15,541 7,031 8,685
Douglas Fir 260,867 261,675 229,183 123,578 119,531 99,189 111,068 107,414 60,167 54,247
Yellow Cedar 110,879 100,009 86,073 52,784 42,694 57,729 44,898 40,183 24,930 21,228
Sitka Spruce 8,700 9,405 10,980 4,806 3,299 4,712 5,592 7,119 2,982 1,131
Other 25,476 44,583 43,627 22,189 14,165 10,474 18,868 18,744 9,281 6,656
Total 2,441,608 2,626,391 2,135,746 1,099,433 1,027,603   673,990 825,344 731,317 381,618 354,981

YTD = Year-to-Date to June

Korean Economy, Construction & Lumber Shipments

By Tai Jeong

Tai Jeong

Technical Director, Canada Wood Korea

September 1, 2015

Posted in: Korea

Economy Update

The depreciation of the Chinese yuan ignited concerns across the world that the Chinese economy is worse than expected.  South Korea, as an export depending country, will likely suffer a direct or indirect impact from the current Chinese economic difficulty.South Korea’s exports in the first seven months of 2015 contracted 4.9% to $315.2 billion, while imports nosedived 15.5% to $261.2 billion compared with those for the same period in 2014.

As a result, the country’s cumulative trade surplus in the first seven months of 2015 stood at $54 billion, much larger than the $22.2 billion in the black posted for the same period in 2014.

South Korea’s private consumption has remained in the doldrums since the MERS outbreak in late May.  As part of efforts to stimulate anemic consumer spending that is weighing down economic growth, South Korean government unveiled measures to cut consumption taxes on some goods temporarily, predicting that the consumption-boosting measures will raise the country’s economic growth rate by 0.025 percentage point.  South Korea is trying to achieve at least 3% GDP growth in 2015, although many independent think tanks predict mid-to-high 2% GDP growth is more realistic for 2015.

South Korea’s consumer prices grew less than 1% for the 8th straight month in July.  Jobless rate inched down to 3.7% in July.

The real value of the South Korean won against key foreign currencies dropped 2.2% on-month in July, providing exporters with breathing room to boost their overseas sales that had taken a hit from a strong won.  The exchange rate for Canadian Dollar averaged at 891.31 won in July, 2015, down 6.27 % from 950.94 in July, 2014 and down by 0.97% from 900.07 in one month earlier.

Housing Construction

South Korea’s housing starts in year-to-date June of 2015 increased 18.7% to 54,585 buildings from a year earlier 45,994 buildings owing to the continuous government measures to revamp the country’s property market and the increased demand from end-users on new housings.  Housing permits in the same period also increased 15.9% to 58,254 buildings from a year earlier 50,283 buildings.

The number of wood building permits and wood building starts in year-to-date June of 2015 continuously increased 15.5% to 7,428 buildings and 17.6% to 6,613 buildings respectively compared with those in 2014.

korean wood building permits

Source: Ministry of Land, Infrastructure and Transport (as a percent compared to previous year same month and period)

Lumber Shipments

South Korea’s home transactions surged to a new monthly high in July pointing to a strong recovery in the real estate market.  In the first seven months of 2015, home transactions spiked 31% on-year to 721,471.  By type, apartment transactions surged 40.3 percent on-year to 74,112, while transactions involving row houses spiked 56.7 percent to 19,900.  Transactions of detached houses also surged 41.7 percent to 16,663.

Korean cumulative cubic meters

BC softwood lumber export volume to South Korea for the first six months in 2015 dramatically increased 17.1% to 165,136 cubic meters as compared to 141,014 cubic meters for the same period in 2014.  As a consequence of increased export volume, export value in year-to-date June also increased 17.4% to CAD$43.859 million as compared to CAD$37.363 million in the same period in 2014.

korean lumber exports

BC Softwood Lumber Exports to South Korea 2013/2015 Cumulative

Korean accumulative volume and sales

As market diversification increases, so do number of phytosanitary issues

By Brian Zak

Brian zak

Large wooden structures such as these townhomes in Shanghai are gaining in popularity — just one of several factors leading to the increased demand for Canadian wood products in Asia.

Monitoring and attending to phytosanitary issues of our forest products in the offshore markets continues to be challenging.  Shipments have expanded as new entrants to offshore markets become increasingly prevalent and, as existing shippers   reach further into traditional and newly expanding markets.   Shippers continue to reduce their reliance on the US marketplace as its recovery continues to languish with no visible signs of strength in the foreseeable future.

The trending of volumes being shipped to the offshore markets continues to increase as shown in the following table. The percentage of offshore shipments in comparison to total shipments has grown annually from 9% in 2005, to >37% in the first 8 months of 2011.   Based on YTD shipments the offshore volumes will have more than doubled by the end of 2011 over 2005 levels.

These volumes are significant in terms of workloads for CFIA and Canada Wood staff especially in the Western Region.

Comments from Industry analysts and industry shippers both anticipate that continued success with clients in the offshore markets and the reduced reliance on the US marketplace will likely be part of the longer term strategy for a majority of Canadian shippers.

There continues to be an increasing number of difficulties incurred at the receiving end in the offshore inspection and entry process.  This is further evidenced by the amount of collaboration between CFIA, Canada Wood, and Embassy staffs in clarifying the export requirements of importing countries and entry into new Ports.


Phytosanitary Issues

  1. Documentation:

Phytosanitary documentation for offshore exports has become increasingly complex and varies by country for different species and the various product categories. New shippers to offshore programs are continually referred to Canada Wood staff for an “understanding of the rules” and how to prepare their product for “export inspections” and/or “offshore entry requirements.”

*  Documentation breaches are viewed seriously, especially so in the Asian markets. As the broader industry expands it reach into new markets or into new Ports of the existing markets, the breaches have increased.

*  Clearance delays continue throughout 2011 – some of which are the result of industry infractions associated with new shippers. Delays at the China and India receiving ports are also attributed to “port staff or individuals” who are interpreting the rules differently from negotiated rulings with Canada.

*  Seizures and forfeitures associated with breaches in phytosanitary rules and documentation has reduced – however “treatment on entry requirements” has increased. This is most often related to the “mis-interpretations” associated with our species, documentation and/or KD/HT treatments that are not understood at time of entry by individual inspectors.

*  Import Permits are oftentimes required by many offshore markets and need to be presented to CFIA for Phytosanitary Inspections. We continue to see permits made out in the wrong species names or new shippers not understanding the rules.

  1. Country Matrix Guidelines

Canada Wood and CFlA have been in continuous discussions on how best to increase the understanding of Canadian shippers to the rules and regulations in the offshore markets. Canada Wood had proposed to publish the “Phytosanitary Guidelines Matrix” for Offshore Markets on the Canada Wood website. CFIA in the last week has now offered suggestions on how Canada Wood might consider the trial publishing of “phytosanitary guidelines” on the Canada Wood website.

These “Guidelines” would provide the rudimentary information for the phytosanitary conditions of entry into 15-18 offshore markets and it would provide industry with enough information for to determine whether or not one needs to get the “official clarifications” from CFIA. It is the intent of Canada Wood to keep these current and add different countries going forward. Watch for this Matrix by early Spring.

  1. Other Issues being addressed by Canada Wood:

*  E-Certification and/or E-Mail Certification trials being addressed by CFIA and Cda Wood.

*  E-signatures on HT Certificates continues to be explored – might fit in with E-Mail Certifications between Governments

*  China Taicang log and lumber – offload delays for up to 2 weeks – addressing in China

*  Timeliness of PCs = industry want an increase in “alternative service delivery programs”

*  Fumigation alternative(s) being explored – Phosphine looking potentially out of reach at this point in time – time, temperature, corrosiveness, and more $ needed to finish the research yet. It does show that it has some promise at being a potential fumigant.

*  India:

Import permits for 3 species of SPF – we are pushing for 1 collective-mix permit for SPF

The acceptance of Eastern species of spruce and Ash is in process

India – HT Cert as an option to a PC is being addressed

*  Indonesia is regulating for Pinewood Nematode and they want any species that has “true firs” to be HT prior to entry including Hem-Fir. This is being addressed by CFIA in order to allow green Hem-Fir to have entry without treatments.

*  Malaysia is regulating HT on the basis of 74 degrees C to the lumber core for a minimum of 6 hours depending on the thickness. Canada Wood is working with CFIA to accept the CHTWPCP 56 degree/30 minutes at the core and hope to have it resolved before March.

*  Canada Wood is working with CFIA and DFAIT to convince Turkey to treat the entry of Cedar equal to that of the EU.

Market Overview

Overall economic conditions softened in India in 2013. With a weaker Rupee increasing the price of imports, GDP growth slowed to 3.8 per cent and inflation rose to 11 per cent.

An upswing in the southern yellow pine supply from the U.S., and pine and spruce exports from Germany, created a much more competitive market for wood products during the year, resulting in a drop in B.C.’s share of total imports. However, imports and consumption of softwoods are expanding and long-term trends remain positive in this nascent softwood market. FPInnovations estimates that softwood lumber consumption in India grew by seven per cent in 2013.

SPF remains the dominant species in current shipments from B.C. to India; however, FII is seeing strong interest in Coastal species for applications that have traditionally consumed hardwoods. This suggests positive growth prospects for hemlock, western red cedar and Douglas-fir, Log export bans implemented in Myanmar, and trade restrictions in other key hardwood supply locations, continue to influence a trend towards substitution of softwood for hardwoods and an increased interest in lumber imports.

Long-term demographic trends suggest that the expanding and young middle class in India presents an excellent potential market for softwoods. Combined with continued economic growth, this demographic shift suggests that most of the buildings that will exist in India by 2030 are yet to be built. While wood frame construction is not the primary focus of FII’s market development strategy, these positive long-term construction trends may lead to the development of a robust market for interior products and finishing materials made from B.C. softwoods.

In July 2013, ongoing work on phytosanitary barriers led to the approval of Eastern SPF to India. Market access work continues in India to ensure that Canadian species are well understood and have smooth passage through customs and regulatory bodies. Canada-India Free Trade negotiations continue, which could yield further reductions in the tariffs on Canadian wood products in the medium term.

BC Softwood Lumber Exports to India BC Forest Investment and Innovation

2013/2015 Cumulative

India cumaltive export values

Cumulative Volume (Cubic Metres)

  Jan Feb Mar Apr May June July Aug Sep Oct Nov Dec
Total 2013 2,697 4,986 7,802 13,189 23,823 33,618 39,837 44,899 46,250 46,983 47,726 47,959
Total 2014 579 826 886 3,201 6,580 7,841 10,382 12,944 15,089 16,996 18,424 30,439
Total 2015 2,324 8,232 22,372 25,951 27,220 32,285

Cumulative Value (Thousands of Dollars)

  Jan Feb Mar Apr May June July Aug Sep Oct Nov Dec
Total 2013 569 1,106 1,776 3,007 5,704 8,076 9,358 10,413 10,667 10,850 11,036 11,084
Total 2014 148 217 225 910 1,847 2,190 2,927 3,603 4,164 4,640 5,035 7,841
Total 2015 675 2,318 5,493 6,390 6,785 7,896

Volume of B.C. Lumber Exports to India

2014/2015

(Cubic Metres)

Commodity May Jun Jul Aug Sep Oct Nov Dec Jan Feb Mar Apr May Jun
SPF 2,997 1,261 2,226 2,449 1,969 1,907 1,428 11,870 2,103 5,907 13,997 3,544 1,104 5,026
Hemlock 83 0 0 0 0 0 0 80 0 0 0 0 0 0
Western Red Cedar 46 0 0 14 0 0 0 0 0 0 0 0 0 0
Douglas Fir 133 0 279 0 111 0 0 0 221 0 143 0 0 0
Yellow Cedar 120 0 36 99 65 0 0 65 0 0 0 35 165 39
Sitka Spruce 0 0 0 0 0 0 0 0 0 0 0 0 0 0
Other 0 0 0 0 0 0 0 0 0 1 0 0 0 0
Total 3,379 1,261 2,541 2,562 2,145 1,907 1,428 12,015 2,324 5,908 14,140 3,579 1,269 5,065

Value of B.C. Lumber Exports to India

2014/2015

(000s of $CDN)

China Lumber Accum Value

Commodity May Jun Jul Aug Sep Oct Nov Dec Jan Feb Mar Apr May Jun
SPF 829 343 638 645 514 476 395 2,766 604 1,640 3,130 890 324 1,101
Hemlock 31 0 0 0 0 0 0 25 0 1 0 0 0 0
Western Red Cedar 25 0 0 17 0 0 0 0 0 1 0 0 0 0
Douglas Fir 35 0 78 0 37 0 0 0 71 1 45 0 0 0
Yellow Cedar 17 0 20 14 10 0 0 15 0 1 0 8 71 11
Sitka Spruce 0 0 0 0 0 0 0 0 0 0 0 0 0 0
Other 0 0 0 0 0 0 0 0 0 1 0 0 0 0
Total 937 343 737 677 561 476 395 2,806 675 1,643 3,175 898 394 1,111

Year-to-Date Volume and Value of B.C. Lumber Exports to India

China Lumber Accum Volume

  Volume (Cubic Metres)   Value (000s of $CDN)
Commodity 2012 2013 2014 YTD 2014 YTD 2015   2012 2013 2014 YTD 2014 YTD2015
SPF 49,101 45,308 28,543 6,694 31,681 8,115 10,424 7,251 1,816 7,689
Hemlock 52 94 163 83 0 9 34 56 31 1
Western Red Cedar 4 6 407 393 0 2 4 237 220 1
Douglas Fir 3,543 2,312 851 461 364 590 583 208 93 116
Yellow Cedar 0 38 445 180 239 0 7 84 26 89
Sitka Spruce 0 0 0 0 0 0 0 0 0 0
Other 120 201 30 30 1 18 32 4 4 1
Total 52,820 47,959 30,439 7,841 32,285   8,735 11,084 7,841 2,190 7,896

YTD = Year-to-Date to June

Taiwan AFPA/ Government of Alberta/ FPInnovations Mission December 6-15, 2014

Taiwan Mission December 7-15 2014

TaipeiBex 2014

TaipeiBex 2014

Mission Objectives:

  • Attend the 26th Taipei Building Show Dec 11-14 in collaboration with BCWood, FPInnovations and Alberta Taipei Trade Office. Completed see Appendix B for summary on contacts
  • Assist in the Canadian Green Building Materials Introduction Seminar on Dec12th. Providing information on SPF grading system in Canada. Completed. See Appendix C for copy of presentation.
  • Continue to promote Canada Wood and Alberta Forest Products Association. Completed. Contacts at show and site visits.
  • Work with FPInnovations on building code, green building and tall building issues. Ongoing need to revisit with Taiwan.
  • Carry out further market investigations and business contacts. Completed.

Recommendations

  1. Return to the 2015 TaipeiBex should budget and time allow.
  2. Continue market investigations.
  3. Ensure Fire Code issue has been moved forward or reach closure on issue.
  4. Coordinate with Agriculture and Forestry on market efforts going forward

Mission Notes

December 8th informal meetings Taipei

taipei-101

Taipei 101

December 9th Architecture and Building Research Institute under the Ministry of

The Interior (ABRI)

The Architecture and Building Research Institute (ABRI) http://www.abri.gov.tw/utcPageBox/ENGMAIN.aspx?ddsPageID=ENGHR    is a leading national research agency in Taiwan under the supervision of the Ministry of the Interior. ABRI operates similar fire and acoustic facilities to National Research Council of Canada.

The ABRI aims for promoting innovation and progress in architecture through nationwide research projects, policies and programs, to enhance the level of building technology and the quality of the overall infrastructure.

The major responsibilities of the ABRI are to conduct fundamental and experimental research, to establish building policies and regulations, to promote construction technical excellence, to develop innovative building materials, as well as to disseminate research results and implementation plans broadly for the whole building industry.

Laws and Regulations Research and development related to national policy and codes in building aspect, and the review of international building administration and management systems.

Technology Research and Development Research and development related to building disaster prevention, project quality and safety, structure engineering, construction technology, building environmental control and energy conservation technology, building equipment and material technology.

State-of-the-Art Materials Research and development related to new construction methods and materials, particularly for energy conservative, high strength, and health oriented materials, to streamline material productions and to increase the construction quality.

Objectives of the Institute include:

  • Development of intelligent dwelling spaces
  • Promotion of green building and environmental control technology
  • Planning for safe housing and disaster prevention
  • Establishment of fire safety regulation
  • Development of innovative engineering technology
  • Vitalization of the building industrial economy
  • Establishment of holistic life care building spaces
  • Preservation of historical and cultural buildings
  • Establishment of building performance certification labels
  • Improvement of experiment and testing capability

 Excerpts from Information Contained in Dr. Kenneth Koo’s Mission Report (See Appendix B)

Background:

Ms. Venus Chen of Canadian Trade Commissioner Office of Taiwan (CTOT) planned a meeting with Director General of ABRI to discuss next steps towards acceptance of National Fire Code in Taiwan. The advancement of wood structure building market in Taiwan requires a national building code standard that is supported by a Fire Code Standard.

Dr. Koo then hosted a conference call with Dr. Chun Ni and Mr. Christian Dagenais of FPInnovations to discuss FPInnovations position on overseas Codes & Standards, especially fire rated issues. Dr. Ni confirmed that there was no activity to the Taiwan file for past few years and suggested that American Panel Wood Association APA might have the latest information. APA mentioned that CTOT had commissioned GHL to undertake a fire code study.

Upon request, CTOT provided DHL Consultants Phase I document along with Taiwan code CNS 12514‐99. See Appendix C.

Method of fire resistance test. The request was for FPInnovations to suggest 4 assemblies for roof and floor systems used in Canada.

Ms. Chen suggested that Taiwan authority agreed if Canada provide the lumber assemblies and carry out a burn test at Taiwan’s lab, then test result are applicable to Taiwan code and can be added to the Taiwan Building Code Chapter 9. http://www.moi.gov.tw/english/english_law/law_detail.aspx?sn=26

It was agreed that Dr. Koo would gather the information and recommend that further discussions should occur between FPInnovations and CTOT.

Dr. Koo would recommended 2 wall and 2 floor assemblies with minimum fire ratings of 60 minutes and STC ratings of 50 from the NBCC 2010 as these are assemblies available to the public and listed in National Building Code of Canada.

Discussion:

CTOT hosted a briefing meeting at its office with Mr. Tom Cumming (Deputy Director), Venus Chen, Li‐An Chen (Representative, Alberta Taiwan Office) and Dan Wilkinson.

Ms. Chen presented the GHL Phase I Report and promised that the Phase II Report on Taiwan Fire Code will be commissioned in the spring 2015.

The 4 assemblies were presented as proposed with an understanding that validation test results can be used to substantiate the Canadian Fire Test results. If the results are consistent, then other Canadian fire and acoustic test results can then be recognized by the Taiwan authorities and incorporated into its building code.

Dr. Ho then discussed the costs of fire and acoustic tests. Each fire test will cost about NT230000 or C$9,380. The amount is reasonable and lower than the Canadian tests.

Dr. Ho invited the Canadian delegations to visit the ABRI test facilities in Tainan, Taiwan. ABRI operates similar fire and acoustic facilities to National Research Council of Canada. It was agreed by the Canadian delegation to visit the facilities on Thursday, December 11, 2014.

DSC03548

Left to right Venus Chen, Tom Cummings, Dr. Kenneth Koo, Dr. Ming‐Chin Ho, Kathleen Mackay, Lian Chen ATTO, Buddha, Mr. Alec Lei

Post Meeting:

The American Panel Association (APA) provided GHL Phase I Report to the Canada Trade Office as a professional courtesy. Dr. Koo briefed Dr. Yeh, Technical Director, APA, as a courtesy in return with regards to earlier CTOT meeting with ABRI while attending the APA reception on December 9th.

APA indicated a willingness to work with Canada to address the Taiwan Fire Code and Assemblies. A further discussion with the American Institute in Taiwan (AIT) confirmed US willingness to work with Canada on the issue. AIT is the equivalent of Canada’s Consulate presence in Taiwan. http://www.ait.org.tw/en/

The 4 assemblies were presented as proposed with an understanding that validation test results can be used to substantiate the Canadian Fire Test results. If the results are consistent, then other Canadian fire and acoustic test results can then be recognized by the Taiwan authorities and incorporated into its building code.

Dr. Ho then discussed the costs of fire and acoustic tests. Each fire test will cost about NT230k, or C$9,380. The amount was reasonable and lower than the Canadian tests. (Post Mission update. Subsequent discussions resulted in higher and escalated costs for the tests. The issue of cost, cost sharing, and roles has not been clarified.)

Dr. Ho invited the Canadian delegations to visit the ABRI test facilities in Tainan, Taiwan. It was agreed by the Canadian delegation to visit the facilities on Thursday, December 11, 2014.

Market Updates from Taipei Trade Commissioner

Due to other work priorities during visit CTOT was not able to provide a comprehensive update on the wood product market. Subsequently, they provided an update which can be found in Appendix E of this report. BC Forest Investment and Innovation has just completed an update on the Taiwan Market which is included as well. Alberta follows the BC market trends fairly consistently. Alberta’s SPF share of the market is about 10% of BC SPF volumes.

December 9, 10th Taichung Taoyuan Site Visits

We visited three wood value‐added users and distributors. They were United Forestry Products Corporation and Woodek in Taichung, Taiwan on December 9 and Bestwood, in Taoyuan, Taiwan on Dec 10.

 Philip Hsiao, General Manager, of United Forestry Products Corporation (UFPC).

Phillip Hsaio100_4152100_4138100_4151

This is the second visit with UFPC. (Refer to the May 2012 Taiwan Report for further background on UFPC.)

Their wood supply is 100% softwood lumber from around the world and are Taiwan’s largest sawn timber importer. The Company was established in 1995 by merging 4 lumber remanufacturing mills in Taichung.

Branch offices can be found in Taichung, China and Ho Chi Mein City Vietnam (Golden wood), and VFPC Shanghai Kun-Shai Remanufacturing. The company has 5 distribution Centers in 4 locations in Taiwan (Hsinchu, Taichung, Nantou Kaohsiung). These centers produce and sale package and pallet, bundling materials, construction materials (interior decorating and landscape) construction, journey and LVC products

UFPC was a customer of AFPA and knows the Canadian wood fibre well.

Mr. Stan Chiao at Woodtek Yuh Tsai Co. http://www.klh.at/en.html KLH english website www.woodtek.tw

CLT Building

First CLT Building Taiwan

Woodtek office is near the high speed train terminal in Taichung. WoodTek is the KLH distributor for KLH CLT products in Taiwan. It has built a 5 storey CLT building to serve as its office as well as a CLT demonstration for Taiwanese architects and local government officials. For additional background on KLH products and applications visit  http://woodtek.tw/tw/?Page=product

Lian and Stan

Li-An Chen ATTO and Mr. Stan Chaio                                                                 

They want to build CLT townhouses using passive greenhouse technologies.

passive house

They hope to brand Everwood in Northern Asia as an affordable, fire resistant, green and earthquake proof house structure. See the shake frame demo at their website under Product tab http://www.woodtek.tw/tw/?Page=product . They are sourcing their spruce wood for CLT from Scandinavia plantations. Wood must have small and tight knots and no other defects or decay. Unfortunately our wild forest spruce has too many loose knots and other defects to be useable for their CLT product.

 Bestwoodbestwood decking

Tony Kuo on left side                                              Bestwood Decking Material

Mr. Tony Kuo, General Manager of YiTsai Wood Co Ltd (Bestwood) in Taoyuan www.bestwood.com

 IMG_1213

Bestwood Wharehouse

Bestwood is probably the largest importer of wood building materials, treated SYP, Redwood and engineered woods in Taiwan. Like all Asian companies, there are affiliated companies with the business. Mr. Kuo buys all kinds of wood from all over the world, such as Ainsworth OSB, Russian Birch, Chile plywood. Bestwood has a manufacturing plant /building which makes composite decking. They were interested in sourcing appearance grade SPF from Alberta. They were connected with a couple of AFPA members are were able to place orders.

 IMG_1387

On Saturday Dec 13th, Bestwood hosted a dinner for all its staff, the Canadian and American delegates at Taipei Bex 2014. He and his wife are graceful hosts for such a large event.

 Model of ABRI Test Facility

Visit the ABRI Fire & Acoustic Laboratories in Tainan, Taiwan – Dec 11, 2014

At the invitation of Dr. Ho, Director General of ABRI, Dan Wilkinson, Mr. Mineral Ding, Canada Wood and Dr. Koo, visited the ABRI facilities in Tainan, Taiwan.

Tainan is a two‐hour high speed train ride from Taipei. The fire and acoustic facilities are located at one campus location. We were met by Mr. Ming‐Ju Tsai, the Research Laboratory Head (fire facility) and Mr. Jau‐Cho Lin, Associate Researcher (acoustic facility).

The fire facility is consisted of several buildings including fire resistance material testing facility, smoke control tower, partial fire prevention test chamber and fire durability construction test facility.

ABRI Fire and Acoustic Facility Model

4_v18n3 ABRI Fire Test Preparations

Example of wall panel fire test       ABRI actual test preparation

The fire assembly test facility has equipment to carry out wall and floor fire tests. There was no test scheduled at the time of visit although there were assemblies being prepared for testing.

The duration of the visit to the facilities is very short. As a result, we did not review the calibration equipment, its data recording equipment and test monitoring room although we did witness multiple wirings from test equipment and setups on the floor. It is interesting to note the ABRI had also built a smoke chamber tower, similar to NRC Almonte, ON facility.      

We then visited ABRI Acoustic Building and Laboratories (Architectual Acoustics Laboratories). The chambers consist of Sound Absorption Coefficient Testing Lab, Airborne Sound Insulation Testing Lab for Sound Intensity and Sound Pressure. The hammer equipment used for IIC (Impact Insulation Class) was also present on the floor. Again, all necessary test equipment and procedures are similar to North American ASTM procedures.

Room 1 and 2  sound transmission 249x187 Acoustic test room

Examples of various acoustic test setups

 Canadian Team and Dr. Ho ABRI

 Dr. Koo FPInovations,  Buddha, Dr.  Ho  ABRI and  Mineral Ding  BCWood

December 11-14 TaipeiBex 2014, Taipei International Building, Construction and Decoration Exhibition

The AFPA/FPInnovations booth was one of the booths under the Canadian Pavilion. This booth is manned by Mr. Wilkinson, Ms. Chen and Dr. Koo as the Alberta delegation.

This is a fairly large show and claimed 56,000 attendees in 2013 with media interviews as well as politicians visiting the international booth.

The Canadian Trade Office in Taipei printed a Canada Pavilion guide – titled Sustainable, Affordable and Livable. The highlight on the AFPA and FPInnovations was on p.2 of the document.

 TaipeiBex Promo

During the duration of Taipei BEX 2014 which started on Thursday, Dec 11 to Sunday, Dec 14, the team greeted visitors to the booth and provided product information to interested groups such as lumber purchasers, engineers, architects, politicians, academia such as professors and students.

TaipeibextaipeiBex  offical delegation

 Canada pavilion

December 12th Presenting at Canadian Green Building Materials Introduction Seminar

Seminar

The Grading presentations presented by Dan Wilkinson and Mineral Ding BCWood are the same ones that were

The seminar was well organized with local industry presentations in the morning and Canadian presentations in the afternoon. Canadian government officials were present to welcome the Taiwan government officials and the delegates. There were about 30 ‐ 40 attendees at the sessions. This was a focused group of interested people and raised good relevant questions.

Alberta Forest Products – Export Market Opportunities Assessment

Taiwan

January 17, 2013 Updated January 2015 by CTOT

Highlights

Taiwan is a thriving democracy, vibrant market economy, and an attractive export market for North American companies. The Taiwan economy has rebounded well from the financial crises of 2010, and has shown an upward trend in GDP growth from 2.06 percent (2012), to 2.23 percent (2013) to the previous year’s GDP growth of 3.74 percent. The GDP growth rate in 2014 compares favorably with neighboring countries including South Korea (3.3 percent) and Singapore (2.8 percent). With a major component of corporate cost structures being in energy products, any prolongation of the current low oil prices will serve as a stimulus to local manufacturing, increasing Taiwanese competitiveness – note that Taiwan is almost entirely dependent on foreign raw materials including hydrocarbons.

Taiwan has an active and well-established bilateral trade relationship with Canada, and offers excellent potential for export and trade investment opportunities. Low unemployment and an appreciating Taiwanese currency make Canadian goods and services attractive to Taiwan buyers. In particular, the Taiwanese currency has appreciated 20 percent against the Canadian dollar over the last four months to February 2015.

Taiwan produces no commercially significant quantities of wood and relies on imports for effectively all of its consumption. Native forests are virtually off limits for harvesting, leaving only a small plantation base as Taiwan’s domestic source of commercial fibre. Consequently, imports are expected to grow to satisfy increasing wood fibre needs for Taiwan’s domestic needs plus export-oriented products that are increasingly being made under Taiwanese supervision in neighboring countries such as China, Vietnam, Thailand and Myanmar.

Overall, Taiwan is the 4th largest lumber importer in East Asia next to China, Japan, and Korea. In 2010, softwood lumber consumption increased to an estimated 766,000 m3, a record high. Wood products consumption per capita increased by 20% in 2010, over 2009. Canada is Taiwan’s main source of softwood lumber, followed by the US, New Zealand, Australia, and Chile. Imports from Canada over the five years from 2009 – 2014 have nearly tripled for wood products (to $108 million) most of which was softwood lumber supplied by BC companies. Pulp sales are also growing rapidly at 15 percent annually – Canada continues to be the largest supplier of wood pulp to Taiwan at $175 million in revenues for 2014.

Taiwan’s government has supported wood frame construction since the 1999 earthquake that destroyed or damaged over 200,000 homes. Over the past few years, Taiwan has been working through a process of normalization of wood as an accepted structural material however; most construction in wood frame to date has been for resorts, and other recreational property. The Canadian Trade Office in Taipei, with the assistance of industry groups including the Alberta Forest Products Association and with other nation’s representatives including the American Institute in Taiwan, have been working extremely hard with Taiwanese authorities towards the introduction of a much more wood-friendly fire code chapter in the Taiwanese Building Code. This effort is now at the stage of identifying and doing conclusive burn tests on sample wall, floor and ceiling assemblies. Once these tests are completed, Taiwanese builders can avoid the added financial and resource burden of repetitive testing of wood assemblies for each project.

Structural wood represents a promising area of growth, however creating a lumber and timber frame market that is sustainable and commercially viable, will depend on the acceptance of wood as a viable construction material by real estate developers, domestic banks, insurance providers, as well as increasing the availability of architects, engineers, and workers trained in wood construction techniques. A revamped Building Code will be of great assistance, as will greater acceptance of wood-based building products including Engineered Wood Products. Of note, Taichung, Taiwan is the home to Asia’s first 5 storey Cross-Laminated Timber building, which is also the first such project to be approved for mortgage financing in Taiwan.

The Government’s approval of revisions to regulations regarding construction using wood, in particular the fire code (2009), is expected to clear the way for large commercial scale wood and timber frame construction projects, and allow for development of upscale market opportunities such as new townhome and single home communities, and large scale tourism projects. Western style homes in wood frame construction represent a higher standard of living for many Taiwanese, and it is expected that wood frame construction will grow in acceptability over the next decade and account for approximately 2% of new construction starts.

The Construction and Planning Administration (CPA), as well as district government planning offices, are beginning to favor the use of treated softwood and engineered wood products, rather than traditional concrete and steel, in the construction of public recreational infrastructure. This policy change, along with the growth in apartment re-sales is creating an increasing demand for hardwood and softwood renovation and new construction materials.

Taiwan authorities wish to demonstrate the benefits of green building technologies, increase the practice of green building, and make information on green building more readily available. The Ministry of the Interior announced that they are increasing the use of green materials in the construction of public and commercial buildings, from 5% to 30%. The use of sustainable energy resources has become a major focus of the construction industry.

Taiwan companies have stated that they like the quality of Alberta lumber, but the added transportation cost can present a challenge in a price competitive market. As a result, Alberta companies sold a negligible volume of lumber to Taiwan in 2014, although pulp sales were reasonable from Alberta at $26 million (up 10% over 2013). In 2014, semi-chemical wood pulp was the 3rd largest Alberta export to Taiwan after base metals (scrap steel, copper) and mineral products (coal).

Some Taiwanese companies have indicated that an increase in the availability of metric cut lumber and reman products would be beneficial.

Taiwan’s consumption of particleboard increased by 24% in 2010, and MDF increased by 39%, which surpassed pre-recession volumes. Interior design wood primarily consists of composite material faced with hardwood veneers. The largest current sources of supply are Europe and Thailand.

Taiwan’s heavy reliance on imported wood products together with its strong economic performance, proximity to Mainland China, and a growing demand for North American lifestyle high quality goods and services, makes it a long-term important market for Canadian producers. Taiwan is a strong potential partner in the development of global supply chains given its strength in contract manufacturing and in global value chains in third countries such as China, Vietnam and Myanmar for the manufacturing of furniture and building products.

 Country Information

Region: East Asia

Background:

 Taiwan map

Taiwan is an island which has, for all practical purposes, been independent since 1950, but which China regards as a rebel region that must eventually be reunited with the mainland. China has claimed sovereignty over Taiwan since the end of the Chinese civil war in 1949, when the defeated Nationalist government fled to the island after the Communists, under Mae Zedong, swept to power. Long-standing tensions with the mainland have eased since the China-friendly President Ma Ying-jeou took office in 2008. In 2009, leaders of Taiwan and China exchanged direct messages for the first time in 60 years. In 2010, the two countries signed an historic trade pact leading to China becoming Taiwan’s largest export market. China continues to insist that nations cannot have diplomatic ties with both China and Taiwan.

 Area: 36,000 sq. km

Population:   23.4 million (July 2014 est.)

Growth Rate: .25% (2014 estimate)

Literacy rate (Age 15+ can read and write): 96%

Age structure:

15-64 years: 74%

65 years and over: 11.6%

Language(s):  Mandarin Chinese (official), Taiwanese, Hakka

Major Cities:  Capital – Taipei, New Taipei City, Kaohsiung, Taichung, Taoyuan, Tainan.

Climate:  Tropical; marine; rainy/monsoon season June to August; cloudiness is persistent and extensive all year.

Natural Resources:  Small deposits of coal, natural gas, marble, and asbestos

 Political Environment

 Government: Presidential Republic, with multi-party Parliamentary Democracy (next elections 2016)

Political Outlook: Stable

Under Canada’s “one China” policy, Canada does not recognize Taiwan as a sovereign state and does not maintain official, government-to-government relations with Taiwan. Taiwan does not have a Diplomatic or Consular Mission accredited to Canada. Canada’s interests are served by the Canadian Trade Office in Taipei, and Taiwan’s Canadian interests are represented by the Taipei Economic and Cultural Office (branches in Ottawa, Toronto, and Vancouver).

State of the Economy

 After five decades of hard work, Taiwan has transformed itself into a leading producer of high-technology goods. Taiwan is the world’s largest manufacturer of computer monitors, and a leading PC supplier. As the global economy improves, Taiwan is expected to continue to show advantages in innovation, R&D, human resources, transportation, and communications.

Taiwan’s economy continues to expand at about 5% per year with almost full employment, and low inflation.

Taiwan is the fourth largest holder in the world of foreign exchange reserves, with over US $423 billion in 2015 (fifth largest reserves worldwide).

Taiwan’s diplomatic isolation, low birth rate, and aging population will lead to major long-term challenges in labor shortages, falling domestic demand, and declining tax revenues.

GDP (2011): Growth rate: 3.74% vs. Canada 1.6%

  • GDP: US$ 484 billion vs. Canada $1,825 billion
  • Per capita GDP (PPP): $39,600 vs. Canada $43,100

Currency: Taiwanese Dollar  (TWD)

    • Exchange rate: $1 CDN = 25.04 Taiwanese Dollars (2015 February)

Unemployment: 4.1% (2014)

Inflation rate: 1.1% (2014)

Economic Outlook: Stable

 Business Environment

 Taiwan is a thriving democracy, vibrant market economy, and an attractive export market for North American companies. The Taiwan economy has rebounded well from the financial crises of 2010, and has shown an upward trend in GDP growth from 2.06 percent (2012), to 2.23 percent (2013) to the previous year’s GDP growth of 3.74 percent. The GDP growth rate in 2014 compares favourably with neighbouring countries including South Korea (3.3 percent) and Singapore (2.8 percent). With a major component of corporate cost structures being in energy products, any prolongation of the current low oil prices will serve as a stimulus to local manufacturing, increasing Taiwanese competitiveness – note that Taiwan is almost entirely dependent on foreign raw materials including hydrocarbons.

Low unemployment and an appreciating Taiwanese currency make Canadian goods and services attractive to Taiwan buyers.

Taiwan is a member of the Asian Development Bank, the WTO, and the Asian-Pacific Economic Cooperation Forum, which reflects Taiwan’s economic importance, and desire to become further integrated into the global economy.

Taiwan’s economy is becoming increasingly linked with China.

  • An “Economic Cooperative Framework Agreement” with China has further increased Taiwan’s exports to China.

In 2014, Taiwan was ranked 13th (China 23rd) of 60 economies in a global competitiveness assessment by the International Institute of Management Development.

In 2012 the World Bank ranked Taiwan at 18th of 185 economies with regard to the ease of doing business. Of note, Taiwan has continually made improvements in the ease of dealing with construction permits.” “These changes eliminated 14 procedures, and 31 days from the permitting process.”

Key Industry Sectors: agriculture, biotechnology, electronics, communications and information technology

Taiwan ranks as Alberta’s 10th largest export market.

  • Alberta has maintained a presence in Taipei since 1988 through the Canadian Trade Office in Taipei, established for the purpose of promoting greater trade and business relations between Alberta and Taiwan. This office is available to assist Alberta companies interested in establishing bi-lateral business contacts in Taiwan.

The Canadian Trade Office in Taipei (CTOT), a locally incorporated entity established to facilitate and increase two-way trade and investment, and staffed by Canadian government and local Taiwanese personnel, has represented Canada in Taiwan since 1986. The Alberta Taiwan Office is co-located with the CTOT, and has been providing services specifically to Alberta companies since its inauguration 1988.

Trade

Exports:
$305.8 billion (2013 est.)country comparison to the world: 20$299.8 billion (2012 est.)
Exports – commodities:
electronics, flat panels, machinery; metals; textiles, plastics, chemicals; optical, photographic, measuring, and medical instruments
Exports – partners:
China 27.1%, Hong Kong 13.2%, US 10.3%, Japan 6.4%, Singapore 4.4% (2012 est.)
Imports:
$268.5 billion (2013 est.)country comparison to the world: 19$268.8 billion (2012 est.)
Imports – commodities:
electronics, machinery, crude petroleum, precision instruments, organic chemicals, metals
Imports – partners:
Japan 17.6%, China 16.1%, US 9.5% (2012 est.)

 Wood Products & Wood Frame Construction – Opportunities and Challenges

 Opportunities

Taiwan produces no commercially significant quantities of wood and relies on imports for effectively all of its consumption. Native forests are virtually off limits for harvesting, leaving only a small plantation base as Taiwan’s domestic source of commercial fibre. Consequently, imports are expected to grow to satisfy increasing wood fibre needs.

Although Taiwan continues to produce some medium to high-end items domestically, most production has moved to China, Vietnam, Cambodia, and Thailand due to lower labour costs. Opportunities to secure contracts with Taiwan buyers for sales of lumber destined for processing for the export market should not be overlooked. It is estimated that more than one third of furniture exported from China and Vietnam is produced in Taiwan invested facilities. In many cases, materials purchasing decisions for China and Vietnam production remain the responsibility of corporate headquarters located in Taiwan.”

Housing prices in Taipei have risen sharply in recent years due to a substantial difference between supply and demand. In 2010, the Council for Economic Planning and Development developed a “Plan to Enhance Soundness of the Housing Market”, which addresses housing needs for low to mid-income earners.

Structural wood represents a promising area of growth, which may be relied on increasingly for Taiwan’s housing needs. However, creating a lumber and timber frame market that is sustainable and commercially viable will depend on the acceptance of wood as a viable construction material by real estate developers, domestic banks, and insurance providers. Wood frame construction is currently a niche market, but demand for low grade SPF for packaging and concrete forming is growing. A recent revision to Taiwan’s timber standards now makes all wood species, including SPF, acceptable for construction. Wood products consumption per capita increased by 20% in recent years. Taiwan companies like the quality of lumber from Alberta. One company is interested in importing poplar logs for veneer for LVL production.

Over the past few years, Taiwan has been working through a process of normalization of wood as an accepted structural material. It is expected that wood frame construction will grow in acceptability over the next decade and account for approximately 2% of new construction starts. In 2010, softwood lumber consumption increased to an estimated 766,000 m3, a record high. Imports from Canada grew by 51%, most of which was supplied by BC companies. Overall, Taiwan is the 4th largest lumber importer in East Asia next to China, Japan, and Korea.

The government’s approval of revisions to regulations regarding construction using wood, in particular a new fire code is expected to clear the way for large commercial scale wood and timber frame construction projects, and allow for development of upscale market opportunities such as new townhome and single home communities, and large scale tourism projects. A revamped Building Code will be of great assistance, as will greater acceptance of wood-based building products including Engineered Wood Products. Of note, Taichung, Taiwan is the home to Asia’s first 5 storey Cross-Laminated Timber building, which is also the first such project to be approved for mortgage financing in Taiwan.

There is a growing demand for North American lifestyle high quality goods and services. This opens opportunities for producers of lumber, engineered wood products such as CLT and customized components for interior and exterior fittings.

The use of sustainable energy resources has become a major focus of the construction industry. Taiwan authorities wish to demonstrate the benefits of green building technologies, increase the practice of green building, and to make information on green building more readily available. The Ministry of the Interior announced that they are increasing the use of green materials in the construction of public and commercial buildings, from 5% to 30%.

Canada is Taiwan’s main source of softwood lumber, followed by the US, New Zealand, Australia, and Chile. Imports from Canada over the five years from 2009 – 2014 have nearly tripled for wood products (to $108 million) most of which was softwood lumber supplied by BC companies In the first half of 2014, Taiwan was Canada’s 4th largest softwood lumber export market by volume after the U.S., China and Japan. Taiwan’s wood import profile has made a successful transition from products channeled into the manufacture-for-export market to products imported primarily for domestic consumption.

Alberta companies sold a negligible volume of lumber to Taiwan in 2014, although pulp sales were reasonable from Alberta at $26 million (up 10% over 2013). In 2014, semi-chemical wood pulp was the 3rd largest Alberta export to Taiwan after base metals (scrap steel, copper) and mineral products (coal). Pulp sales are also growing rapidly at 15 percent annually – Canada continues to be the largest supplier of wood pulp to Taiwan at $175 million in revenues for 2014.

Despite fluctuations based on economic circumstances, Taiwan’s heavy reliance on imported wood products together with its strong economic performance, proximity to mainland China, and centrality in the supply chain and decision making for value added products makes it a long term important market for Canadian producers.

Geographic, Demographic, and Cultural Components Affecting Current and Future Use of Wood for Residences and Commercial Buildings

New Home Construction

Taiwan’s government has supported wood frame construction since the 1999 earthquake that destroyed or damaged over 200,000 homes. Over the past few years, Taiwan has been working through a process of normalization of wood as an accepted structural material however; most construction in wood frame to date has been for resorts, and other recreational property.. The Canadian Trade Office in Taipei, with the assistance of industry groups including the Alberta Forest Products Association and with other nation’s representatives including the American Institute in Taiwan, have been working extremely hard with Taiwanese authorities towards the introduction of a much more wood-friendly fire code chapter in the Taiwanese Building Code. This effort is now at the stage of identifying and doing conclusive burn tests on sample wall, floor and ceiling assemblies. Once these tests are completed, Taiwanese builders can avoid the added financial and resource burden of repetitive testing of wood assemblies for each project.

Western style homes in wood frame construction represent a higher standard of living for many Taiwanese.

Housing prices are rising due to a substantial gap between supply and demand.

Home Renovation

Growth in apartment re-sales is creating an increasing demand for hardwood and softwood renovation materials. Interior design wood primarily consists of composite material faced with hardwood veneers.

Office Renovation

Public Infrastructure

The Construction and Planning Administration (CPA), as well as district government planning offices, are beginning to favor the use of treated softwood and engineered wood products, rather than traditional concrete and steel, in the construction of public recreational infrastructure.

Preferred Products

Softwood Lumber

The use of wood in housing construction is growing as the building industry moves increasingly to “green” material alternatives.

The availability of metric cut lumber and reman products would benefit some importers.

 Wood Based Panels

 Taiwan consumed approximately 1.5 million m3 of hardwood and softwood panel boards during 2010, which was still below pre-recession demand. The majority of Taiwan’s imports are hardwood plywood from Malaysia, followed by softwood plywood from China. “Canada has not exported plywood to Taiwan in recent years.”

Taiwan’s OSB market is small, most of which is imported from Canada.

Taiwan’s consumption of particleboard increased by 24% in 2010, and MDF increased by 39%, which surpassed pre-recession volumes. The largest sources of supply are Europe and Thailand.

Furniture, Cabinetry, and Other Value Added Wood Products

 Taiwan represents an excellent opportunity to market differentiated, value-added wood products.

  • “Thermal wood” (carbonized wood from Alberta) being used for exterior decking.
  • Currently importing remaned pine from plants in Alberta for use in furniture.

The bulk of the engineered wood market consists of low-end plywood and particleboard. Changes in construction regulations will spur interest in high-end engineered wood products such as glulam, LVL, etc. Of note, Taichung, Taiwan is the home to Asia’s first 5 storey Cross-Laminated Timber building, which is also the first such project to be approved for mortgage financing in Taiwan.

 Pulp and Paper

 Pulp sales are also growing rapidly at 15 percent annually – Canada continues to be the largest supplier of wood pulp to Taiwan at $175 million in revenues for 2014.

Environment standards

  • Fire resistant products
  • Sound proofing
  • Energy efficiency

 Market Access Considerations

Import duties

  • Coniferous or softwood lumber: %
  • Particle board: %
  • Pre-fabricated buildings: %

Phytosanitary/Heat Treatment Regulations

Treated Wood Regulations

 Potential ways of entering the market

  • Create joint opportunities to work with developers and builders;
  • Sell via importers/agents (commonly done in Taiwan); and
  • Incorporate a corporate presence.

 Market Detail

 Taiwan Wood Products Imports From Canada – Major Products*

  $CDN Million 
  2009 2010 2011 2012 2013 2014 14/13
Lumber 32.2 58 73.3 73 82.8 108 30.4%
Wood Pulp 121.7 134.6 136.7 151 152.4 175.4 15.1%

* Data source Statistics Canada


Taiwan Wood Products (M3) Consumption, Production, Exports, and Imports – 2010*

  Consumption Domestic Production Total Exports Total Imports From Canada Canada % of Total
Softwood Lumber 766,054 8,000 10,060 768,114 356,085 46%
Plywood 1,477,067 780,660 34,567 730,974 0 0
MDF & Fibreboard 163,807 0 8,385 172,192 2,432 1%
Particleboard & OSB 308,530 0 1,129 309,660 6,746 2%
Total 2,715,458 788,660 54,141 1,980,940 365,236 18%

   * Data source FPInnovations – August 31, 2011 

Lumber

 Taiwan Import from World – Coniferous Wood Sawn Or Chipped Lengthwise, Sliced Or Peeled, Whether Or Not Planed, Etc., Over 6 Mm (.236 In.) Thick

Taiwan Lumber Imports M3
2006 2007 2008 2009 2010 2011 2012(f)
Canada 222,763 329,640 281,218 223,981     365,000 379,126 349,799
Australia 99,020 79,694 77,498 86,028 84,789 63,964 26,951
New Zealand 111,610 61,481 98,203 73,724 93,336 112,277 58,500
United States 60,987 59,948 82,307 112,166 137,314 164,280 126,035
Europe 41,039 20,515 49,946 21,876 31,607 42,651 25,726
Other 168,591 153,794 113,579 70,647 77,353 88,340 44,694

 Taiwanese Lumber Imports

* Source: International Wood Markets Group though ASRD

 Panelboard Products

Taiwan OSB Imports – million sf 3/8″ basis
2006 2007 2008 2009 2010 2011 2012(f)
World 5.35 5.73 13.06 14.78
Canada 4.77 4.14 12.20 14.34
Other 0.58 1.59 0.86 0.45
  • Source: International Wood Markets Group though ASRD

 Pulp and Paper Products

Taiwanese Coniferous Pulp Imports
000 mt 2007 2008 2009 2010 2011 2012 (f)
Canada  119.05  111.27  89.34  94.09  88.35  83.10
United States  51.77  56.16  62.00  60.87  60.54  46.20
Chile  60.22  48.87  44.15  59.43  70.57  57.95
New Zealand  13.13  9.46  8.20  11.23  6.38  12.12
Other  7.73  3.19  3.22  7.75  6.35  11.55

* Source: International Wood Markets Group though ASRD

Taiwanese Pulp Imports million tons
Million mt 2007 2008 2009 2010 2011 2012 (f)
Deciduous 0.23 0.24 0.24 0.23 0.24 0.21
Coniferous 0.25 0.23 0.21 0.23 0.23 0.21

* Source: International Wood Markets Group though ASRD

 General Market Challenges

 Because Taiwan is typically inundated with products from China and other low cost producers in Asia, it is a target market for high-quality, differentiated products, rather than commodity items.

It is a price sensitive market and imported products must conform to specified standards.

 “While the building and fire codes increased opportunities for wood frame construction in Taiwan, consumer perceptions on durability, termite resistance, and cost remain as obstacles to widespread use.”

Challenges hindering commercial scale utilization of wood in construction projects include gaining acceptance by domestic financial and insurance intuitions, alleviating latent consumer concerns regarding wood’s longevity, and expanding the availability of architects, engineers, and workers trained in wood constriction techniques. Canada Wood, and the Canadian Trade Office have been conducting worker-training sessions since 2008 including specific events to highlight EWP products and Canadian lumber grading standards and practices.

 Market Strategy and Recommendations for Companies Entering the Market

To gain their initial foothold, new-to-market exporters are advised to find a local partner to serve as an agent, distributor, and/or representative.

The majority of firms in Taiwan are small to medium sized enterprises that are active in trading and manufacturing, and offer a pool of potential trade partners that can capably represent N.A. companies in Taiwan.

Alberta companies interested in developing markets in Taiwan could:

  • Contact the Alberta Taiwan and the Canadian Trade Offices in Taipei, for assistance in establishing bi-lateral business contacts in Taiwan.
  • Support and participate in trade shows organized by the Alberta Taiwan Office.
  • Support the Canadian Trade Office in Taipei in their efforts to convince domestic banks, insurance companies, and developers of the benefits of using wood as a construction material.
  • Participate in the Global Buyers Forum – Sept. 9-11, 2015 in Whistler BC; organized by BC Wood. Target audience is international wood buyers and sellers.
  • Contact “United Forestry Products Corporation. General Managers: Philip Hsian and Scott Hsiao.
    • Lumber and re-man sales. Largest sawn timber importer. 100% softwood sourced globally.
    • Products: wood for packaging, pallets, construction, and landscaping.
    • Currently import spruce from Europe, Radiata pine from Chile, pine from New Zealand, poplar from Europe.

Useful Contacts

 Alberta Taiwan Trade Office (ATTO), established in 1988, and located in the Canadian Trade Office in Taipei, for the purpose of promoting greater trade and business relations between Alberta and Taiwan. This office can help Alberta companies establish bi-lateral business contacts in Taiwan. http://www.albertacanada.com/taiwan/

  • Canada Wood: www.canadawood.com
  • Economic Development Canada (EDC): www.edc.ca
  • The Canadian Trade Office in Taipei (opened in 1986) represents Canadian interests in Taiwan in the absence of formal diplomatic relations. Its mandate is to promote Canadian economic interests in the region. Contact: Venus Chen, Trade Commissioner, Government of Canada “Canadian Trade Commissioner Service”: www.tradecommissioner.gc.ca
  • Canada Business Network: http://www.canadabusiness.ca/eng/page/2702/

Information Sources

 Canada Business Network – International Market Research

Foreign Affairs and International Trade Canada

Trade Commissioner Service of Canada

Canada Business – “Steps to International Market Research”

Industry Canada – Trade Data Online

FPInnovations

International Trade Administration Export Portal

Central Intelligence Agency – The World Fact Book

BC Forestry Innovation Investment (FII Vancouver)

Canada Wood Group, Vancouver

Canada Business – Exporting

Export Development Canada (Financing)

Business Development Bank of Canada

Wood Markets Group, Vancouver (Consulting Service)

US – Department of Commerce

BC Council of Forest Industries (COFI)

BC Forest Investment and Innovation

Forest Industry Development Branch, Forestry Division, Environment and Sustainable Resource Development –     “China and Taiwan Mission” Report: May 11 to June 5, 2012

 BC Forest Investment and Innovation has a 2015 Update on Exports to Taiwan available to members or by special permission.

http://www.bcfii.ca/wp-content/uploads/downloads/2015/08/Taiwan-Market-Update-Aug-15-Data-to-Jun-15.pdf

AFPA BCWood Pavilion Housing Brand Exhibition22 – 25 January 2015 / South Korea, Seoul

Busan

Mission Objectives and Results:

1) Work with BCWood at the Housing Brand 2015 Fair-deploy market materials in Korea Completed Show. Rolled out new Korean AFPA card company profiles, and grading supplement to Alberta Buyers Guide. There were 180 visitors to the booth over the 4 days.
2) Continue market investigations in Seoul and Busan. Seven site visits carried out in the Seoul and Busan area. See Mission Notes below.
3) Meet with Canada Wood and discuss program for next year. Potential grant funding losses from Alberta severely impact future planning for Korea Wood.
4) Meet with Alberta Trade Office and Embassy Trade Office staff in Seoul. Completed. Discussions on possible event to open the Gapyeong Daljeon Demonstration project. Canada Trade office working with European Union and the United States in response to new wood product regarding requirements in Korea.

Recommendations:
1) Subject to funding, plan to attend Housing Brand show next September and the Architecture Fair in the fall if it can be tied into Japan activities.
2) Continue developing wood buyer contacts in key ports in Korea.
3) Assist ESRD with Gapyeong Daljeon Demonstration if required.
4) Work with FPInnovations on an industry mission to Korea and Japan subject to funding availability and interest.

The BCWood Canada Wood pavilion consisted of 7 exhibitors including BCWood and AFPA. There were several hundred visitors to the Pavilion of which about 180 left their cards at the BCWood /AFPA portion of the pavilion.

canada wood pavillionAFPA booth.jpg

Canadian Pavilion and AFPA Booth

January 26

JinSung Ind Co., Ltd Wood home building materials importer and distributor www.jslogis.com

Jin Sung Ind

Jing Sung Ind business is about 10 years old. The Hong family been in building materials trade for 50 years. Produces a wide variety of materials for shipping, especially pallets. The pallets are high quality and designed to be re-used for long periods of time. Interested in sourcing more 2 and better SPF for pallets as well as plywood and MDF. Buying from Alberta might be too expensive for this company

Other business line is a joint venture partnership with large European Company Megawood which produces outdoor building materials, outdoor furniture and decking.

KWBA (Korea Wood Building Association) & Land Lovers Korea Co., Ltd          www.wooddesign.or.kr                     www.landlovers.co.kr

Honorary Chair Prof. Kim, Jin Hee KWBA and Kim, Sang Byung CEO Landlovers The KWBA is the major prof essional and industrial society of wood design and architecture in the KOREA. This is the third time we have meet with KWBA.
Kim, Kwang JungPresident: Kim, Kwang JungHonorary Chair Prof. Kim, Jin HeeProf. Kim Jin Hee
      KWBA (Korea Wood Building Association)The Korea Wood Building Association develops and educates wood building design and skills in Korea. They target the architecture and construction industries. The KWBA promotes wood technical events and various education programs to increase public awareness of wood material and building design. Promotion of wood buildings for Korean quality of life and health is an overarching goal of the association. This Association was incorporated in 2001 and has recently been recognized by the MLTM (Ministry of Land, Transport and Maritime Affairs). KWBA is a non-profit association under Ministry of Land, Transport and Maritime Affairs            Register No.79 MLTM- 2001            President  : Kim, Kwang Jung            Hor. Chair : Prof. Kim, Jin Hee            Website  : http://www.wooddesign.or.kr            E-mail    : wooddesign@hanmail.net            Address  : Seowon-Bldg. Dogokdong 954-19, Gnagnam-gu, Seoul            Tel.        : 822-553-2001   Fax : 822-516-0082
  _________________________________________________________        Education and Training ProgramWood Frame House Builder’s Program with Kookmin                 WBDC• This program is designed to provide students with the basic builder’s skills and practice in light wood framing, as well as some finishing carpentry training.        • Spring and Fall term for a year in Kunkook Unversity campus.        • With Designers : Assisting in wood frame building design specification writing and        • With Suppliers :  Explaining the capabilities and application of material and systems• With Contractors and Developers :  Estimating, making shop drawing and supervision PracticeThree month cyber studio program with KIAD Korea Institute of Arts & Design        • To provide students with a general understanding of wood building design and  practical knowledge through cyber studio projects during a three month period.Wood Frame Housing Inspection Pilot Program

• Training for those seeking to apply for site supervisor and inspector qualifications.

• Sitting for examinations are only available KWBA members who have been trained and educated at the KIAD and WBDC.

• In future, the KWBA will develop a training program with MLTM for local regional officers who would become accountable and responsible for on-site inspections.

__________________________________________________________

Technical Licensing Program        Licensing of Wood Building Designers and Technicians

• In order to get National Qualification Testing from KHRD (Korea Human Resources Development), which is the government agent for national technical qualification, testing and registration. KWBA started a Wood Design Technical Qualification Examination in 2004. That includes Carpenter and Home Inspector certification levels.

_____________________________________________________       A affiliated trainingfacilities with KWBA

Wood Building Education Institute            Best Energy Home Design Institute            Healthy Home Research Center            Modern Wood Architecture Center           Wood Building Design Center            Post and Beam System Design Center    ___________________________________________________________       Institute Collaborators

MLTM (Ministry of Land, Transport and Maritime Affairs)

AURI (Architecture & Urban Research Institute) : Korea Wood House Center            KIA (Korea Institute of Architects)            KIRA (Korea Institute of Registered Architects)            KIFA (Korea Institute of Female Architects)            KIAD (Korea Institute of Arts & Design)            KOWFA (Korea Wood Furniture & Art  Association)            AF/PA (America Forest & Paper Association)            CWK (Canada Wood Korea Office)    ___________________________________________________________       University Collaborators            Kookmin University – Institute Education

   Hanyang University – School of Architects            Kunkook University- -Continuing Education

KWBA

Update on Wood frame Construction in South Korea

See 2012 Korea mission report for further background on the association.

Last year 13000 wood frame houses built in South Korea. The goal is to double this level in ten years. Developers now have developments with at least 150 units. There are 7 major housing developments currently underway.

As Korea’s prosperity improves, there will demand for country houses. Most Koreans can still not afford to buy a single family dwelling as land prices are very expensive and mortgage rules still require 70-80% down payment with mortgage rates being quite high.

In previous visits multiple housing development had been proposed using a peanut house concept. This concept did not get traction with banks who refused to approve mortgages where multiple land owners involved. Some investors building peanut houses and live in one and rent the rest. The market for this type of house is small, currently 500 units per year. Multiple storey, multiple family wooden structures may be difficult to promote in Korea because of concerns with fire safety and the difficulty of finding qualified contractors to build them. The ultimate solution for Korea may be hybrid designs with concrete and wood.

Using wood to improve the carbon footprint is desired. The standard 2X6 house may not provide adequate for energy or air tightness. There will be new passive house standard by 2017 followed by a zero emissions house standard by 2025. See Current Work & Future Trends for Sustainable Buildings in South Korea http://www.iisbe.org/sbconferences/Korea_SB_Report_SB08.pdf

Landlovers Korea Co., Ltd www.landlovers.co.kr Landlovers Korea has its main business in development and development consultancy. Its strength in project management has seen the company taking the lead in major and high profile projects in Korea, Singapore and Malaysia. Headquartered in Seoul, Korea, the list of major and high profile projects include facility usage consulting for Seoul World Cup Stadium in Mapo-Gu, Seoul and the development project of the General Hospital located in Gangseo-Gu, Seoul. Its dynamism stems from its key focus of always listening and delivering to the expectations of the customers.

Property Development remains the main area of business for Landlovers Group. With its experiences in Korea, Singapore, Malaysia and the Asia Pacific rim in both commercial and residential, as well as customers and land owners.

As a natural progression from its business services, Landlovers are able to advise customers on the feasibility aspect of any property development. This initial engagement model is offered to customers who wish to ascertain the project development costs as well as the development value. From such feasibility studies, customers are able to set their desired level of investment returns for any project. As part of the Feasibility Studies services, property development consultancy encompasses the drawing up of the project blue prints. Landlovers with its ability to cover all aspect of property development and project management has its main strength here. From the assembly of a team of experts and consultants to execution and management of the project itself, customers are able to draw up the project blueprints which ultimately ensure the success of the project from the timeline and financial returns aspect.

Kim Sang Byung is an Architectural Engineer by profession and has extensive experience in project management. His involvement in some of the region’s high profile projects include the restoration of the Raffles Hotel in Singapore, the Parc Oasis Condominium project in Singapore and the US Embassy project in Saudi Arabia. His expertise in the construction and project management industry has also been recognized by his peers in Korea and he currently sits on various high profile industry associations including the Advisory Committee for Korea Rural Community & Agriculture Corporation. Kim in addition is also the Managing Director of Landlovers Korea Co., Ltd.

 J City Project
J-City Project (Gok Sung Goon, Cheon La Provice)
Location : Gok Sung Goon , Cheon La Province, Republic of Korea
Period of Construction : Mar 2008 ~ Sept 2011(Phase 1)
Site Area : 2,450 Acre ( Phase1: 980 Acre)
GDV : USD 1.5 Billion (Phase 1: USD 530 Milllion)
Project Summary : Retirement Village 10,000 Units of housing project consist of:§  Leasure Facilities including 36 Holes Goft Club§  Hospital & Specialist Clinic for the aged§  Commercial Shopping Complex§  Sports Center, Education Center§  Community Center & Others
Scope of Assignment :  Project Development

Location of next project site: Janhung-gun Jeollanam-do Korea

Project name: JungNamJin LOHAS Town http://cafe.daum.net/go-lohastown

Multiple stage affordable housing development with schools, recreation, commercial district and health facilities. Entice businesses and workers to develop in areas adjacent to project. Healthy living and low environmental footprint design. There will be 8 phases with project completed in 2019. Houses 900-1200 sg. ft. with passive energy and heating. Parts of complex available to other developers who can introduce their own home design and features. Developer invited us to come down and visit the project when we are next in Korea.

DFD Fashion Group ChungPyung

Redevelopment of bankrupt and abandoned villas and a golf course. Interested in working with Dave Petrina to develop new timber frame villas

January 27 Travel to Busan Port Area

Busan is the fifth busiest seaport in the world,[3] with transportation and shipping among the most high profile aspects of the local economy. Since 1978, Busan has opened three container ports including Jaseungdae, Shinsundae, and Gamman. Busan has one of the world’s largest ports and can handle up to 13.2 million TEU shipping containers per year.

The Busan-Jinhae Free Economic Zone Authority, one of two such administrations in Korea, was created to reassert Busan’s status as a traditional international trading centre. The port attracts ships from all over the globe and the surrounding area aspires to become a regional financial centre.

The Busan Port Authority (BPA) is responsible for developing, managing, and operating the Port of Busan. The BPA’s area of responsibility extends to Gamcheon Port, which supplements the Port of Busan, and Busan New Port on Gaduk Island, which was completed in 2011

Within the Port of Busan, the BPA manages the quay wall where commercial vessels berth, the fishing boat quay, piers, dolphins, anchoring facilities, storage yards and facilities, loading/unloading facilities, cargo distribution and sales facilities, and passenger conveniences. The BPA is committed to providing outstanding services that support national economic growth and make the Port of Busan a central harbor for Northeast Asia.

Busan Port

The single most dominant containerized cargo handled by the Port of Busan in 2007 was textiles (82 million tons). Other major cargoes passing through the Port of Busan included electronics (19.2 million tons), plastics and rubber (17.5 million tons), steel and steel products (10.7 million tons), chemical products (10.5 million tons), prepared foodstuffs (9.4 million tons), petroleum products (7.9 million tons), non-metal products (6.2 million tons), automobiles and auto parts (5.6 million tons), animal and vegetable products (4.6 million tons), wood and wood goods (3 million tons), fish and shellfish (2.5 million tons), cereals (1.5 million tons), cement (1.3 million tons), and other ores (1.3 million tons).

In addition to 38 million tons of “miscellaneous” goods, the Port of Busan handled other containerized cargoes in 2007 that included fertilizers, meat, scrap metal, leather, fats and oils, iron ore, rough wood, natural sand, milling industry products, sugars, petroleum and other gases, crude petroleum, and coal.

  • South Port

South Port in the Port of Busan is the largest fishing base in South Korea. South Port is home to the Busan Cooperative Fish Market which accounts for 30% of the nation’s total marine products sales volume. The Port of Busan’s Jagalchi Market is the wholesale market for refrigerated fishery products, and several processing plants are located within the Port of Busan’s South Port area. South Port covers a total of 90 thousand square meters. It includes over 4.1 kilometers of quays and a 400-meter breakwater. The waterfront area covers 23.9 thousand square meters.

Gamcheon Port

Gamcheon Port was created to handle increasing cargo volumes entering and leaving the Port of Busan and to supplement the North Port. Gamcheon Port boasts piers for deep-sea fishing vessels and costal general cargo vessels. It also includes a ship repair yard. The Port of Busan’s Gamcheon Port handles some 12 million tons of cargo per year. Gamcheon Port covers a total area of more than 153 hectares. It contains over 6.6 kilometers of quays and a 1150 meter breakwater. The quays can berth 34 vessels in sizes varying from 50 thousand tons to two thousand tons.

Busan New Port

The Port of Busan continues to grow as its volume of container traffic increases. The Port of Busan has been forced to use general quays for containers, making cargo-handling complicated and inefficient. Further, container vessels continue to grow: they become bigger and faster every day. The Port of Busan’s aging facilities preclude the docking of larger container ships.

Nam Harbor Busan

The Port of Busan is also located adjacent to an urban area, and there are limits on port expansion. The Port of Busan decided to built a modern large-scale container terminal on Gaduk Island in 1995. Construction of the new terminal began in the fall of 1997 with the goal of completing the project in 2011.

Busan New Port contains the north, south, and west container quays on Gudak Island. The quay wall of Busan New Port has berthing space of 9.95 kilometers (6.1 miles) with 30 ship berths and the capacity to handle over eight million TEUs per year.

Container Terminals

Capture 3

  • Port of Busan Gamman Container Terminal

The Port of Busan’s Gamman Container Terminal opened in April 1998. Four companies operate at the terminal: Korea Express Company Limited, Hanjin Shipping Company Limited, Global Enterprise Company Limited, and Hutchison Korea Company Limited. The facilities include 1.4 kilometers of quays and berthing capacity for four 50 thousand ton vessels. The Gamman Container Terminal in the Port of Busan covers 731 thousand square meters and has capacity to handle 1.2 million TEUs each year. The terminal is equipped with state-of-the-art container-handling equipment. Most  of lumber from western Canada is offloaded here.

  • Port of Busan Shinsundae Container Terminal

The Shinsundae Container Terminal in the Port of Busan opened in 1991. Operated by Pusan East Container Terminal Company Limited, the facilities include 1.2 kilometers of quays and capacity to berth four 50 thousand TON vessels. Covering a total of over one million square meters, the Shinsundae terminal can handle 1.2 million TEUs per year.

The Singamman Container Terminal opened in the Port of Busan in 2002, and it is operated by Dongbu Pusan Container Terminal Company Limited. The facilities include 826 meters of quays that can berth two 50 thousand ton and one five thousand ton vessels. The terminal covers 308 thousand square meters and can handle 650 thousand TEUs of cargo per year.

  • Port of Busan Gamcheon Container Terminal

Operated by Hanjin Shipping Company Limited, the Port of Busan’s Gamcheon Container Terminal opened in 1997. It contains 600 meters of quays with capacity to berth two 50 thousand ton vessels. This Port of Busan terminal covers 148 thousand square meters, and it can handle 340 thousand TEUs of cargo per year.

Cruise and Ferry Terminals

In the Port of Busan’s North Port are other cargo- and passenger-handling facilities. The International Passenger Terminal opened in 1978 under joint public operation. The terminal handles both passengers and cargo in the Port of Busan. The quay is 460 meters long with alongside depths from one to 8.6 meters. The quay can berth one 10 thousand ton, one three thousand ton, and two 200 ton vessels at one time, and the quay has capacity to handle 318 thousand tons of cargo.

The Port of Busan Coastal Ferry Terminal, opened in 1978, is also under joint public operation. The quay is 480.4 meters long with alongside depths from 6 to 8 meters. The quay can berth seven 500 ton vessels and one vessel of six thousand tons, one of four thousand tons, and one of two thousand tons.

The Central Port in the Port of Busan has been operating since 1944. It is operated by Dongbu Corporation Global Enterprise Limited. The quay is 646 meters long with alongside depths from 8.5 to 9 meters. This Port of Busan facility has capacity to berth four 10 thousand ton vessels, and it can handle 180 thousand TEUs and 756 thousand tons of general cargo. The Central Port at the Port of Busan has a 28.9 thousand square meter storage yard.

Also in business since 1944, the Port of Busan’s Pier 1 is under joint public operation and handles containers and general cargo. The quay is over one thousand meters long with alongside depths from 6 to 9 meters, and it can accommodate three 10 thousand ton vessels. With a 28.9 thousand square meter storage yard, Pier 1 can handle 381 tons of general cargo and 120 thousand TEUs of containerized cargo.

Pier 2 in the Port of Busan has operated since 1944 under joint public management. The quay is 924 meters long with alongside depths from six to 10 meters. The quay can berth one 20 thousand ton, three ten thousand ton, and one four thousand ton vessels. With a 14.5 thousand square meter storage yard, the Port of Busan’s Pier 2 can handle 2.3 million tons of general cargo and 80 thousand TEUs of containerized cargo.

Gwanganli Beach in Suyeong-gu Busan

Opening in 1944, the Port of Busan’s Pier 3 is operated by five companies. Pier 3 has a 1.3 kilometer long quay with alongside depths from 6.2 to 9 meters and capacity to berth one 20 thousand ton, three 10 thousand ton, two five thousand ton, and one 500 ton vessels. With a 61.7 thousand square meter storage yard, Pier 3 has capacity to handle 693 thousand tons of general cargo and 260 thousand TEUs of containerized cargo per year.

Pier 4 in the Port of Busan has also operated since 1944, and it is operated by Kukje Transportation Company Limited and Dong Bang Company Limited. With a 1.3 kilometer quay with alongside depth of 5.5 to 8.4 meters, the Port of Busan’s Pier 4 can accommodate one 20 thousand ton, four ten thousand ton, two five thousand ton, and one three thousand ton vessels. It has capacity to handle more than 2.3 million tons of cargo.

Operated by Wooseong Company Limited, the Port of Busan’s Grainary Pier opened in 1978. With alongside depth of 12 meters, the 371 meter long quay specializes in handling grains and can accommodate one 50 thousand tons vessel. It has capacity to handle over 1.2 million tons of cargo.

Opening in 1978, the Port of Busan’s Pier 7 was constructed to handle scrap metal and iron ore, and coal; however, decreasing volumes of cargo in those areas has led to the Pier being converted for handling of general cargo. Pier 7 can handle a total of over 3.7 million tons of cargo for the Port of Busan.

Youngdo-gu district Busan

Operated by Dongkuk Transportation Company Limited, the Port of Busan’s Pier 7-1 has a 539 meter long quay with alongside depths from 3 to 10.7 meters. It can accommodate vessels of 15 thousand (one vessel) and five thousand (two vessels) tons. Pier 7-1 has more than 20.4 thousand square meters of storage yard. Pier 7-2 is operated by Samju Shipping. Its 135-meter long quay has alongside depths from 10 to 11 meters, and it can accommodate one six thousand tons vessel. It has a 32.5 thousand square meter storage yard.

Pier 8 in the Port of Busan is used for military supplies and miscellaneous goods. Its 1 kilometer quay has alongside depths from 4.3 to 10 meters, and it can berth vessels of 15 thousand tons (3 vessels), 10 thousand tons (one vessel), five thousand tons (one vessel), and one thousand tons (one vessel). Pier 8 has capacity to handle 693 thousand tons of general cargo and 260 thousand TEUs of containerized cargo.

The Port of Busan’s Yongho Pier opened in 1990 to handle general cargoes including hazardous and refrigerated goods and fishery landings. Its quay is 210 meters long alongside depth of 11 meters that can accommodate one 20 thousand ton vessel. The Yongho Pier in the Port of Busan has an almost seven thousand square meter storage yard and has capacity to handle 456 thousand tons of cargo.

Gunwoo Housing Company http://www.gunwoo.net/

Gi Won lim CEO and Nam Hyoungman Import Manager

Gungwo

Gungwoo is the main supplier pro-store for builders in the Busan area and Jeju Island. They will be introduced to merit Kitchens as a follow-up. Looking for appearance grade lumber as well as 1 inch stock. Referred them to several companies.

Alas Korea Co Kyung Sung Timber Co.

Geuk Soo Park CEO

Looking for 1 inch lumber, plywood OSB and particle board. Passed on interests to appropriate companies.

Baesung Timber and Linwood Baesung www.linwood.co.kr

beasung

James Leem General Manager

Looking for 2 and better SPF as well as appearance grade 4 square pine for pressure treating. Using hemlock for pressure treatment as well. Wants wider SPF boards 2X10 and 12s. Would like to find a replacement for Gorman Brothers wood that had in past. Quality and amount has declined. Referred request to several mills.

January 30 Canada Wood Office Visit and Program Review

tai Jeong

 Completed a review of the past year’s program and discussed tentative plans for next year. The Korea office and program experienced cutbacks last year due to tightening of funding. Proposed further cuts to grants next year will severely impact the Korean office to remain viable.

Discussed the market situation which is detailed below.

Discussion on proposed regarding system proposed by the Korean Forestry Service. See Appendix E. This policy shift will impact Canada’s ability to continue selling products into this market. As other countries are impacted as well, diplomatic and trade representative discussions are underway. Canada Wood and American Panelwood Association will collaborate on further actions.

FPInnovations are 5 years into a 20 year field test on pressure treated Hemlock and SPF durability. FPInnovations is asking for Canada Wood and Alberta help to pay travel costs for FPInnovates staff to continue field trials.

Canada Wood and Alberta Trade office have formed a close working relationship and continue to look for opportunities to work together in the future. Most recent collaboration has been the Gapyeong Daljeon Demonstration project.

AFPA may attend the Architecture Fair with Canada wood in late September if there is sufficient travel budget to allow attendance.

Korea Market and Hosuing Lookout

By Tai Jeong

Technical Director, Canada Wood Korea

May 5, 2015

Korea Economy, Construction & Lumber Shipments

Economy

The South Korean government has recently announced plans to add a further 15 berths to Busan New Port, increasing container capacity by 15m teu.

The South Korean economy expanded 3.3% in 2014 as increased facility investments offset slowing growth in construction investment and exports. Facility investment increased 5.8% in 2014, turning around from a 0.8% on-year contraction in 2013. Construction investment growth, however, sharply slowed to 1% from a 5.5% growth in the previous year.

Private spending came in at 1.8%, remaining mostly unchanged from a 1.9% on-year gain in the previous year. Their per capita gross national income, a gauge of the population’s purchasing power, reached US$28,180, up $2,001 from 2013.Exports rose 2.8%, slowing from a 4.3% increase in 2013, while growth in imports quickened to 2.1% from 1.7%.

South Korea’s gross domestic product grew 0.8% in the 1st quarter of 2015 from three months earlier on increased construction investment and improved spending.  From a year earlier, the economy expanded 2.4% in the first quarter. Consumer spending increased 0.6% from three months earlier, slightly quickening from a 0.5% rise in the fourth quarter. Government spending growth stayed on par at 0.2%.

Growth in construction investment sharply gained 7.5% on an increase in residential building projects. South Korea posted a trade surplus for the 38th month in a row in March of 2015 by reaching US$8.4 billion, up from $7.8 billion in February and $3.5 billion a year earlier as imports dropped at a faster click than exports.  Consumer price index inched up 0.4% in March from a year earlier, the slowest pace in nearly 16 years signaling that the economy remains gripped by flaccid private consumption.

Jobless rate dropped to 4% in March from a month earlier due to seasonal factors and more hiring by the manufacturing and service sectors. Volatility in the won-dollar exchange rate hit a three-year high in the first quarter of 2015 as the foreign exchange market seesawed due to speculation over a possible U.S. interest rate hike.

The exchange rate for Canadian Dollar averaged at 882.70 won in March, 2015, dropped 8.42 % from 963.86 in March, 2014 and slightly up by 0.61% from 877.36 in one month earlier.

Housing Starts

Mounting household debt after three rounds of rate cuts in less than a year keeps policymakers wary while the recovering local housing market means borrowings could rise above the current level, putting South Korea’s household debt-to-income ratio near the top among major economies.

South Korea’s housing starts in year-to-date February of 2015 increased 6.5% to 10,389 buildings from a year earlier 9,759 buildings owing to the continuous government measures to revamp the country’s property market.  Housing permits in the same period inched up 1.1% to 11,575 buildings from a year earlier 11,453 buildings.

The number of wood building permits and wood building starts in year-to-date February of 2015 remarkably increased 24.4% to 1,896 buildings and 13.2% to 1,345 buildings respectively compared with those in 2014.

Wood Building 2010 2011 2012 2013 2014 (%)
Number of Permits 10,922 11,686 11,826 11,710 13,062 24.4
Number of Starts 9,585 10,037 10,369 10,339 11,493 13.2

Source: Ministry of Land, Infrastructure and Transport (as a percent compared to previous year same month and period)

Overall, the South Korean real estate market conditions are continuing to show signs of improvement. Apartment prices in South Korea increased at a faster rate in the first quarter of 2015 compared with a year earlier reflecting growing demand for property purchase amid low interest rates.  Prices of apartments in the Seoul area shot up 0.75%, with its pace nearly doubling from 0.39% a year ago.  Overall, apartment prices in the metropolitan area jumped 0.95%, compared with 0.54%.

South Korea’s overall home transactions shrank slightly from a year earlier in February, 2015 while the number of home transactions in the capital region surged to a nine-year high. The number of home transactions came to 78,864, down 0.4% in February from the same month last year. However, home transactions in capital Seoul jumped 10.4% on-year to 12,990 in February last month with the number for the entire capital region, including Gyeonggi Province and the western port city of Incheon, growing 4.2% to 37,502.

By type, transactions of apartment units, the most common form of housing in South Korea, slipped 1.6% on-year to 57,885 in February, while transactions of row and detached houses gained 4.6% and 0.7%, respectively, to 11,999 and 8,980.

Lumber Shipments

In 2014, Canada concluded an agreement with the EU and implemented its FTA with South Korea, Canada’s first agreement with an Asian country, as well as putting into effect an investment protection agreement with China.

BC softwood lumber export volume to South Korea for the first two months in 2015 dropped 15.5% to 31,610 cubic meters as compared to 37,418 cubic meters for the same period in 2014.  The drop was largely attributed to the three-day traditional Lunar New Year’s Day break that fell in February this year, instead of January in 2014.

However, export value in year-to-date February continued to increase 2.6% to CAD$10.309 million as compared to CAD$10.047 million in the same period in 2014, owing to the strengthened Korean won against Canadian dollar.

lumber stats

Alberta korea market share

Alberta 2014 share SPF estimate to be 12% of BC numbers and is worth about 100 Million CAN$. Market loss due to high percentage of spruce in SPF. Koreans cannot use spruce for their pressure treated products. Koreans also are looking for 4 square materials and appearance grade lumber versus normal 2 and better SPF that has wane. Alberta mills have a cost disadvantage at present due to currency fluctuations and extra transportation costs.

BC Softwood Commodity Product Sales in South Korea (Softwood lumber, plywood, OSB, MDF and Particleboard)

Meeting with Alberta Trade Office and Trade Commissioner Staff

New First Secretary is Leslie-Ann Reed who is replacing Andrea Moen recently reassigned to Tokyo.

They are working closely with their counterparts in the American Embassy on the regarding issue.

Alberta Trade office is looking for participation at upcoming lifestyle fairs. These fairs give Alberta to highlight our lifestyle and of course exports such as wood products and beef.

Will be working actively to get Alberta elected officials over for ribbon cutting of Gapyeong Daljeon Demonstration project when landscaping completed this summer. Fall 2015 may be first opportunity. Minister Thomson from BC may want to do ribbon cutting with his fall mission.

Trade Commissioner Wood Product Sector Notes 2014

    • An important producer of cement and other construction products, South Korea imports 90% of wood products used in the market.  This trend is expected to continue.
  • In 2013, South Korea imported over $570 million in forest products from Canada, including wood, pulp and paper and other forest products. Major competitors are China, the US, Indonesia, New Zealand, and Malaysia. The South Korean market receives wood products from 100 different countries and, as a result, it is implementing new regulations in order to address differences in quality.
  • In 2013, Canadian exports to South Korea of wood, printed matter, pulp and paper and related products were led by British Columbia ($301 million), followed by Alberta ($106 million) and Quebec ($78 million)
  • South Korea is working to address the carbon footprint and “sick house syndrome” from non-wood construction methods. South Korean consumers view wood as a natural, healthy product which promotes wellness which could lead to increased demand for wood-frame housing. The South Korean government is focusing on green policies, including ‘sustainable housing’, which present an opportunity to showcase Canada’s sustainable forests.
  • South Korea is generally a price-sensitive market. The sector is focused primarily on consumers who are looking at rural or leisure housing with unique wood design features. Although the overall South Korean construction market is sluggish due to over-building, there are still opportunities in these segments, as the population ages and shifts to a retirement lifestyle.
  • Recently, Canada and South Korea signed a Memorandum of Understanding (MOU) on cooperation in the field of forestry. With this MOU, it is expected that the two countries will strengthen and expand the bilateral relationship in both commercial and non-commercial areas.

·        Canada-Korea Free Trade Agreement (CKFTA)

The Canada-Korea Free Trade Agreement, which was signed in September 2014 and is expected to enter into force in the coming months, will provide new opportunities for Canadian exporters by removing tariffs and otherwise enhancing market access for forestry and value-added wood products such as lumber, plywood and oriented strand board. Market Overview

Current Issues : Korea imposing a new grading system on Canadian wood products that are already graded in North America. (See Appendix C) Re-grading will result in Canadian lumber being graded down and will fetch a lower market price in comparison with North America. Many producers are backing off this market for now. This grading system will also impact American wood producers. Both countries are making representation to the Korean government and Korean Forest Service on this issue. The Europeans are in a position to capture more market with the quality of products that fit the Korean Grading system combined with competitive prices due to a weaker Euro.

Key South Korean companies include: Samik, Dewha, NS home, Hanyang Trading, Hanglass, KCC, LG Hausys, and Eagon Windows & Doors Co. Ltd.

Canadian companies in market include:  Canfor, Interfor, Tolko, Weyerhaeuser.

  • South Korean consumers want good quality at a competitive price.
  • Interest in environmentally-friendly building materials and energy-efficient housing.
  • Business opportunities exist for:
    • wood products
    • wood frame infill construction
    • technologies to increase energy efficiency/reduce CO2

Key Wood importers:

    • Samik
    • NS Home
    • Daehwa
    • Sunchang
  • Building Products:
    • Eagon

China Mission March 25 to April 3 2015

306

Victoria Harbour Hong Kong

Mission Objectives

  • Work with BCWood Alberta Agriculture and Forestry and promote Canada Wood and profile AFPA member companies at the Interzum 28 March – 1 April 2015 China Import and Export Fair Complex, Guangzhou.
  • Share booth space with Alberta Agriculture and Forestry and host an Alberta Night at the show. Completed.
  • Do the feature presentation on Alberta at the show seminar. 
  •  Work with Guangzhou and Alberta Hong Kong trade office personnel and do site visits and follow-ups with wood manufacturing associations in the Guangdong prefecture. Completed. Mission notes presented below.
  • Continue to discuss and plan next year’s North Asia activities in light of grant funding decreases and GOA fiscal restraint measures.

Recommendations

  1. Gary Mar or Ron Hoffman were not available for discussions on this trip. A copy of the mission report should be provided to the Hong Kong Trade Office. Some initial discussions on Alberta Agriculture and Forestry \AFPA\ BCWood using and sharing an office in trade office should Alberta Trade Office. Some dollars contributed for use of space and minimal office support and connectivity.
  2. Provide the Guangzhou Consulate Office with a copy of the mission report for any follow-up to the site visits in the Dongguan. A follow-up visit to Guangzhou would be prudent to meet the new expanded Alberta Trade Office in Guangzhou.
  3. If the AFPA attends the Interzum show again a full time interpreter and connectivity would improve the effectiveness of the show for the Association.
  4. Plan another mission to conduct further grading seminars with BCWood and Alberta Government.

 Mission Notes

March 27 Informal meeting day Hong Kong

March 28 to March 30 CIFM / Interzum Guangzhou 2015

BCWood Pavillion Interzum

Canada Wood Pavilion -Courtesy Jeff Li BCWood

A total of 1,269 industry manufacturers and suppliers from 35 countries and regions gathered together at CIFM / Interzum Guangzhou 2015 to showcase their latest wares and meet with existing and prospective buyers. Among the 309 overseas exhibitors were participants from 8 country pavilions. This was the twelfth show.

Occupying 140,000 square meters of trade floor, the event was the largest to be staged in the 11 year history. Exact visitor statistics are not available but visitor estimates are between 60 and 70 thousand. Jeff Li felt attendance was down from previous year reflecting the slowdown in the economy in China and particular Guangdong region.

Product segments of Interzum Guangzhou include:

  • Materials and Components for Furniture Production ● Machinery, Materials and Components for Upholstery and Bedding ● Machinery, Materials and Components for Interior Works ● Machinery and Auxiliary Machinery for Woodworking and Furniture Production ● Others (Media, Trade Associations

Established since 2004, CIFM / Interzum Guangzhou provides furniture and design professionals with immeasurable opportunities for networking with a quality pool of local Chinese and overseas sellers and buyers.

The success of CIFM / Interzum Guangzhou 2015 has again demonstrated the significance of this event for the entire woodworking machinery, furniture production and interior design. Industry. The show may be extended from the 5 day format in 2016 based on exhibitor and visitor feedback.

Southern China is one of the biggest furniture manufacturing markets in the world, and CIFM / Interzum Guangzhou represents the only trade show in the Asia-Pacific region that can boast an international standard in terms of both visitors and exhibitors. Some 40% of China’s furniture manufacturers are located in Guangdong, where the furniture production industry is worth US$6 billion, and produces over half China’s worldwide exports.

As the world’s largest manufacturer and supplier of home and office furniture, China has become an important industry hub. It regularly attracts manufacturers of machinery, suppliers of raw materials, and final producers for this lucrative industry.

See Appendix B for list of visitors to BCWood pavilion. There were 140 significant visitors that exchanged cards.

See Jeff Li BCWood show report in Appendix C for further observations on the show.

The pavilion was excellent design and functional. Director Jeff Li has great contacts in China and his reputation drew large number of visitors to the pavilion. Majority of visitors were interested in accessing coastal and hardwood species. There were a few good leads for SPF, OSB and plywood producers. They were referred to forest companies with marketing presence in south China.

The most valuable aspect of the Interzum experience was the Alberta Reception. George Pan and Dan Wilkinson provided a quick overview of Alberta Forests and Industry. This was followed by a light buffet and network reception. About 40 potential buyers, guests and trade office people attended the reception. A number of guests exchanged cards which are highlighted in yellow in Appendix B. A copy of the presentation is provided in Appendix D.

Guangdong Site Visits. March 31 to April2 Dan Wilkinson, Christopher Lui Hong Kong Alberta Trade Office and Rita Zhang Trade Commissioner Guangzhou Consulate

Guangdong Timber Industry Association (www.gdtia.com) Ms. Jully-Lee

     IMG_2697          

Christopher Lui HK Trade Office Ms. Jully -Lee Guangdong Timber Assoc. Rita Zhou Trade Commissioner

The Association is a voluntary organization that includes timber industry enterprises, government administrative and research organizations.    Met with Ms. Jully-Lee and provided materials and an overview of Alberta forests and wood products. Ms. Jully-Lee took us to their wood identification lab and had some general discussions of the current market conditions. The Guangdong area is experiencing a significant slowdown in business due to Europe market volatility and policy changes introduced by the National Government.

Ms. Jully-Lee provided a brief overview of the Association services and major focus areas which includes:

    1. Investigation, research, collect, collate relevant national guidelines of national and prefecture level forest policy decisions, industry development and timber market information, housed in the association’s website http:. // www gdtia.com, Guangdong Yuzhu International Timber Market (http: // www .yuzhuwood.com) and “Guangdong Wood” magazine. This information is provided free of charge to members of the association free of charge. Association members may also advertise in the wood magazine.
    2.  Assist members to apply and construct credit and patent applications.
    3.  Represent members’ interests and requirements with various government agencies. Assist customs clearance dispute.
    4.  Hold seminars on laws and regulations for timber distribution, patent development and other areas of interest to members.
    5. Promote trade fairs, exhibition investment, joint procurement activities, promoting exchanges and the development of domestic timber trade.
    6. Improve the technological level of the industry and personnel by promoting technological progress.
  • Promote timber production, distribution, processing through new technologies, new processes, and new products. Organize joint ventures with the industry at home and abroad, study tours and other activities to promote the development of the industry.
  • Coordination of relations industry members and non-members, consumers, and other social organizations.
  • Timber species identification, specific gravity testing, gauging timber business.

Yuzhu Market is one of four local markets in the greater Guangdong Yuzhu International Timber Market. (See Below)

 Guangdong Timber markets

Guangdong Yuzhu International Timber Market (Visited Guangzhou, Foshan and Dongguan sites previously 2013, 2014)

Yuzhu market is located at Huangpu District, Guangzhou Municipality on the bank of the Pearl River. The market possesses of a cargo wharf with 5000 ton capacity as well as water, rail and truck connectivity with domestic and international docks and harbors. There is an intermodal transfer site for unloading containers from trucks or loading them onto barges for transport back to ship loading facilities. There is road and subway line access to the rail stations, ferry and airport terminals in Guangzhou and Shenzhen.

Market area covers 360,000 m2 with stalls and office buildings covering 200,000 m2. Twelve alleyways connect with Huangpu Avenue directly, and the stores are 10m high and 6 m wide, ideal wood business. The market is divided into plank and timber; artificial panel; log trade; veneer and moulding; wood floor: wood door direct distribution; storage center, dock handling materials logistics; and the commercial informational center.

 Like many major wood market companies in China, they provide complete and coordinated services to their lessees and their customers. The market management provide coordinated process services for customers such as: business certificate of wood trade; complete industry and commerce tax registration; code certificate of enterprise; register bank accounts; deputize the business licenses for import & export wood products; sale wood products by proxy; provide a loan service for businessmen in the market; timber quarantines paperwork and wood product and log transportation.

Yuzhu International Timber Market manages many kinds of top- grade wood imported from all over the world. In 2014, the trading volume of wood in the market was more than 1 million m3 worth 2.5 billion Yuan. The terminal logistics transaction fees topped 8 billion Yuan.

Yuzhuwood.com is the biggest e-commerce platform of Chinese timber industry and the information service platform that accesses the timber market worldwide. There are 50000 registered companies from over 100 countries.

The website offers the following features: market quotation, information issue, products display & trade, global wood price. The real-time update of prices of wood and products at home and abroad, and market quotation based on the physical market. The platform provides a forum for registered sales people and purchasers to do business both on-line and off-line. Yuzhuwood also provides market intelligence data, data collection and editing services, an online shopping mall with 140,000 registered members.

After meeting we walked through market and talked to some of the companies that are interested in acquiring more western Canada wood products. Gave an overview to Mr. Liu of Senyuan Wood Industry an overview. He thought our SPF wood was good but too expensive.


SenYuan Wood Industry has decades of experience in the timber business. They are currently focused on Latin American timber such as: Red Sandalwood, South America Pear, Snakewood – Piratinera guianensis (Mulberry) , Argentina green sandalwood, red sandalwood, South America purple core hematoxylin (Mahagony), iron pigeonpea, and other high end valued hardwoods. They source their wood from legal and sustainable sources. They were curious about Alberta wood but think the species and quality is not suitable for their customers.

Wed, Apr 1 Morning Meeting with the Consulate General of Canada in Guangzhou

Met with Duane Robson Counsul & Senior Trade Representative who has recently been transferred to Guangzhou. Duane last posting was in Seattle and before that two different portfolios in Tokyo. Discussions around Chinas politics and the state of the economy. Duane briefed us on plans to accommodate three new Alberta Trade Office staff that has been recently announced. Hiring is currently underway. Rita Zhou who supports the wood product mission reports to Duane.

Embassy Market Report referred to during discussions is presented below.

Building Products & Construction ProfileFootnote 1– East China

  1. Sector Overview

For the recent a few years, the Chinese construction sector has experienced aggressive growth, well above the country’s already-impressive GDP growth. In 2013, the sector generated approximately CNY15.9 trillion (~CAD$2.9 t) total outputs with the growth rate of 16.1% compared to 2012, accounting for 28% of national GDP Footnote 2. Total real estate investment also reached CNY 8.6 trillion (~CAD$1.59 t) during 2013, among which 68.5% was made in residential property and half of the total investments were made in East China region. Despite the sector’s robust growth in recent years, it is generally viewed that the growth would slow down to a more moderate pace in the next five years (10%~17% according to some analysts’ estimates) in light of the surging land price and tighter regulatory control.

The Yangtze Delta River Delta region (comprised of the city of Shanghai, Jiangsu Province and Zhejiang Province), being one of the fastest growing economic centres in China, accounts for about 30% of all construction in China.

This sector is dominated by Chinese companies. As of the third quarter of 2013, there were totally 74,432 construction companies, of which 6,843 were state–owned enterprises while western firms only serve around 1% of the marketFootnote 3 . The construction sector we refer here includes developers, builders, architectural/engineering services firms, and building material providers.

  1. Market Prospects

Prospects for the construction sector remains to be promising given China’s immense need for greater housing supply and the rapid urbanization. Each year China is adding around 2 billion square meters of building spaces. China is already building one third of the buildings in the world and has the largest construction market in the world. It is estimated that by 2025 more than half of the world’s buildings would be in China.

The country’s rapidly expanding domestic economy and ongoing urbanization requires construction spending on infrastructure development and upgrading. The investment on urban rail transit is projected to surpass CNY 700 billion in the 12th FYP period with 170 cities requiring mass transit systems and 244 civil airports built by 2020Footnote 4.

The over-heating of residential property market has been a long-time issue in China. Chinese government is taking measures to increase land supply and to suppress investment-driven speculation. There are divided views regarding the trend of China’s real estate market given the disparity between supply and demand throughout different parts of China. Nonetheless, keeping the real estate market under control is high on the government’s agenda. Since 2012, China has introduced property tax in first-tier cities and raise minimum down-payment rates to limit the purchase of secondary homes.

As one of the world’s largest economies and the largest energy consumer, China now has over 40 billion square meters of buildings while only 4% of which adopt energy-saving measures. As building-related energy consumption accounts for around 40% of the country’s total energy use, the construction sector is evolving to integrate key themes such as energy-efficient and environment protection which are considered essential for China’s sustainable development. Energy and environment has been given great importance in China’s 12th Five – Year Plan (2011-2015), with the goal to construct 1 billion m2 of “green building” floor space by 2015 – up to 20% of the total floor spaces. The government also set the target that by 2020, 30% of new construction (measured by floor area) will be certificated as green buildings, according to the Ministry of Housing and Urban-Rural Development.

There has been increasing popularity among leading developers to apply for LEED certification for their high-end properties. China also developed its own green building certification, the Green Building Design Label, known as the “Three Star” in which the system assigns buildings from one to three stars (the highest). The energy efficiency label is still voluntary for most residential and non-residential buildings, but the government requires certain buildings to be certificated by at least one star, especially for government-owned large public buildings. Both central and regional governments have released various energy retrofitting subsidies to incentivize the adoption of green building standards. Although the pace is slow, the prospect is promising.

  1. Sub-sector identification

Architectural services, wood-frame structure, and building materials are the three main sub-sectors where Canadian companies and industry players remain active within China.

Architectural Services

Approximately 30 Canadian architecture companies have representation in the Yangtze River Delta region, ranging from one-person representative offices, to local subsidiaries with dozens of employees. Some companies operate from Canada in close partnership with Chinese companies. Over the last two decade, Canadian architects have designed 200 plus projects all over China, including numerous landmarks. Each of these was done in cooperation with local design institutes, as construction drawings must be “stamped” by licensed firms only.

The lack of sophistic design expertise and international reputation fosters the partnership between Chinese design institutes and their foreign counterparts however the low design fees and weak IP protection remain to be key concerns of foreign firms. Apart from that, the licensing and qualification regime is often seen as the main obstacle for foreign architectural and engineering firms to operate efficiently in China.

In coping with those challenges, finding reliable local partners and developing niche areas with fast response to a changing economy are essential for foreign players to thrive in this market. With the rapid urbanization across China, Canadian architects may find substantial opportunities in second and even third tier cities. According to official statistics (2006 to 2011), the construction “compounded annual growth rates” (CAGRs) found in many of the northeast and central provinces had consistently been higher than those of Beijing and Shanghai. Nonetheless, the first-tier cities remain as key markets for high-end Western products and services.

Wood frame Construction and Wood Products

From 2010 to 2011, the 27% growth in Canadian exports to China was in large part due to exports of wood products (wood pulp and lumber). In particular, exports of wood increased by more than 74% to almost $1.5 billion.

During 2012 China became Canada’s number-two export destination country. In this period, Canada’s global exports of articles of wood increased by 10% year-over-year while exporting to China decreased by 4%. The quantity of exports to China increased slightly but this was offset by lower prices.

Regardless, this was viewed by the Canadian wood industry analysts as a positive performance considering a massive slow-down in China’s construction activities in 2012. According to the International Wood Markets, despite the slower housing market in 2012, China’s total import and export trade value of forestry products still increased by 3% year-over-year, reaching $120 billion. Canada remains the largest lumber supplier to China in 2012 with a 31% market share (total softwood and hardwood)Footnote 5.

The Canadian forestry industry is primarily represented in China through the Canada Wood Group and BC Forestry Innovation and Investment (FII). Canada Wood is funded by member forestry associations, provinces and the federal Canada Wood Export Program. BC FII is a Crown agency of the BC Government. These two organizations are mandated to expand the market for Canadian wood products specifically dimension lumber, which is not yet a widely-used building material in modern China. These organizations work closely to develop the market and to position wood as a cost-competitive building materials in China. Their key activities include: product promotion events and training seminars, technology transfers and technical support for wood-frame structure, academic exchanges and joint research with academics, relationship development with local governments to establish relevant building and fire codes, and showcasing demonstration projects. These efforts support the Canadian forestry companies on the ground to expand their market presence. Since 2010, BC FII and Canada Wood Group have also successfully introduced wood truss reroofing programs to Shanghai, Nanjing and Qingdao.

Specialty and Green Building Products

China is one of the world’s largest producers and consumer of building materials. It remains on the top of the list in many primary building material productions including cement, flat glass, constructional ceramic and sanitary ware, stone and walling materials. The market is extremely price sensitive and competitive with many domestic and foreign players. The construction and quality standards lag behind developed countries but nevertheless there is a demand for specialized imported products which offer value and performance over domestic offerings such as energy efficient products. Chinese regulators are very risk averse when it comes to the adoption of new building materials and techniques with which they are not familiar, however the market can change dramatically due to disruptive events.

Yangtze Delta region has a large number of high-rise buildings and skyscrapers, so energy shortage is always an issue. Building products such as insulation, waterproofing, windows and frames, heating and cooling system which offer significant cost advantage and adaptable for high-rises buildings are desirable. Canadian companies need to find suitable ways to access the market, through joint ventures, distributors or wholly-owned enterprises with some manufacturing capability in China. IPR issues should also be taken into account when making such a decision. In addition, as architects are often not allowed to specify products name in their drawings, the developers are the decision makers in selecting building materials and products. The conflict of interests and lack of expertise in building materials and products require building products companies to make their presence to not only architects but also developers.

As a general guideline, the Chinese standards of “Green Building Materials” apply to the following four categories:

  • Certain proportion of building materials sourced from nearby regions (the Shanghai standard is within 500km of construction sites)
  • Enhanced efficiency and energy-saving during material production phase
  • Enhanced efficiency and energy-saving during the construction phase
  • Enhanced energy-efficiency and sustainability during the operation (post-construction) phase
  1. Challenges and growth drivers

Challenges

The majority of Chinese construction companies operate in the low value segment characterised by labour intensive, high volume and low margin activities. The lack of expertise and know-how created strong opportunities for foreign firms with advanced technology and design capacity. At the same time there are significant challenges, mainly reflected in the areas of regulation, price competition, and business practices.

In many subsectors within construction, foreign companies face strong regulatory constraints, including the minimal registered capital and assets, minimum yearly turnover, and minimum permanent personnel. In addition, usually qualifications and project experiences obtained inside of China are acceptable as references.

In the Chinese construction market, price often times outweigh quality and environmental consciousness. The misaligned incentive scheme caused developers to focus on lowering costs and maximizing profits instead of investing in sustainable design and energy-efficient products and solutions.

As in many other sectors in China, relationships are often more important than product and service quality. Domestic companies with close ties with the government often have easier access to licenses and qualification certificates granted by authorities, and most importantly better access to tendering information.

Growth Drivers

Urbanization: urbanization in China has been moving very aggressively in the recent years. In 2012, China’s urbanization rate reached 52.57% and by 2025 urban population is expected to rise to 926 million. To this end, China plans to spend CNY 40 trillion (~CAD $7.4 t) on urbanization to bolster the economy and to bring 400 million people into the cities over the next decadeFootnote 6 .

Labour force shortage: decreasing supply of construction workers will drive up the requirement on labour efficiency. According to the NBS of China, the total number of employees in China has been decreasing since 2010 while the productivity is going up. The majority of Chinese workers have gotten their salary increased by 10% in recent years. This is an encouraging sign for the promotion of Canadian wood-frame housing given its much shorter period of construction time compared to concrete and steels.

Demographic changes: the growing of elderly population has becoming a predominate issue in China. It is undoubtedly that China needs more senior care centers in an economical way. At the same time, China is gradually opening up the one-child policy and allowing couples to have second child. The potential demands for better, large and higher-quality houses will be fairly strong. The residential floor space per head in Chinese urban areas has doubled for the last decade and likely to rise to 41m2 by 2020Footnote 7 .

Energy efficiency policies: As China seeks to reduce energy consumption per unit of GDP by 16% by 2015, more and more new residential and public buildings are required to implement energy efficiency design standards aimed at saving 65% of energy use. Shanghai was identified as one of the model cities for public building retrofitting with the ambitious target to cut energy consumption by 20% for 4 million m2 of public buildings by August 2014. Hangzhou is another city required by the central government to include low-carbon development models in their regional 12th Five-Year Plan. Those government policies coupled with growing environmental awareness become the engine to drive green building practices to grow significantly in the coming years.

Canadian Government Contacts

Foreign Affairs, Trade and Development Canada North Asia Commercial Relations (GPC) Email: Mark.phelps@international.gc.ca

April 2 Shunsheng Zheng DongGuan Tuoke Jia Fu Trading Co. Ltd. www.tolkocanfor.net Old Dongguan Timber market

Mr Zheng Tolko Canfor

Mr. Zheng Tolko Canfor

Biggest SPF user in Dongguan market area. He imports J-grade, 2 and Better and economy grade. He uses Canfor and Tolko SPF, Tolko OSB. Wants to source higher grade SPF from other producers in BC or Alberta. He does not like the quality of the economy grade lumber he has been getting. Suggested 2 and better a better fit for his business. He is requesting to attend the BCWood Global Buyers Forum this year.

 April 2 Adison Trading Co (www.adisonco.com; 民耀贸易公司;Elliott Ma Hang Shun马亨顺先生;Xing Ye Timber Market, Hou Jie, Dongguan

Met Mr. Ma in 2014 at the grading seminar in Dongguan. He has recently moved to the new Xing Ye Timber market from the old Houje City market. The new market affords more spacious stalls, updated logistics for product shipments and reduced taxes. Mr. Ma business is tied to his trading company in Hong Kong. The Chinese business focuses on appearance grade west coast species such as Hemlock, Douglas fir, Alder, Wester Red Cedar, Sitka Spruce Grand Fir. He also imports appearance grade wood from Austria and Finland. He is interested in appearance grade SPF but it is difficult to find sufficient volumes. Mr. Ma hosted us to lunch.

Dongguan Changneng Construction Material Company Limited http://www.dgchangneng.com/about.html

269

We met with Jacky Wang Chairman, Jacky Yu General Manager and Lin Ryan Purchasing Manager. We gave them an overview of Alberta wood products and companies. They have bought some SPF from Weyerhaeuser. They work with Olympic Industries to place orders for Canadian wood products. Chairman Wang and General Manager Yu toured us around facility

Chang Nang Building Material Co., Ltd., was established in 2010. The company covers an area of over 30,000 square meters and has a large wood product inventory contained in warehouses and timber processing centers. The company is currently focused European and US pine lumber species as well as hemlock from BC. They manufacture domestic pine species as well as remanufacture lumber for specific customer needs.

They act as wholesaler for the building materials market, construction companies and furniture industries. The company wants to long-term and stable strategic partnerships so as to provide sufficient raw materials for their business.

They have interest in securing more appearance grade SPF from Western Canada. Company contacts were passed onto AFPA members and key timber brokers for follow-up. The photo display below shows examples of their wholesale and remanufactured products.

Market Report from Canada Wood

China Economy, Construction & Lumber Shipments

By Fred Spoke

Managing Director, Canada Wood China

June 3, 2015

Posted in: China, Market News

Economy

China’s housing sales in major cities, measured by floor space, jumped 37.4 per cent in May from a year earlier, helped by government’s stimulus policies and developers’ push to clear inventories.

HSBC flash PMI signals persistent weakness in economy.

* Reinforces expectations of fresh policy stimulus

* Output sub-index at 13-month low

* New export orders at 23-month low

* Premier Li says 7-pct growth target achievable (Repeats to remove text of earlier story; adds Premier Li comment, analyst quotes)

Chinese factory activity contracted for a third month in May and output shrank at the fastest rate in just over a year, a private survey showed, indicating persistent weakness in the world’s second-largest economy that requires increased policy support.

The poor reading, which followed a raft of downbeat April data, reinforced analysts’ views that Beijing has to take bolder steps to combat a protracted slowdown, as growth threatens to drop below 7 percent for the first time since the global financial crisis.

“The subdued flash PMI print suggests there is no clear sign of near-term stabilization in the economy. Risks to the outlook remain to the downside,” Barclays economist Shengzu Wang said in a research note.

The preliminary HSBC/Markit Purchasing Managers’ Index (PMI) fell to 49.1 in May, below the 50-point level that separates growth in activity from a contraction on a monthly basis.

Economists polled by Reuters had forecast a reading of 49.3, slightly stronger than April’s final reading 48.9.

After a brief rebound in February, the index has now been back in negative territory for three consecutive months.

“Softer client demand, both at home and abroad, along with further job cuts indicate that the sector may find it difficult to expand, at least in the near-term, as companies tempered production plans in line with weaker demand conditions,” said Annabel Fiddes, an economist at Markit.

“On a positive note, deflationary pressures remained relatively strong, with both input and output prices continuing to decline, leaving plenty of scope for the authorities to implement further stimulus measures if required.”

The latest survey showed China’s factories continue to struggle with sluggish demand at home and abroad.

The sub-index on new export orders fell to a 23-month low of 46.8 in May, while overall new orders shrank for the third straight month, albeit at a slower pace.

The output sub-index contracted for the first time this year, to a 13-month low of 48.4, while the employment sub-index showed manufacturers shed jobs for the 19th month in a row.

The central bank is widely expected to cut interest rates further in coming months, on top of three reductions since November, and is also likely to lower banks’ reserve requirements again to reduce companies’ borrowing costs and encourage more lending.

The government is stepping up fiscal spending, with a strong focus on infrastructure projects. China has approved 250 billion yuan ($40.30 billion) of railway and subway projects so far this year, the country’s top economic planner said on Monday.

Julian Evans-Pritchard at Capital Economics said the PMI painted a mixed picture, with domestic demand possibly showing signs of stabilizing in response to earlier policy easing but still under pressure from a weak property market. Exports, meanwhile, have been hurt by the yuan’s rapid trade-weighted appreciation.

WHEN WILL STIMULUS KICK IN?

China’s economic growth slowed to a six-year-low of 7 percent in the first quarter, weighed down by the cooling property sector and softening demand, which is leaving more and more factory capacity standing idle and depressing companies’ profits.

Recent data showed a further loss of momentum heading into the second quarter; with investment growth in January-April falling to it’s lowest in nearly 15 years.

Most analysts have already penciled in sub-7 percent growth for the second quarter, raising the risk that the government will not meet its full-year growth target of around 7 percent.

State Information Centre, a top government think-tank, has predicted second-quarter growth of 6.8 percent.

But signs that the government is ratcheting up its policy support for the economy have fanned optimism that growth could bottom out in the second half, though few analysts expect a solid recovery.

“We expect economic growth to gradually stabilise as the government is determined to safeguard its growth target, but policy measures are still not strong enough,” said Xu Gao, chief economist at Everbright Securities in Beijing.

The official news agency Xinhua on Thursday quoted Premier Li Keqiang as saying he was confident China has the ability to meet the 2015 target. (Editing by Kim Coghill)

Source: various

Construction / Housing

China’s housing sales showed signs of a turnaround in April, posting year-over-year growth for the second time since December 2013, as home buyers waded back into the market following recent policy easing measures by the central government.

While sales picked up sharply, other metrics such as investment and construction starts in the all-important property sector continued to show weakness.

China’s housing sales in the first four months fell 2.2% to 1.49 trillion yuan ($240.3 billion) from the same period a year earlier, marking an improvement from the 9.2% decline in the first quarter, according to the National Bureau of Statistics Wednesday.

In April alone, housing sales rose 16.0% from a year earlier to 485.4 billion yuan, according to calculations by The Wall Street Journal based on the official data.

“The market is turning the corner,” said Frank Chen, an executive director of property consultancy CBRE.

Policy makers have been worried that a prolonged property downturn would make things worse for the Chinese economy, which grew at its slowest pace in six years in the first quarter and will likely post its worst full-year performance in more than two decades.

On Sunday, the central bank cut benchmark interest rates for the third time in six months, a move that could help the emerging signs of improvement in housing demand. With the latest interest rate cut, the effective mortgage rate on loans of more than five years has dropped to 5.37% from 5.61%.

Down payment requirements have already been eased for second home purchases and local governments have been rolling back some of their restrictions on home purchases.

Policy makers are hoping such moves will convince people to buy a home.

Alex Huang, a production engineer in Shanghai, is one such potential buyer who just might be convinced to take the plunge.

“I’m looking for an apartment near my office in Minhang district, and I’m more confident in buying a place in Shanghai rather than in my hometown, where prices are still falling,” said the 28-year-old Mr. Huang. He believes housing prices are more likely to appreciate in Shanghai than in Changsha–where he was born–a city around 680 miles west of Shanghai.

Average home prices in major Chinese cities are stabilizing, analysts said, and the sales momentum has picked up in cities such as Beijing, Shanghai and Shenzhen, where developers are still planning new projects. However, the situation in smaller Chinese cities remains weak, with plenty of unsold inventory.

“The situation is uneven. Home prices in tier one and some tier two cities are going up, but elsewhere, prices are still weak,” said Jinsong Du, a Credit Suisse analyst. He adds that while housing sales are expected to pick up in the second quarter, especially on a year-over-year basis, the forecast for the second half is less clear.

Analysts also said that they anticipate further accommodative monetary measures from Beijing given that property starts and investment in real-estate development nationwide are likely to remain sluggish for some time as developers fear overbuilding.

New construction starts for residential and commercial property in the first four months fell 17.3% from a year earlier to 358 million square meters. That compares with an 18.4% decline recorded in the first quarter.

Source: Wall Street Journal

Lumber Shipments

After two months of decline, BC softwood lumber export volume to China in the first three months of 2015 was 1.572 million cubic meters as compared to 1.415 million cubic meters over the same period in 2014, an increase of 11%.  BC softwood lumber export value over this same period was $323.69 million, an increase of 28%.

10000 buddahs


March 2015 Japan Mission with BCWood and FPinnovations

DSCN1156

Oldest Wooden Building in Japan Sapporo 1867

Mission Objectives and Results

    1. Work with BCWood and promote Canada Wood and profile AFPA member companies at the Nikkei Architectural & Construction Materials Show March 3 to 6. About 100 persons visited the booth.
  • Share booth space with FPInnovations.
  • Continue business contact building by visiting key companies and associations in Sapporo. Carried out 4 site visits. No outstanding follow-up issues.
  • Assess state of building technology.
  • Meet with trade embassy staff in Sapporo and Canada Wood on behalf of ESRD to discuss plans for the 35th anniversary celebrations of the twinning of Alberta and Hokkaido Prefecture. Possible outcomes from the meetings was a possible wood seminar in Sapporo.
  • Continue to discuss and plan next year’s North Asia activities in light of grant funding decreases and GOA fiscal restraint measures. Activities will be curtailed as result of reduced or possibly no funding. One trip to japan to attend the Japan Home Show in November is proposed.

Recommendations

  1. Continue work with FPInnovations to improve Alberta wood product shipment information for Japan and the rest of Northern Asia.
  2. Attend the Japan Home Show and continue investigating the market opportunities in japan.
  3. Support Alberta Agriculture and Forestry and the upcoming Japan Home Show and at a proposed seminar in Sapporo during Alberta/Hokkaido 35th Friendship Anniversary event November 25 to 27.
  4. Work with Canada Wood and BCWood on a possible BC Alberta Minister led mission to Japan and China late November

IMG_1742

Mount Fuji at Sunset from Park Hotel

March 2-6 Nikkei Architectural Forum and Show. Alberta Night Reception

Dates

March 3-6,2015

Venue

Tokyo Big Sight, East Hall (3-10-1 Ariake,Koto-ku,Tokyo)

Range of Exhibits

<General Construction Materials and Related Products Zone>

  1. Interior / Exterior decorative materials Plywood and Fiber boards, Decorated plywood, Wall and Ceiling covering, Tiles / Stone, Bricks, Metallic and Ceramic siding, Curtain walls, Glass, Interior finishes, etc.
  2. Flooring Tiles, Flooring, Barrier-free and OA flooring, Deck plates, Floor heating, Coated flooring, Flooring materials, Tatami mats, etc.
  3. Roofing / Ceilings Metallic and Slate roofing, Roofing tiles, Rain chutes, Crest tables, Roofing materials, etc.
  4. Doors and Opening parts Doors, Automatic doors, Window sash, Shutters, Partitions, Stairs, Handrails, Grilles, etc.
  5. Supplementary materials Films, Paints, Coating materials, Adhesive / Sealant, Gaskets, Repairing materials, Architectural hardware, Screws, etc.
  6. Construction materials and Functional materials Foundation/Structure support materials, Fire prevention and proofing, Acoustic absorbent / Noise reduction, Thermal insulation, Water proofing / Moisture-proof materials
  7. Other materials
  8. Interior Carpets, Flooring, Curtains / Blinds, Wall covering, Furniture, Other interior materials
  9. Landscape/Exterior Canvas related (Canvas,Tents,Sheets,Awnings,Screens,etc.)Pavement (Pavement materials, Drainage / Grilles for roadside trees, Road marking materials, etc.), Lighting / Signs, Shelters (Gates / Walls / Fences, Outdoor shelters, etc.), Furniture (Outdoor furniture, Decorative hardware, Toilets, Bollards, etc.), Public art (Monuments, Art objects, Wall paintings, Relief, etc.), Greenery systems, Landscaping materials / Play ground equipment and other exterior materials
  10. Software CAD / CG, Software for cost estimation and management, Databases, etc.
  11. Design / Construction related Drawing products, Measurement machines, Tools, Construction techniques, Home repair / improvement systems, Prefabricated structures, Construction related goods and service, etc.
  12. Facility equipment Air conditioning / Ventilation equipment, Water heaters, Solar heating, Kitchen Appliances, Bathroom / Bath accessories, Plumbing equipment, Elevators, Lighting, Disaster prevention equipment, Mailboxes, Home automation devices, Parking facilities, etc.
  13. Energy Saving, Energy Creation and Energy Storage Materials / Facilities Heat insulating, heat shielding, well shielded material / paints, Natural ventilation system, Roof & Wall greening, Natural lighting system, Cool & Heat storage materials, Energy management system, Solar power, Fuel battery / Rechargeable battery, Others
  14. Information / Publishing / Consulting / Franchise recruitment
  15. Others

< House Remodeling Zone > Various building materials, equipment and software for remodeling of a detached or a multiple dwelling house, Maintenance and inspection services, Relevant information and publications, Consulting, Looking for sales agents or franchisees, etc.

< Quake Resistant, Vibration Control and Base isolation Zone > Quake resistant materials and Reinforce member, Vibration Control and Base isolation system and method, Earthquake countermeasure facilities and service, etc.

< Photocatalytic Products Zone > Various architecture-related products using photocatalytic technology

< Domestic Lumber Zone > Various architectural materials using domestic lumber, Kitchen, Bathro

The Nikkei Messe is one of Asia’s largest events with the emphasis on energy efficient, ecological friendly technologies to achieve environmentally friendly urban design and construction. There were about 1200 exhibitors. Show participants include architects, designers and builders as well as representatives of international and local Japanese governments.

DSCN0731DSCN0833

AFPA Booth and Big Site Evening Light Show

Excerpt from Dalibor Houdek’s  FPInnovations Report

In the zone of living with wood, there was number of wood flooring manufacturers and wood accents such as fighting shades made of wood, wooden furniture. There was also couple of manufacturers showing light weight panels (corrugated wood) for manufacture of furniture and interior applications.

On the Building with Wood applications zone, not surprisingly, the majority of the exhibitors were showcasing structural systems that reinforce the wood construction in case of an earthquake of offered competitive steel solutions for shear walls. The focus appeared to be on how to ensure performance of the shear walls for repeated earthquake occurrences. This seems very important as places like Japan have very seismically active environment and it is important for the buildings to maintain their structural performance and integrity in repeated earthquake events without major structural repairs following the earthquake. Japan has developed many systems that support wood structures as well and other building systems to perform well in earthquake situations.

DSCN0830

Japan Home Show Posted by Jim Ivanoff BCWood japan

This year’s show was held from March 3 through 6 and we once again had a strong group of members and Canada Wood partners in the BC Wood organized Canadian pavilion. The products showcased ranged from structural lumber and engineered wood to finishing materials, furniture, and log home packages. We maintained our WRC inspired central reception display, which featured traditional Japanese wood connection, art created by the famous Japanese designer Hiroyuki Takamura. This space always draws in show visitors both with its visual as well as aromatic appeal.

The power of the Nikkei Newspaper brand and organization always ensures that this will be a well-attended show. This year saw a 2% increase in visitors for a total of 210,610 over the four days. It is important to note that this show is for industry professionals only so the attendance is not inflated by consumers. The show is very popular with architects and designers and in particular those involved with commercial and retail space design. We were not only happy to see the increase in attendance, but also the improvement in the mood of the attendees. At last year’s show, the impending tax increase was on everyone’s minds, but this year people were looking forward to renewed growth as the immediate effects of the tax increase have receded.

For the 2014 GBM, we worked very closely with Japan’s CLT Association to put on the Wood First tour. Based on the success of that collaboration, we once again partnered with them to put on a CLT seminar at the Canadian Embassy in Tokyo on the first night of the Nikkei Show.

The speakers included a Japanese engineer who explained to the audience the buildings we had visited on the GBM 2014 tour as well as Colin Chornohus of Structurlam Products who talked about the newly built Wood Innovation and Design Centre in Prince George. Colin’s presentation was highly anticipated by the audience of 170 architects, engineers, general contractors, and importers. While we and our Canadian partners were extremely pleased with this very large turnout of key influencers in the Japanese large-scale wood building market, the Japan CLT Association was ecstatic with this tremendous profile that we were able to give to the emerging CLT market. It is clear that due to seismic and fire concerns, CLT is the future of large-scale wood buildings in Japan and through such collaborative efforts BC Wood is helping to move this forward.Dan Wilkinson, on behalf of Alberta ESRD and the AFPA, led off the seminar with an overview of Alberta’s forest industry and products

.DSCN0790

March 3 2-5 pm Meeting Alberta Trade Office

Prior to the Canadian seminar met with Alberta Trade Office Managing Director Mr. David Anderson, Kaori Umemoto, Commercial Officer, Shinichi Tsujioi Trade Commissioner. We discussed the general situation in Japan and its relation to Canada and Alberta in term of trade focusing predominantly on wood products and building systems. 2015 is also a year that marks 35 years of Hokkaido – Alberta cooperation as sister provinces. There is a series of events under consideration including activities related to forest industry and building products. Hokkaido has a large wood industry and wood building culture with 30% of buildings in Hokkaido made of wood (Japan’s average is 10%).

The tentative timing for the Alberta Hokkaido event is November 25-27, 2015 following Japan Home Show on November 16-20. Executing an event will require resources and with New Elections in Alberta and the shrinking budget, further planning will need to be done once there is more financial certainty in 2015/2016 fiscal year. Further discussions with ESRD are required as they were not able to travel to japan this trip.

Potential seminar topics include: 1)How to make wood buildings last? (Japan’s wood construction typically only lasts about 25 years).2)Energy efficiency of wood buildings (hi interest to Japan the first Net Zero home in Japan was built in 2010). 3)Tall buildings out of wood (Japan has a dense population so taller multifamily buildings are of interest).

At subsequent discussions held in Hokkaido with 2×4 builders association, there was interest in exchanging information on forestry and forest management practices. Hokkaido is one of the major commercial natural timber areas in Japan.

Site Visit Shingu Shoko http://www.shingu-shoko.co.jp/english/ Mr. Kazuji Abe, General Manager and Mr. Manabu Kawamura, Building Material Section Manager Provided intro about AFPA, FPI and Alberta forest industry.

DSCN1044

SSL is currently purchasing some Alberta lumber (High Prairie Forest Products (West Fraser) and Millar Western via lnterex FP). SSL visited Alberta about 7-8 years ago (met with Buchanan Lumber at the time). SSL have several divisions including Tokyo, Osaka plus wood division in Sapporo. #1 importer of hardwood in Japan (from US). Within Sapporo division the main activity is products distribution to builders and wall panel producers throughout Hokkaido (also Supply to DAITO largest rental housing builder in Japan). 70% of product volume include SPF, OSB and plywood.$80M/year business and about $30M is represents softwood plywood from Tokyo. Three months ago, SSL established its own panel plant. In addition to distributing lumber of other wood products, SSL also distributed small forestry equipment (e.g. chainsaws), wood stoves, finishes and stains.Also import thermally modified wood (pine from Europe and ash from US). The prices for thermally modified wood are lower that is they were importing naturally durable wood specie such as IPE.They also supply small volume to window sector in Japan. However, most windows are aluminum followed by vinyl with very little wood windows on the market.

Meeting with Johnson Homes (JH) Otani Shu


Hokkaido builder with production of 250-300 homes/year (SO homes 2×4 style from Canadian lumber the rest is traditional post and beam made of European glulam made to Japanese specs). Johnson Homes is a subsidiary of housing Yamachi. Yamachi procures and distributes wood products to the Johnson Home factories.

JH operates a panel plant in Hokkaido and belongs to a group (partner in Hiroshima KIPRO) that produces total of 600 homes.

Used to import windows from Edmonton but now they buy them in Winnipeg.

Also purchase vinyl window extrusions from Quebec and some fibreglass windows.

JH is always on a lookout for contemporary building products that enhance appearance.

Also interested in fire resistant siding. Used cement board Certiguarded Cedar (cedar with fire retardant).

JH buys ISOVER insulation from Toronto and they also use spray foam polyurethane insulation.

The company focus is single family residential construction but they also have interest in daycare centres, lifestyle buildings and senior wellness.

Based on the feedback from JH’s 30 franchisees they expect the 2×4 market to remain flat.

Housing Yamachi Co. Lt.

Company Profile

Sector: Materials

Industry: Construction Materials

Sub-Industry: Wood Building Materials

Housing Yamachi Co,Ltd. was founded in 1996. The Company’s line of business includes distributing lumber, plywood, and millwork.

Currently the Japanese lumber market is sluggish however the housing market for 2015 shows signs of improvement compared to 2014.

Japans population is decreasing and aging. The population in Japan is predicted to be less than 87million by 2060 (currently it sits above 127M.)

Meeting with Showa Lumber Corp. (SLC}

Mr. Hironori Takahashi

SLC operates wall panel plant producing 5-8 2×4 homes per month plus traditional precut Post and Beam packages approximately 90-100/month.

Also make packages for commercial non-residential construction as the non-re construction market for wood is growing. However, on public buildings in Hokkaido, the builders are required to use locally grown wood (larch and Hokkaido spruce). The Hokkaido grown timber is better than the wood from other parts of Japan. The larch that is used for studs splits easily when nailed.

For HLC now the residential construction represents 20% of their production (post and beam) using European glulam in Japanese sizes.

Purchase lumber from Tolko, Weyco, West Fraser and other large suppliers and OSB from Ainsworth


 Mr. Hironori Takahashi

Housing packages pre-cut and packaged to deliver to house site. Use CNC technology for post and beam assemblies.

 Meeting with lwakura Corporation (IC)

Mr. Kunihiko Takenaka, General Manager ,Mitsuo Hasui Executive Director

IC operates a panel plant produces about 300 units with 34 employees in the panel plant, consuming 10,000 m3/year. They purchase 95% of their OSB from Ainsworth. The plant runs at capacity from April to December but the first quarter of the year it only runs at 50% capacity (single shift). At one point used to run two shifts producing 450 units but the market slowed down for single family homes.

Aside from their panel plant, they build and manage a number of commercial properties, they produce MDF board for resale, produce and provide a large assortment of interior finishing and building accessories.

They have side businesses in landscaping, wood pellet production and log and timber import and distribution.

Like many companies they maintain a woodlands department and harvest and reforest company forests in the region.

Now are building 23 apartments which they manage as rentals.

Over last year, 32,000 units were built in Hokkaido Prefecture but IC sees that the market for 2×4 construction is shrinking.

2×4 type home has to be built to a standard that requires defined performance however for traditional post and beam structure does not have meet any particular standard.

Japanese government put lots of effort into CLT development using local wood but it is very expensive about 6 times the conventional structural system.

The concern for the wood construction sector going forward is that when Chinese markets picks up the price of J-Grade will go up considerably.

Some government incentives are linked to use of domestic wood and that excludes wood importers to participate in these projects.

 Snowmeggedon (on site visits around Sapporo. Stranded as flights cancelled for a full day)

IMG_2152

The Canada Wood Group

Japan Economy, Housing & Lumber Shipments

By Shawn Lawlor

Director, Canada Wood Japan

June 5, 2015

Posted in: Japan, Market News

Japan’s Economy Posting Moderate Recovery & Household Savings Top Record

Exceeding analyst expectations, the Japanese economy registered an annualized growth rate of 2.4% between January and March 2015. The positive news pushed the Nikkei 225 Index to its highest level since April of 2000. The increase marks the second straight quarter of growth. The turnaround in the Japanese equity market since Prime Minister Shinzo Abe came to power has dramatically helped increase average household wealth. The average household savings for a family unit of 2 or more people increased to a high of 17.98 million yen or the approximate of CAD $180,000.

Japan Housing Starts Summary 

March 2015

For the first time in 13 months, total Japanese housing starts registered into positive territory. Total housing starts edged up 0.7% to finish at 69,887 units. Total wooden starts increased 3.7% to 38,252 units.

By construction method post and beam starts finished 4.1% higher at 28,239 units, wooden pre-fabricated housing declined 6.6% to 1,077 units and platform frame starts posted a 3.8% gain to end at 8,936 units. Within 2×4 starts owner occupied units increased 5.6% to 2,386 units, built for sale spec homes increased 10% to 1,155 units and rentals increased 1.9% to 5,390 units.

B.C. Softwood Exports to Japan

March B.C. softwood exports Japan totaled 202,712m3 compared to year prior results of 71,600m3. (Note the March 2014 results were impacted by the Vancouver truckers strike) Year to date through until the end of March, BC Softwood exports totaled 508,651m3 for a value of $178.6 million compared to shipments of 418,523m3 and a value of $148 million in Q1 2014. Year to date SPF shipments totaled 339,346m3 for $101.4 million compared to 246,332m3 and a value of $70 million in 2014.

Japan 2X4 Housing Association http://www.2x4assoc.or.jp/english/ visit hyperlink for further information on the association