
North American Housing Clippings First Quarter 2016

Alberta real estate developers turn from office space to rental housing
TAMSIN McMAHON – REAL ESTATE REPORTER
The Globe and Mail
Published Sunday, Jan. 03, 2016 4:27PM EST

Plunging oil prices have dealt a devastating blow to Calgary’s developers as energy companies hemorrhage office space. But where others see pain, Riaz Mamdani sees opportunity.
The head of Strategic Group, a real estate company that has focused mainly on buying and building office space in the Calgary area, is setting his sights on a new market: rental housing.
Mr. Mamdani has five apartment buildings under construction in the region. By June, he hopes to boost that number to nine. Over the next three years he hopes rental housing will grow to make up half his Alberta real estate portfolio, up from about a fifth today.
The shift is a result of what’s been happening in Alberta’s energy sector. Oil prices have continued to slide, killing demand for new office space and making rental housing – a more stable, if less profitable venture – that much more attractive.
“We see an opportunity that we couldn’t have otherwise been pursuing but for the fact that the more lucrative opportunity, which has always been office buildings in our portfolio, doesn’t make sense today,” he says.
Mr. Mamdani is not alone in that assessment. Analysts got a surprise when housing starts actually rose in November across the Prairies, along with most other markets in Canada.
“This will be a record-breaking year for multifamily housing,” says Christina Butchart, Canada Mortgage and Housing Corp.’s market analyst for Edmonton.
Multifamily housing starts are on track to hit their highest levels recorded in Edmonton in 2015, while in Calgary they are expected to hit their second-highest levels since 1981. More than a third of that jump in both cities has come from a surge in rental construction.
It’s a trend that has also taken root in markets such as Quebec City, Ottawa and Winnipeg, where developers have responded to a glut of unsold condo inventory by building rentals instead.
But the high levels of rental construction in cities such as Calgary and Edmonton are all the more surprising because vacancy rates have soared there this year in the face of rising job losses. Calgary’s vacancy rate was 5.3 per cent in October, up from 1.4 per cent a year earlier.
The surge in new apartment construction is partly an echo of the past as developers proceed with projects that were conceived back when the housing market was still hot and Alberta still had among the tightest rental markets in the country.
“That planning happened three years ago when everybody thought that oil was going to $200,” says Bob Dhillon, CEO of Mainstreet Equity Corp., a rental apartment company whose portfolio is concentrated in Alberta and Saskatchewan.
Alberta’s rental market is also being sustained by an insatiable appetite among institutional investors to buy rental housing coupled with a chronic shortage of new construction.
Investment in rental housing has more than doubled in Calgary this year, real estate brokerage Avison Young said in a mid-year report. That was driven by higher prices, rather than more properties changing hands, as the price per unit investors paid for rental housing in the city hit its second-highest point in the past 25 years.
But industry players say the biggest factor driving new rental construction in the province is access to cheap financing thanks to exceptionally low interest rates. That has kept the cost of construction down and also meant that fewer landlords are forced to sell off distressed properties.
“What’s happening now is what happened in 2009 and 2010,” Sam Kolias, head of Alberta-based rental landlord Boardwalk REIT, recently told analysts. “There just weren’t sales because apartment owners have access to capital, very inexpensive capital, and they are not under any pressure to sell.”
Falling interest rates have more than made up for the increase in vacancy rates, Mr. Dhillon says. “Even if your vacancy rate goes up 3-4 points, your interest rate had dropped from 4.5 per cent to 2.5 per cent,” he says. “You’re actually ahead of the game from five years ago in terms of cash flow.”
Mr. Mamdani acknowledges a rise of little more than half a percentage point in rates could derail his plans to build more rentals. “If the indicators change and the increase might be greater than half a point, then we may have to reassess our enthusiasm for the business,” he says.
Still, he expects the same forces that have traditionally fuelled demand for rental housing in Alberta, a young and growing population and a lack of high-quality modern rental buildings, to continue driving the market next year even if oil prices stay low.
“There’s more people in Calgary and Edmonton without a place to stay,” Mr. Mamdani says. “I do expect the projects I’m building to be full when they’re built.”

Canada’s housing market could finally cool down in 2016
-
The Globe and Mail
Published Monday, Dec. 28, 2015 3:46PM EST
Analysts have been calling for Canada’s housing market to engineer a “soft landing” since the onset of the 2008 financial crisis. And for the most part, Canadian housing prices have just kept on rising.
But with the fallout from low oil prices only starting to sink into Alberta’s housing market, new mortgage rules from the federal Liberal government and the U.S. Federal Reserve raising interest rates for the first time in nearly a decade, Canada’s housing market may have finally met its Waterloo.
The most telling sign the housing market is unlikely to churn out this year’s 8.4-per-cent average national price growth again in 2016 is the change in tone from the Canadian Real Estate Association (CREA), the lobby group that represents the country’s Realtors.
In March, the association put out a forecast predicting housing prices in Alberta would suffer a short-term drop before rebounding toward the end of the year and then rising a further 2.4 per cent in 2016. Implied in that assessment was the idea that oil prices would recover and that Alberta’s energy industry was ready to ride out yet another boom and bust cycle. Toronto and Vancouver, meanwhile, were poised for moderate housing-price growth, the organization predicted.
Instead, housing prices in the Toronto and Vancouver regions have soared this year on the heels of falling interest rates, higher discretionary income from cheaper gas prices and what many believe is an influx of international money taking advantage of the falling loonie. Meanwhile, Calgary, Edmonton and other oil-exposed markets are in the midst of a full-on correction.
Prices were down in five of the 11 cities that make up the Teranet-National Bank housing-price index. The two organizations said their index has never recorded a 12-month price drop in more than five cities all at the same time in its 16-year existence, not even during the global financial crisis. That could easily become a reality next year. More importantly, prices have been sinking in markets far removed from the energy sector, including Ottawa, Halifax and Quebec City.
Given the bleak reality facing much of the Canadian housing market, CREA updated its forecast in mid-December, acknowledging that an oil price rebound was likely not in the cards and predicting housing prices would fall 1.9 per cent next year in Alberta, with four other provinces also seeing declines. Housing prices will continue rising in Toronto and Vancouver, but not at the double-digit rates seen this year. Nationally, CREA now expects housing prices to grow by just 1.4 per cent next year, far slower than what the market has seen in 2015.
Exacerbating the overall economic weakness in many parts of the country are a constellation of changes that will make it harder for borrowers in expensive markets to get access to cheap mortgages.
The federal government’s move to boost down-payment requirements was aimed mainly at cooling the region around Toronto and Vancouver, which now make up one-third of all housing sales. Likewise, plans by the Office of the Superintendent of Financial Institutions to require lenders to shoulder more of the financial risks of government-backed mortgages are also targeted at the frothiest local markets.
At the same time, the U.S. Fed rate hike could push up rates on five-year fixed mortgages in Canada, which are more closely tied to bond yields than they are to the Bank of Canada’s overnight rate. Taken together, the changes all point to a less frothy housing market in 2016.
Granted, there is plenty of reason to be cautious about calling for a national housing market correction next year.
The Liberals’ changes to the down-payment rules are less drastic than the sweeping restrictions to mortgage financing the previous Conservative government implemented between 2008 and 2012. The market bounced back from those far more draconian changes in four to six quarters, according to an analysis from Toronto-Dominion Bank.
TD predicts the Fed rate hike will boost Canadian fixed-mortgage rates by only about 0.35 percentage points. That’s a significant shift from the falling rates that mortgage borrowers have been used to, but one that will translate into a relatively small increase in monthly mortgage payments.
In raising interest rates for the first time in more than a decade, the Fed also signalled that it expects rates to rise very gradually, not reaching a “normalized” rate of 3.5 per cent until the end of 2018. Bank of Canada Governor Stephen Poloz has also made clear he has little desire to follow the lead of the U.S. in raising interest rates any time soon. That means Canadian borrowers can be fairly confident that low interest rates are here to stay for some time yet.
Finally, the sinking loonie will make Canadian properties more attractive to both foreign buyers and Canadians looking to cash out of U.S. properties that they scooped up at a bargain after the 2008 financial crisis.
So, perhaps those who have spent years calling for a soft landing will have to wait a little while longer.
ADAM CHAMBERS

As Canadian real estate hollows out, our policies speak at cross-purposes
ADAM CHAMBERS
Contributed to The Globe and Mail
Published Saturday, Dec. 19, 2015 5:00AM EST
Adam Chambers was a director of policy to former finance minister Jim Flaherty and holds a JD/MBA from the University of Western Ontario.
Last week was a bit bizarre. On Tuesday, the Bank of Canada indicated that it could manoeuvre to negative interest rates if economic conditions warrant. On Friday, the Department of Finance, the Canada Mortgage and Housing Corp. (CMHC) and the Office of the Superintendent of Financial Institutions (OSFI) co-ordinated on measures aimed at cooling the housing market. These measures will increase the minimum down payment for new insured mortgages over $500,000 to 10 per cent from 5 per cent, and future changes will be made to the amount of capital that banks must hold against residential mortgages.
Within days, we signalled to the world that we could make debt even cheaper while simultaneously indicating we are concerned about an overheating housing market.
There is no doubt that cheap money has enabled the meteoric rise of housing prices in certain markets, primarily Vancouver and Toronto. We learned recently that the household-debt-to-income ratio is nearing historic heights of almost 164 per cent and that the number of households whose debt exceeds 350 per cent of income now stands at 8 per cent, double the level from before the financial crisis. It’s clear that Canadians are addicted to debt.
While the new down payment rules are a welcome policy response, their effects are likely to be restricted to the margins, and they aren’t without risks or unintended consequences. The rules apply across Canada, so cities such as Calgary, with traditionally lower minimum down payments and already showing signs of weakness, will have to absorb the changes.
Policy makers also ought to be concerned about a growing number of homeowners who are seeking out non-traditional loans to cover down payment shortfalls. This increases risks to financial stability as many shadow lenders are under-regulated and there is less credible data tracking their activities.
While the co-ordination among Finance, CMHC and OSFI was encouraging, one has to wonder where the Bank of Canada fits into the conversation. Admittedly, Governor Stephen Poloz was clear that there was no imminent plan to use negative interest rates – but it was important to establish what was in the BoC “tool kit.” However, from a macro perspective, we must recognize that the prospect of negative interest rates appears, on its face, at cross-purposes with concerns about the housing market.
In addition to slumping oil prices, the Canadian dollar saw more downward pressure as the BoC revelations painted a picture of stark divergence of monetary policy between Canada and the United States. Yes, a lower loonie will help boost non-energy experts, but it also affects capital inflows from foreign jurisdictions.
With every penny the loonie sheds, Canadian assets become more appealing to foreign speculators. Since 2013, those assets (including real estate) have become about 28 and 26 per cent cheaper for American and Chinese investors, respectively.
Recall the flurry of activity regarding the “hollowing out” of Corporate Canada, circa 2006. To believe the fear mongers at the time, foreign investors were pillaging our corporate icons – taking them over, moving their headquarters and well-paying jobs out of the country. Studies were conducted and conferences convened to discuss what was portrayed as a pivotal moment for Corporate Canada.
Where are those voices now? Where are the conferences about the hollowing out of Canadian real estate? The short answer: Unlike most other countries, we don’t have the data to support any theory. All we’ve got is anecdotal evidence of half-empty condo buildings or million-dollar homes in Vancouver that show little signs of life.
In fairness, the CMHC and its new leadership deserve some credit. After releasing unconvincing data on foreign ownership a year ago, it now says it is working with partners to fill in the data gaps. However, the pace and stubbornness with which CMHC has traditionally moved leaves one wondering if we’ll finally figure it out just as the pain sets in.
If we’re serious about cooling the housing market, we cannot ignore the risks of an increasing debt burden or the potential role of foreign speculation in our real property market. Any discussion of options without credible data would be unwise. With a larger number of aging adults relying on the sale of a home to finance their retirement, the risks of willful blindness are too great.
Policy makers are not in an enviable position, but with a new government and potential unchartered waters ahead, it’s even more important that they appear co-ordinated. We could be in for a bumpy ride.

Big mortgages, static incomes fuel BoC’s housing crash fears
BARRIE McKENNA and Tamsin Mcmahon
OTTAWA and TORONTO — The Globe and Mail
Published Tuesday, Dec. 15, 2015 11:04AM EST
Last updated Wednesday, Dec. 16, 2015 5:01AM EST
The Bank of Canada’s angst about a possible housing crash is now focused on a swelling bulge of younger homeowners with large mortgage debts and stagnant incomes.
There are roughly 720,000 Canadian households with debts equal to more than 3 1/2 times what they earn every year, the central bank said Tuesday in its semi-annual overview of the financial system.
Bank of Canada releases financial system review (BNN Video)
The share of such indebted households with debts totalling more than 350 per cent of their annual income held has doubled to 8 per cent from 4 per cent since before the 2008-09 financial crisis.
And 40 per cent of all household debt in Canada is now in the hands of households with a debt ratio of more than 250 per cent, up from 28 per cent before 2008. Twenty-one per cent, or a total of $400-billion in debt, is held by Canadians with debt ratios of more than 350 per cent.
The bank said these highly indebted borrowers are at the greatest risk of defaulting on their loans because they tend to be younger, earn less money and live in the provinces where house prices have climbed the most in recent years: Ontario, British Columbia and Alberta.
“There are pockets where the [housing] vulnerabilities are dominant,” Bank of Canada Governor Stephen Poloz told reporters.
The central bank said the overall risk to Canada’s financial system remains unchanged from six months ago, in spite of growing vulnerabilities that include rising indebtedness and the prolonged slump in the price of oil and other commodities. Mr. Poloz is still predicting an orderly unwinding of the country’s housing market.
And yet a housing crash, triggered by a severe recession and a spike in unemployment, remains the most important risk to Canada’s financial system, according to the bank.
New data show how uneven the housing market has become across the country – booming in some spots, tumbling in others. The Canadian Real Estate Association reported Tuesday that resale housing activity had its second-best year on record with scorching hot markets in the Toronto and Vancouver areas more than offsetting a nearly 30-per-cent plunge in sales in Calgary in November.
National existing-housing sales activity is now expected to end the year up 5 per cent, to 504,000 houses, CREA said in a year-end forecast. The upward revision reflects unexpected strength in the Toronto and Vancouver regions, which now make up a third of the country’s housing sales.
Sales are on track to end the year up 21.4 per cent in British Columbia, CREA reported, mirroring an expected 21.4-per-cent drop in sales in Alberta.
The national average resale price reached $456,186, up an annualized 10.2 per cent in November, with virtually all of that growth coming from Toronto and Vancouver. Stripping out Ontario and B.C., the average national house price has fallen nearly 5 per cent over the past year, CREA said.
A crash in Toronto and Vancouver would have national consequences because they account for a third of housing wealth and roughly the same share of mortgage debt, the Bank of Canada warned.
“Recent exacerbation of housing sector imbalances has become increasingly limited to a small number of areas,” according to the bank’s financial system review. “A rapid correction in one or both of these markets would have a large direct effect on the Canadian economy and the financial sector.”
Rising housing prices have exacerbated the country’s household debt imbalance. The share of households with debts topping 350 per cent of their incomes – the bank’s threshold for “highly indebted” – reached 13.6 per cent in B.C. last year, nearly 11 per cent in Alberta and 8.5 per cent in Ontario.
The bank has previously estimated that Canadian house prices may be overvalued by anywhere from 10 per cent to 30 per cent. But that calculation was removed from this latest report. Mr. Poloz said it has “less and less relevance,” given that the problem is confined primarily to just two cities, where there is strong employment and population growth, significant foreign buying and limits on new house construction.
And he said Canada’s housing market is much healthier now than the U.S. market was before it crashed in 2006.
“There are no similarities to what we saw back then,” Mr. Poloz insisted. “That’s because we have a much stronger [mortgage] underwriting culture and because of the changes that were made along the way.”
He applauded the new Liberal government in Ottawa for taking steps to curb excessive borrowing. “Recent changes by Canadian authorities will help to mitigate the risks as we move into 2016.”
On Friday, the government unveiled what Finance Minister Bill Morneau has called “targeted” measures to address “pockets of risk” in the housing market, including a plan to increase the minimum down payment for government-insured mortgages on houses worth between $500,000 and $1-million, starting in February.
But the Canadian Real Estate Association warned the changes would reverberate far beyond Ottawa’s target markets of Toronto and Vancouver, causing what CREA economist Gregory Klump called “unintended collateral damage” to housing markets in the oil patch.
CREA said it expects housing sales to spike in the short-term before Ottawa’s new down payment rules kick in on Feb. 16, but that extended pain in the oil patch will eventually catch up to the housing market. Nationally, it predicted resale prices will increase just 1.4 per cent next year, while they are likely to fall another 2.5 per cent in Alberta.
The bank acknowledged that Canadians are piling on mortgage debt faster that their incomes. Statistics Canada reported Monday that household debt hit another record high in the third quarter, with debts reaching 163.7 per cent of incomes, up from 162.7 per cent in the previous quarter.
The bank also concluded that while prolonged low commodity prices would have a “significant adverse effect on certain industries and regional economies,” the overall stresses to the financial system would be “manageable.”
The report pointed out that direct loans by the Big Six banks to the oil and gas sector represent 2 per cent of total lending; loans to the mining sector account for another 1 per cent. But loans to oil-producing regions are much higher, at 13 per cent of total lending, or $320-billion.
Canada housing starts slow in December, but 2015 solid overall
Ontario, Prairies, Atlantic all way down last month, but 2015 ‘surprised to the upside’
CBC News Posted: Jan 11, 2016 11:55 AM ET Last Updated: Jan 11, 2016 11:55 AM ET

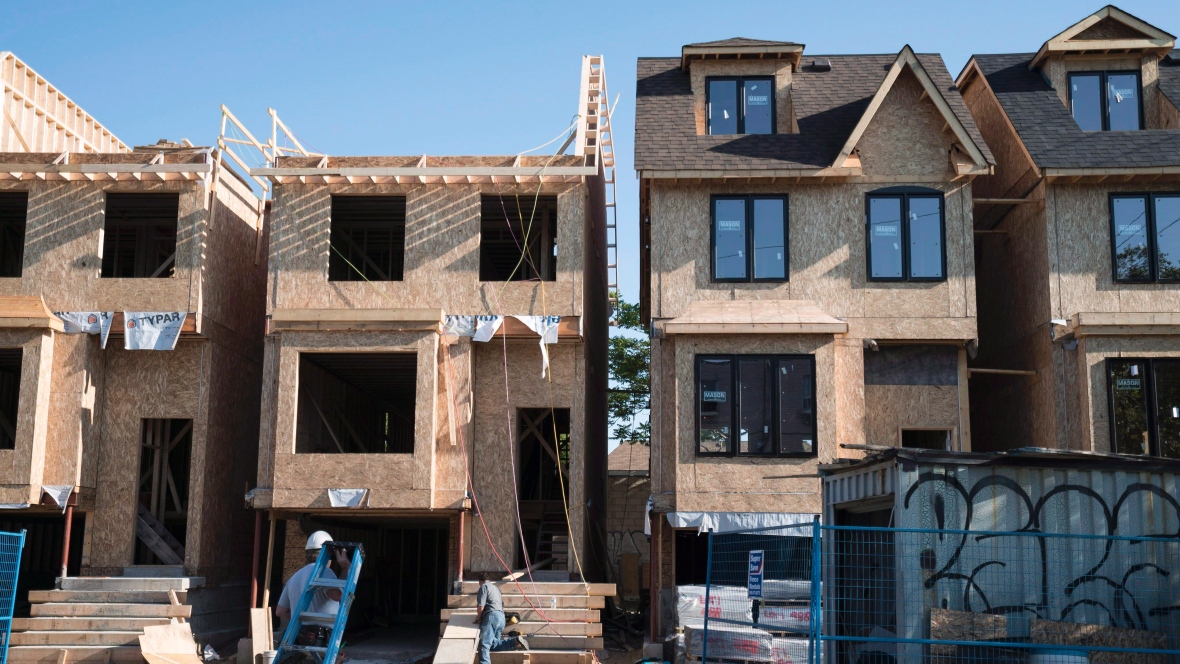
Houses are seen under construction in Toronto last summer. 2015 was a solid year for housing starts across the country, despite a soft December. (Graeme Roy/Canadian Press)
Related Stories
- Calgary rent prices drop by almost 20%, says website owner
- 5 reasons Toronto house prices won’t crash in 2016
- Vancouver, Toronto real estate markets end year on sky-high note
- Tiny housing a growing trend in Canadian real estate
The Canadian housing market showed signs of cooling in December, with housing starts coming in lower than expected despite warm weather and a solid pace throughout 2015.
The Canada Mortgage and Housing Corp. said Monday the annual pace of housing starts fell sharply to 172,965 in December compared with an upwardly revised 212,028 units in November.
That compared with the roughly 200,000 starts that had been expected in December by economists.
The slowdown came as the rate of urban starts fell 19.1 per cent in December to 159,007 units.
“Although we’re ending the year on a soft note, housing was one area that surprised to the upside in 2015, with the 194,000 average building pace up around 10,000 from the prior year,” CIBC Capital Markets economist Nick Exarhos said in a research note.
“Furthermore, because of the general acceleration in the second half of 2015, residential investment is still likely to provide a modest catalyst to growth in the next few quarters as new projects are seen through to completion.”
Volatile multi-units
The rate of Canadian housing starts fell 18 per cent in December, with big drops in Ontario (down 39 per cent), the Atlantic Provinces (35 per cent) and the Prairies (36 per cent), TD Economics economist Diana Petramala said in a note.
“Most of the weakness was concentrated in the highly volatile multi-unit segment (-27%) across major urban areas,” she said. “Single-detached urban starts remained flat at 57,743.”
The relatively stable national headline hides some tidal shifts below the surface.’– Robert Kavcic, BMO
BMO senior economic Robert Kavcic noted that a big portion of the drop came from Toronto, which he said might be a relief for policymakers because starts were running too hot earlier this year. The market’s fundamentals remained solid, he said.
Kavcic said Alberta’s big dip (39 per cent) was its biggest drop since 2008, reflecting the weak demand in the province.
“Canadian homebuilding was very modestly higher in 2015, but the relatively stable national headline hides some tidal shifts below the surface,” he said. “We suspect 2016 will continue to see weakness in the Prairies mostly offset by solid residential business conditions in markets such as Toronto and Vancouver.”
Vancouver, in fact, had its highest number of housing starts since 1993.
Winter season often soft
Scotiabank says the December numbers aren’t considered telling of a larger trend because little actually happens from December to March.
“Indeed, weak seasonally adjusted monthly housing starts numbers in the Dec.-March period in 2015, 2014, 2013, and 2011 have had little meaning or carry-over into the actual amount of housing starts in each of those years once the dust settled,” the note, signed by vice-president Derek Holt and financial markets economist Dov Zigler, said.
The Canadian housing market is being closely watched by economists for signs of slowing. Low interest rates have helped fuel demand in some markets; however, the drop in oil prices have hurt others.
The Canadian Real Estate Association has forecast average house prices in Alberta, Saskatchewan and Newfoundland and Labrador to fall this year.
However, the industry association has predicted the national average house price is expected to gain 1.4 per cent in the year.
Canada Mortgage and Housing said rural starts were estimated at a seasonally adjusted annual rate of 13,958.
The six-month moving average of housing starts was 203,502 units in December compared with 208,204 in November.

Millionaire boomers decamp Vancouver pocketing housing windfalls as city becomes a ‘commodity’
By Katia Dmitrieva, Bloomberg News, Financial Post March 4, 2016
In U.S. dollar terms, Vancouver still remains affordable to foreign buyers and in fact is a bargain compared to some other cities in the Pacific Rim.
Jonathan Baker is the first to admit he shouldn’t be complaining about foreign investors driving up prices in Vancouver’s red-hot housing market. They helped the retired lawyer pocket millions.
Baker and his wife sold their five-bedroom home for $3 million in December, a 100-fold gain from their purchase price in 1970. The house went for $300,000 over asking after an offshore investor bid up the price and was later flipped several times to other buyers. Now the home sits empty in Dunbar, the telltale sign of a buyer who lives abroad, he says.
“You can’t be too critical when you’ve benefited from it,” Baker, 78, said by phone from his 4,200-square-foot, $1.5 million seaside home in Sechelt, bought using proceeds from his Vancouver sale. “But the city has become a commodity. One group like myself has bought early, we were lucky. But we no longer knew our neighbours. It’s empty.”
Baker’s generation is cashing out as an influx of foreign demand pushes up the average detached home price in Vancouver to a heady $1.8 million. They’re taking the profit and injecting it elsewhere, exporting higher prices to retirement enclaves across the Canadian province. That’s pushing up sales and price growth in these small towns beyond even Vancouver’s torrid pace.
“All these prices are crazy — it really is crazy,” Baker said. “I can’t imagine this thing continuing.” That’s why he sold last year, fearing a rapid price drop if offshore demand dries up.
Seniors are moving from Canada’s third-biggest city at a record pace, with 2,322 people over the age of 65 leaving the city for other parts of B.C. in 2014, tying with the prior year as a record high, according to preliminary data from Statistics Canada. That’s coincided with a jump in home sales and prices where they typically settle.
The dynamic is also seen in Canada’s number one retirement hub: Qualicum Beach, the town of about 10,000 people on Vancouver Island. Half the residents are over 65, the highest proportion of any city in the country, according to Statistics Canada. Home sales in that area and nearby Parksville, the No. 2 retirement haven, almost doubled to 63 transactions in January from the year ago period, and the average price of a home is up 24 per cent to $444,856 over that time.
Baker’s home is in Sechelt, the fastest-growing retirement community in Canada according to Statistics Canada. The inflow of residents aged 65-plus increased 7 per cent in the last five years, the most of any municipality in the country, bringing that aging population to over a third of its 10,000 residents.
Bidding wars
The quiet town now faces big-city housing issues: construction, bidding wars, and never-before-seen prices and sales. Prices jumped 42 per cent to a record $510,839 in January from the prior year, according to MLS data compiled by Gary Little, a realtor who’s been selling real estate along the Sunshine Coast for a decade. Sechelt broke sales records last month, with 99 residential sales in February, the highest ever for that month and the second highest on record after 117 in June, the data show.
The Canadian Press and Reuters
Edmonton housing market could turn around in a few years
By Dave Lazzarino, Edmonton Sun
First posted: Thursday, November 19, 2015 03:51 PM MST
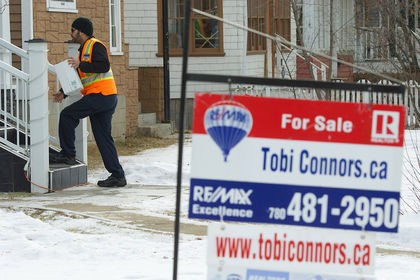
A postal worker runs through his route near a for sale sign posted at a house in the Westmount neighborhood of Edmonton, Alberta, in a file photo.
(IAN KUCERAK/EDMONTON SUN FILE)
Article
The effects of low oil prices continue to trickle to Edmonton’s housing market and that could be a good or a bad thing, depending on how you look at it.
“Right now if you’re, for instance, a home-owner and you’re looking to sell your home, you are looking at longer selling times because there is a larger selection in the marketplace,” says Christina Butchart, principal for market analysis in Edmonton for the Canadian Mortgage and Housing Corporation (CMHC).
Butchart was one of a handful of presenters at the CMHC’s housing outlook conference at the Northlands Expo Centre Thursday, an event held to give a glimpse into what real estate markets may look like in the months and years to come.
Though the slumping economy in Alberta has slowed trends like multi-family housing starts and reduced house prices, Burchart says it’s not all doom and gloom in the provincial capital.
“We’re still seeing employment growth, so we are managing in this sort of new economic environment that we’re dealing with,” she explained.
Jobs in the oil sector are being balanced to some degree by those in health care, which Edmonton has a large number of. What that means for housing depends as well on the type of house.
“I don’t think it could be more different of a story between what’s going on in new home construction with the single-family market versus what we call the multi-family market,” Butchart said.
In short, a softening of demand for single-family homes means builders haven’t built as many of them and prices haven’t fallen too much.
At the same time, though, the numbers of temporary foreign workers is declining while a huge amount of new multi-family units — including many downtown apartment buildings that have been in the works for the next couple of years — are beginning to come on the market.
Between that demand shortage and the second highest number of multi-family housing starts ever, a huge inventory is expected to bring multi-family starts to a halt in the next few years.
Overall, Butchart said Edmonton should expect trends to turn around in the next few years if oil prices bounce back but residents shouldn’t expect the same massive growth that has been seen in the past.
Spring sales begin to pick up as prices hold steady
Edmonton, April 4, 2016: 1,364 properties were sold in the Edmonton Census Metropolitan Area (CMA) in March, up nearly 63% from the 837 homes sold last month, but down 6.13% from the 1,453 relative to March 2015. There were 863 single family detached homes sold in the Edmonton CMA, a 67% percent increase month-over-month, and down only 1.5% from the same time last year. March saw the sale of 335 condos and 144 duplex/rowhouses, up 44% and 82% from February, respectively.
“Sales, relative to last month, were consistent with the seasonal trends that we expect,” REALTORS® Association of Edmonton Chair Steve Sedgwick explains. “Inventory is growing, with more than 3,000 properties coming onto the market last month. Despite the inventory growth, prices are holding steady, with median prices on par with last year, and average prices up slightly due to the sale of high-end luxury homes in March.”
The average all-residential price was $379,524 for March, which is close to 3% higher than February, and up nearly 2% compared to $372,289 during the same in last year. Single family house prices averaged $439,815, up slightly over last year (up 0.56%) and up by 4.73% month-over-month. Condo properties sold for an average of $251,093, up from both last month and last year, at an increase of 1.62% and 0.55%, respectively. Median prices remained virtually the same as last year, as the all-residential median price took at slight dip of less than 1% to end the month at $357,750, down from $360,000 from this time last year, but up nearly 3% from February. The median price for single family homes was up over 1% from last month ending March at $405,000, but down just over one percent from $410,000 in March of 2015.
“When looking at housing prices, we have to take into account a number of factors,” Sedgwick said. “Last month, we saw sales of two homes in Edmonton that were priced at more than $3 million dollars. This is the first time that properties at that price point have sold in 2016, and those two sales affected the average price by several thousands of dollars. So it is important that we also look at the median prices as well, to gain a clear picture of the market.”
March’s average days-on-market dropped in almost all housing types, as it took an average of 53 days to sell a home compared to 57 last month. On average, single family homes sold 4 days quicker than last month, selling in 49 days. Duplex/rowhouses were on the market for an average of 62 days compared to 71 in February. And, on average, condos sold in 58 days, up 1 day from the same time last month.
-30-
| March 2016 | M/M % Change | Y/Y % Change | |
| SFD2 average3 selling price – month | $439,815 | 4.73% | 0.56% |
| SFD median4 selling price – month | $405,000 | 1.25% | -1.22% |
| Condominium average selling price | $251,093 | 1.62% | 0.55% |
| Condominium median selling price | $233,500 | 4.24% | 0.86% |
| All-residential5 average selling price | $379,524 | 4.48% | 1.94% |
| All-residential median selling price | $357,750 | 2.95% | -0.63% |
| # residential listings this month | 3,082 | 11.46% | -2.22% |
| # residential sales this month (reported) | 1,364 | 62.96% | -6.13% |
| # residential inventory at month end | 7,294 | 9.18% | 22.71% |
| # Total6 MLS® System sales this month | 1,719 | 60.80% | -7.38% |
| $ Value Total residential sales this month | $581 million | 70.21% | -6.20% |
| $ Value of total MLS® System sales – month | $650 million | 70.09% | -6.84% |
| $ Value of total MLS® System sales – YTD | $1.4 billion | 99.92% | -11.33% |
1 Census Metropolitan Area (Edmonton and surrounding municipalities)
2 Single Family Dwelling
3 The total value of sales in a category divided by the number of properties sold
4 The middle figure in a list of all sales prices
5 Residential includes SFD, condos and duplex/row houses.
6 Includes residential, rural and commercial sales
Edmonton’s housing market at a glance:
* Total housing starts expected
– by the end of 2015 – 16,400
– 2016 – 11,100
– 2017 – 10,800
* Multi-family housing starts
– 2015 – 10,500
– 2016 – 5,600
– 2017 – 5,000
* Predicted total number of MLS sales
– 2015 – 17,500
– 2016 – 17,800
– 2017 – 18,300
* Predicted average resale price for homes
– 2015 – $363,000
– 2016 – $366,000
– 2017 – $374,000
* Predicted average monthly rent for a two-bedroom apartment
– 2015 – $1,265
– 2016 – $1,295
– 2017 – $1,320
david.lazzarino@sunmedia.ca @SUNDaveLazz

Calgary home sales decline the biggest in the country
Mario Toneguzzi, Calgary Herald More from Mario Toneguzzi, Calgary Herald
Published on: November 16, 2015 | Last Updated: November 16, 2015 4:05 PM MST
Real estate listing in Calgary. Calgary Herald
Calgary’s resale housing market led the country in October — in a negative way.
MLS sales in the Calgary region were 1,810 for the month, down 36.4 per cent from a year ago. The rate of decline was the highest among Canada’s major housing markets, according to a report released Monday by the Canadian Real Estate Association.
In Alberta, sales fell 28.9 per cent to 4,327 transactions.
Across the country, however, MLS sales were up 0.1 per cent to 41,653. CREA said national activity stood near the peak recorded earlier this year and reached the second highest monthly level in almost six years. Doug Porter, chief economist with BMO Capital Markets, said there are many — mostly oil-driven — cities that have softened markedly.
“The renewed sag in oil in recent months looks to have triggered a renewed weakening in housing markets across much of Alberta and Saskatchewan. Six of the 25 major markets reported double-digit declines in sales last month, and four of those were in these two provinces,” he said.
Besides Calgary’s year-over-year decline, sales from a year ago also fell in Edmonton (16.3 per cent), Saskatoon (21.4 per cent) and Regina (12.3 per cent).
Diana Petramala, economist with TD Economics, said overall Canadian home sales continued to be boosted by markets in Ontario and British Columbia.
“Markets in oil-producing provinces continue to remain incredibly weak,” she said.
Calgary saw its average MLS sale price fall by 4.4 per cent year-over-year to $444,535 in October while Alberta experienced a 3.9 per cent decline to $384,381.
However, the average sale price in Canada rose by 8.3 per cent from a year ago to $454,976.
According to CREA’s MLS Home Price Index benchmark price — which is indicative of typical properties sold in a market — Calgary experienced a 1.14 per cent annual drop to $448,400 while the national aggregate of 12 major markets was up 6.7 per cent to $505,900.
According to the Calgary Real Estate Board, month-to-date from Nov. 1-15, MLS sales in the city of Calgary are down 28.16 per cent from the same period a year ago. The median price has dropped by 3.44 per cent and the average sale price is down 2.16 per cent.
mtoneguzzi@calgaryherald.com

The trend measure of housing starts in Canada was 203,502 units in December compared to 208,204 in November, according to Canada Mortgage and Housing Corporation (CMHC). The trend is a six-month moving average of the monthly seasonally adjusted annual rates (SAAR) of housing starts.
“A decrease in both the multiple and single starts segments drove the December trend lower,” said Bob Dugan, CMHC Chief Economist. “Starts increased in 2015 compared to 2014, largely driven by the condominium market in Toronto. Had the Toronto condominium starts remained stable in 2015, national starts would have declined on a year-over-year basis.”
The standalone monthly SAAR was 172,965 units in December, down from 212,028 units in November. The SAAR of urban starts decreased by 19.1 per cent in December to 159,007 units. Multiple urban starts decreased by 27.0 per cent to 101,264 units in December and the single-detached urban starts held steady at 57,743 units.
In December, the seasonally adjusted annual rate of urban starts decreased in the Prairies, Ontario, and Atlantic Canada, but increased in British Columbia and Québec.
Rural starts were estimated at a seasonally adjusted annual rate of 13,958 units.
April 1-14, 2016 Calgary Real Estate Market Update
Calgary home sales between April 1-14 were down -7% year-over-year. That’s not a big surprise as the pending stat we reviewed in our last update pointed towards a sales drop in the week to come.
Sales were more than -20% below the 5 & 10 year average and on the slowest April pace since 2000.

Average prices are up 2.16% and much can be attributed to the high-end market. Twenty-two homes sold for $1M+ in the first two weeks, the second highest April month-to-date level.
Low overall sales + Near record luxury sales = skewed average price.

No upcoming inventory surge as new listings remain subdued. While up 6.6% y/y, new listings remain below the 5 and 10 year average.
True, the sales-to-new-listings ratio is pointing towards balanced market conditions at 48%, but that ratio excludes how many homes were already listed, aka Active Listings or Inventory.
There are currently 6,340 homes for sale and 1640 have sold in the past 30 days. That’s an inventory absorption rate of 3.9 months: a buyer’s market.

Bank Commentary Round-up
Today, CREA released Canada’s housing market report for March. National home sales broke all previous monthly records as prices rose 9.1% year-over-year.
- TD Bank: “Ontario and British Columbia housing markets continued to drive the national narrative. Almost all of the markets currently in seller’s territory (which make up just under half of Canadian activity) are found these two provinces… Regionally, the divergence among the Canadian housing markets is expected to become even more pronounced throughout 2016” (Read full report
 )
) - BMO: “On the weak end of the spectrum, sales and prices continue to retrench in markets exposed to oil prices. Sales in Calgary fell a further 12% from a year ago and the benchmark price is down 3.7% y/y. While further declines are likely coming in 2016, keep in mind that those who purchased homes through mid-2013 are still sitting on a meaningful equity cushion” (Read full report )
- Scotiabank: “Weakening employment and income prospects and reduced migration inflows are contributing to depressed activity levels in Canada’s oil producing provinces, though average prices to date have held up relatively well…we expect conditions to soften further in Calgary alongside mounting job losses and increased housing supply.” (Read full report )
- Royal Bank: “Every delivery of statistics on Canada’s housing market in the past year has told more or less the same story—Vancouver and Toronto are hot, markets sensitive to the energy sector are cold, and most other markets are somewhere in between… high levels of inventory relative to sales in markets within Alberta and Saskatchewan resulted in further price weakness in these provinces. The rate of decline in Calgary’s MLS HPI accelerated to -3.7% in March from -3.5% in February.” (Read full report )

Vancouver housing market more unaffordable than New York and London: survey
By Gerry Marr, Financial Post January 26, 2016 6:27 AM
Only Hong Kong and Sydney are less affordable than Vancouver finds an annual survey that looks at 87 major markets around the world.
Photograph by: National Post , Files
Vancouver may have just add another notch to its reputation for being pricey.
According to U.S. group Demographia, Vancouver is the third-least affordable city in the world for a home, and construction constraints are to blame for rising home prices there and in other Canadian cities.
Wendell Cox, the principal owner at Demographia, which looked at 367 markets and nine countries for the study, says that’s a trend that can be seen in Toronto too as limits to ground-level detached housing in favour of condominium living are creating a shortage of housing as people refuse to move into high-rises.
Cox goes one step further and suggests the fertility rate will be impacted in the future in some Canadian cities. “A lot of people don’t want to raise children on the tenth floor of a condominium,” he said.
The study looked at the median cost of a home in each of the markets studied and then divided by the median income to produce a multiple. In Vancouver that $756,200 median-priced house produced a multiple of 10.8 when divided by the median household income of $69,700.
Topping the list was Hong Kong, where residents need 19 times the median income to buy the median-priced house; Sydney, Australia, was second, at 12.2 times. The second-least affordable city in Canada was Victoria, with a multiple of 6.9, followed by Toronto, at 6.7.
“It’s urban containment policy. Vancouver started very limiting development on its fringe in the early 1970s. We’ve seen this all over the world, it leads to incredible loss of affordability,” Cox said. “In Toronto, what you have is the Places to Grow program which has drawn a tough urban growth boundary, using a greenbelt around the city.”
Cox says there was no loss in housing affordability between 1971 and 2001 in Toronto, but since that time house prices have gone up 70 per cent relative to income. In the 12 years that Demographia has been doing the study, Vancouver’s multiple has jumped from 5.3 to the current 10.8.
His group’s findings back up complaints from the Toronto-based Building Industry and Land Development Association, which says the gap between low-rise and high-rise in the city is at an all-time high because of land use policies. The group’s November statistics put the average newly constructed low-rise home at $700,779, a 17 per cent increase from a year ago, while average high-rise homes rose less than one per cent during the same period to $446,981.
Cox says the entire foreign investment argument driving housing prices doesn’t mesh with his findings. “It wouldn’t matter if you just built more houses,” he said.
Benjamin Tal, deputy chief economist with CIBC World Markets, cautioned that some of the conclusions from the report don’t fit, and noted that in Vancouver the income used does not reflect the actual people buying the houses.
“If there is a bias in income in a place, it’s definitely Vancouver, where a lot of this money is coming from outside the country,” Tal said . “We are not just talking about foreign investors, we are talking about new immigrants. We might have the wife here and the husband over there. She might have income of zero and be living in a $5-million house. There’s a lot happening and that’s not foreign investment because she’s Canadian.”


Ontario’s new ‘prosperity’ vs. Alberta’s anguish: The disparity in 6 charts
The Globe and Mail
Published Tuesday, Feb. 02, 2016 5:11AM EST
Last updated Tuesday, Feb. 02, 2016 8:53AM EST
Reversal of fortune
One is expected to lead, the other to lag.
Such is Canada’s new reality in the wake of the oil shock.
Economists generally believe Ontario and British Columbia will lead economic growth among the provinces this year, while Alberta suffers a second year of recession.
In a new forecast, Laurentian Bank puts Ontario a shade above B.C., citing “a new period of sustained economic prosperity” for the central Canadian province.
And like other observers, Laurentian assistant chief economist Sébastien Lavoie and economist Dominique Lapointe project Alberta will trail the country amid the sustained collapse in oil prices.
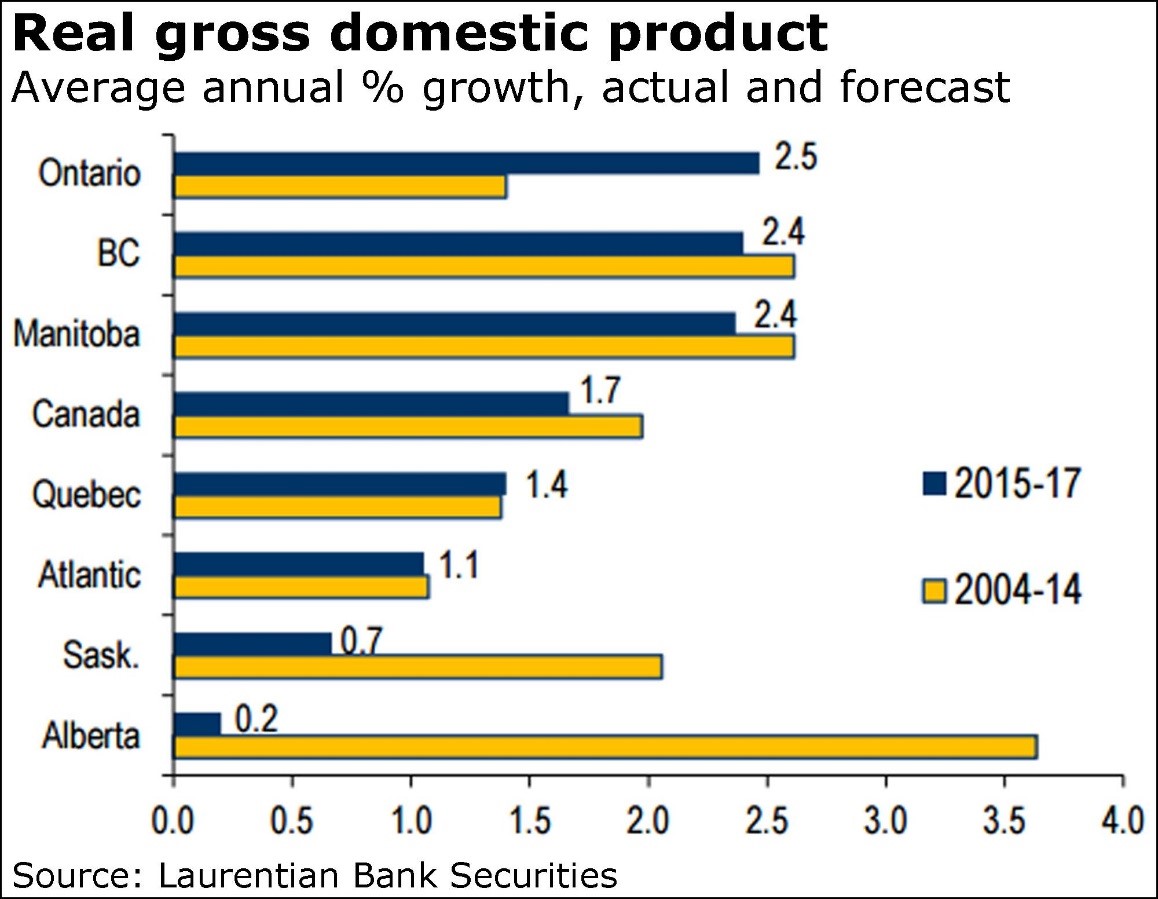
This chart says it all.
“Most major economic indicators are pointing towards a contraction, as the downsizing of the oil industry trickles down to other sectors of the economy,” said Mr. Lavoie and Mr. Lapointe.
“In summary, the economic contraction is more severe in 2015-16 than it was in 2008-09, but, for the moment, milder than in the early 1980s.”
In Ontario, on the other hand, the economy “is entering a new kind of prosperous period, thanks to the low loonie that is notably improving the competitiveness of the overlooked services export sector.”
Bank of Nova Scotia, in a new forecast released late yesterday, pegs economic growth in Ontario at 2.2 per cent this year, compared to a contraction of 1.9 per cent in Alberta.
Scotiabank believes Alberta’s jobless rate will spike even further, to 7.3 per cent, while Ontario holds steady at a still-elevated 6.8 per cent.

The Bank of Canada has already raised red flags about the borrowing habits of Albertans.
Mr. Lavoie and Mr. Lapointe flagged the recent decline in home prices as possibly leading to defaults, noting that “the share of highly vulnerable households in Alberta (those with a debt-to-income ration at 350 per cent or above) is similar to that in the U.S. in 2007.”

Of course, British Columbia is higher, and strikingly close to that 2007 mark. But, as Mr. Lapointe noted, its economy is growing.
And Ontario is nowhere near the mark.
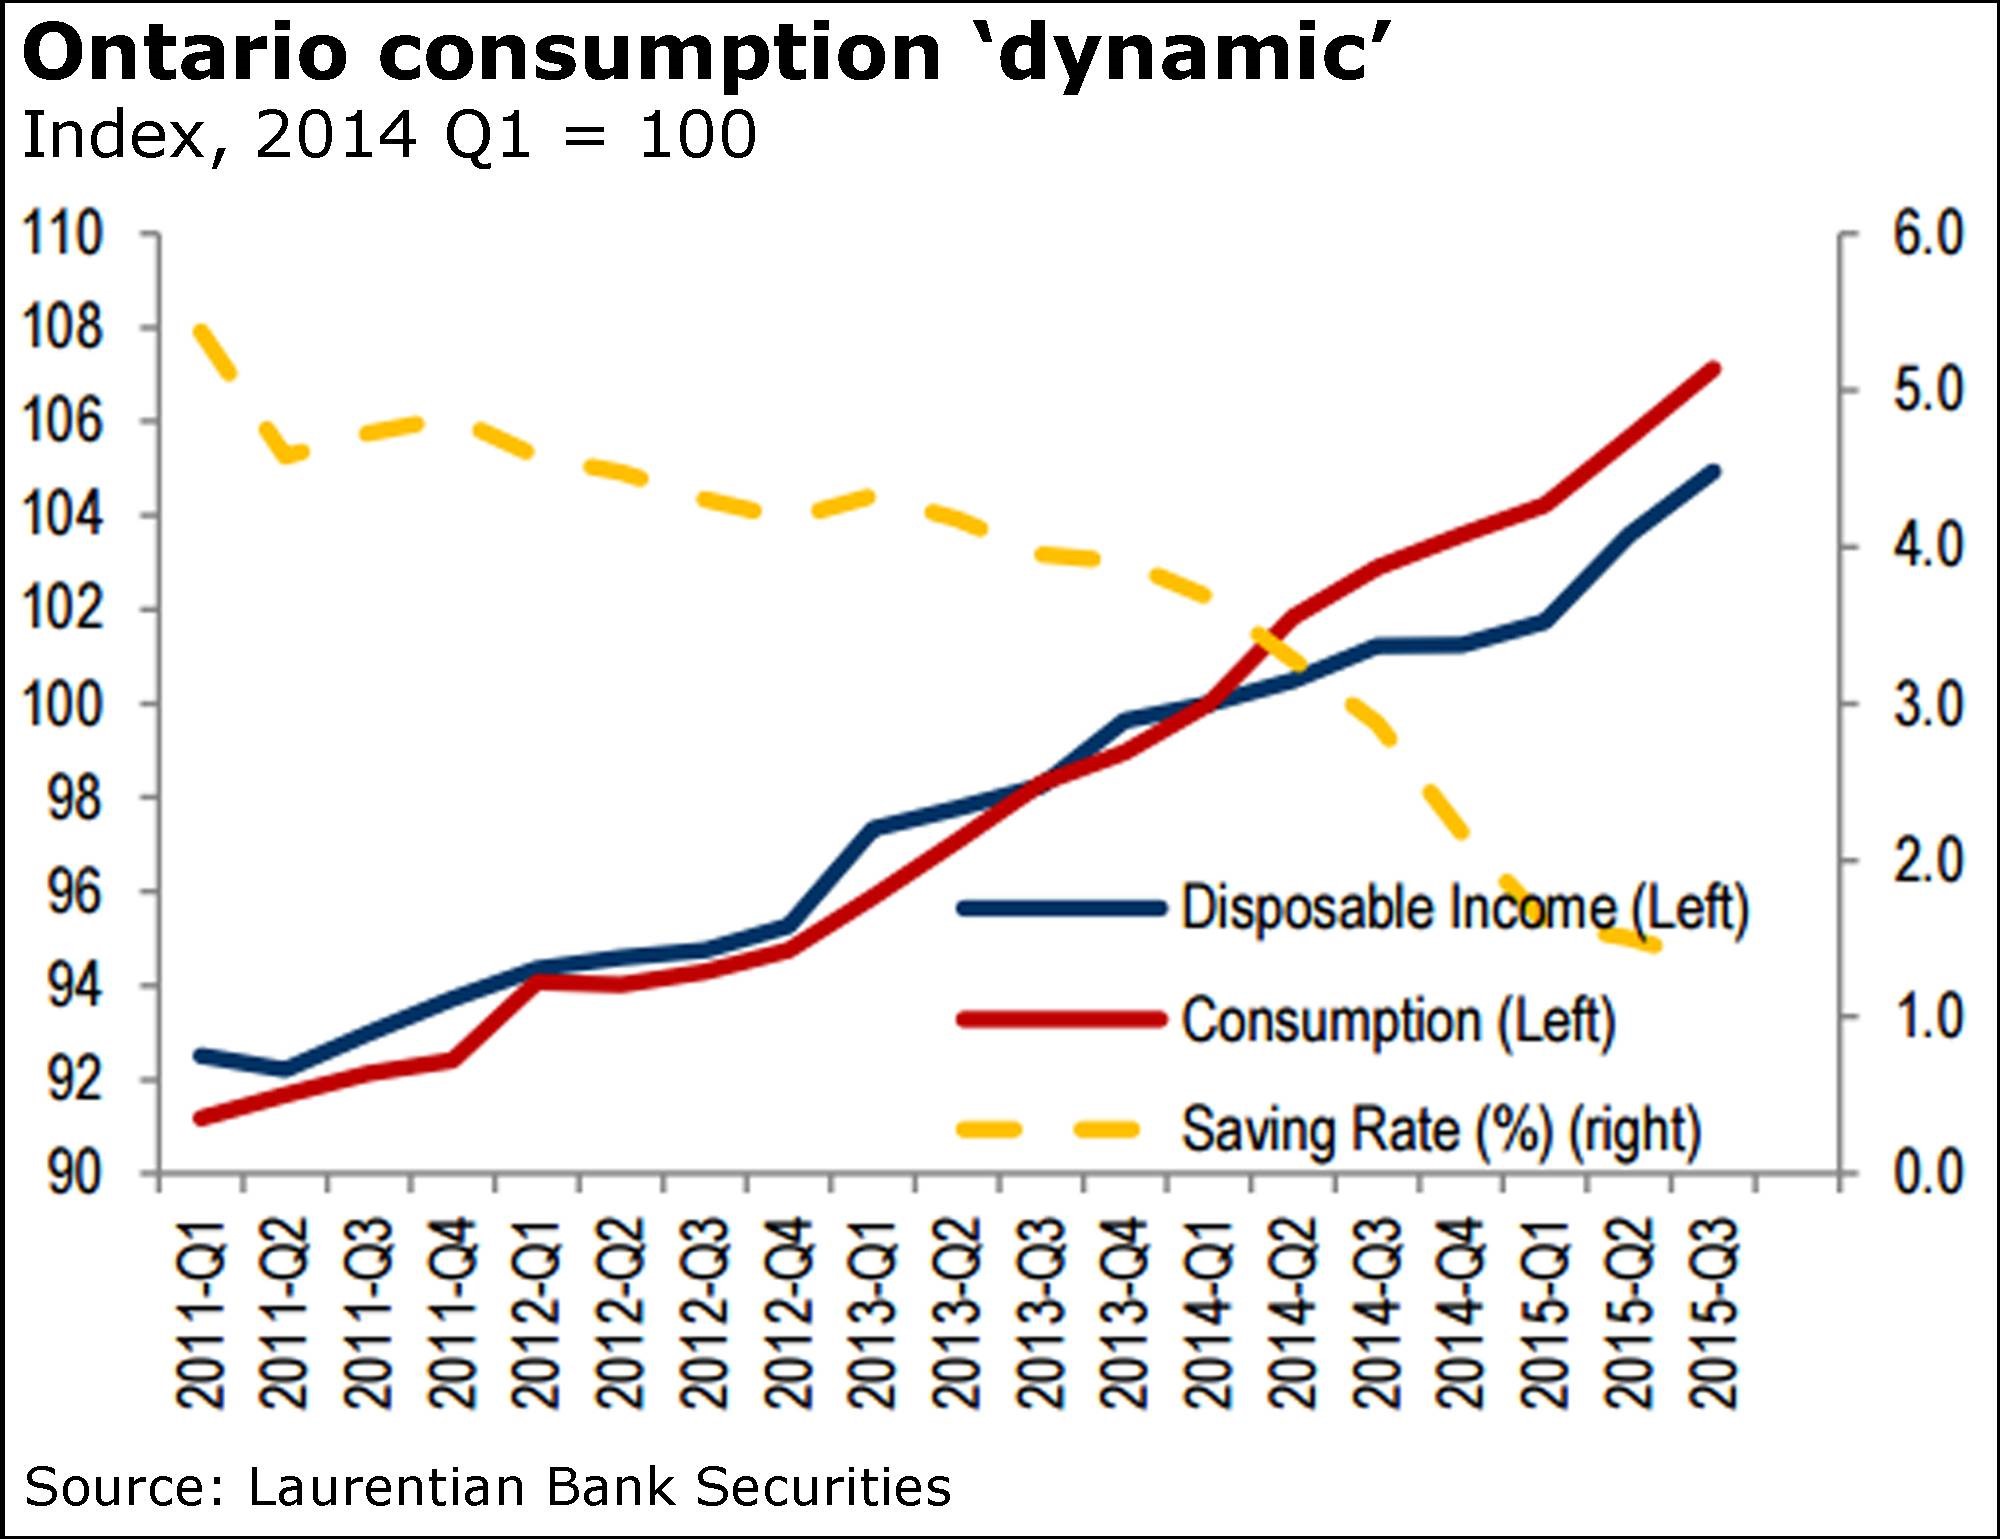
Compare that to Ontario, where families are expected to “channel a larger part of their income gains into savings rather than spending,” the Laurention economists said.
“The latter outstripped incomes to a greater extent than usual during the last two years, leading the saving rate to falter to its lowest level in nine years in 2015 (1.4 per cent).”

Calgary’s housing market has faltered along with the oil shock, while the Toronto market, like that of Vancouver, has boomed.
“We anticipate a lagged negative effect of rising unemployment on housing market conditions in 2016-17, notably mortgage arrears,” Mr. Lavoie and Mr. Lapointe said of Alberta.
“Moreover, the population growth rate, still positive, is diminishing fast as potential homebuyers and current homeowners are looking for work out of the province. In 2015, resale transactions were already 23 per cent lower than in 2014.”

Toronto, of course, like Vancouver, has oft been the source of warnings over the frothy nature of housing.
So its boom is obviously something to watch, though Laurentian appears untroubled.
“With strong full-time employment gains and an unemployment rate running below the [rest of Canada] for the first time in a decade, housing demand and homebuilding have trended higher,” the economists said.
“The growing number of completed and unabsorbed condos in the [Greater Toronto Area] and Ottawa markets should prompt a moderate decline in housing starts for the upcoming years.”

B.C. promises action on ‘shadow flipping’ by province’s realtors
Kathy Tomlinson, Wendy Stueck And Justine Hunter
VANCOUVER and VICTORIA — The Globe and Mail
Published Tuesday, Feb. 09, 2016 9:46PM EST
Last updated Wednesday, Feb. 10, 2016 6:41AM EST
Premier Christy Clark wants quick action to stem unscrupulous practices in Vancouver’s real estate market, saying the provincial government is prepared to step in if required.
Ms. Clark was responding to a Globe and Mail investigation that found some real estate agents are making windfall profits through a practice known as contract assignment – essentially, arranging a sale and then finding a new buyer willing to pay more for a given property before the deal closes.
“So what we’ve said to the [Real Estate Council of B.C.] is, ‘we’re going to give you some time to try to solve this,’ because that’s their job – they are a self-regulating profession, to go out there and make sure their members are observing the rules,” Ms. Clark told reporters in Victoria after Tuesday’s Throne Speech.
“If they don’t fix it, we’re going to fix it for them. And we’ll do it in short order because what is happening in the housing market in the Lower Mainland, and in a lot of communities, it’s crazy. And that is fuelling part of the problem.”
The Premier added: “I don’t have a lot of patience on this one.”
Contract assignment is legal, but controversial. However, it can become contentious when real estate agents flip properties without disclosing they have a stake in the outcome. With house prices soaring out of reach in Vancouver, revelations about contract assignment have added to the public outcry for governments and regulators to intervene.
The Real Estate Council of B.C., the self-governing body that oversees real estate agents and brokerage firms, on Monday said it would appoint an independent advisory group to look into dubious practices. That advisory group, to be headed by B.C. Superintendent of Real Estate Carolyn Rogers, is expected to report in 60 days.
B.C.’s Superintendent of Real Estate is part of the Financial Institutions Commission, or FICOM, a provincial agency with a mandate to protect the public.
The RECBC said licensees found to have put their own interests ahead of clients could face investigation and penalties.
But it is not clear whether such disciplinary actions do much to stem a practice that’s been dubbed “shadow flipping.” The council’s disciplinary process is primarily complaint-driven. In some cases, buyers or sellers of a given property may be unaware a property has been “assigned” to another party during the process – or unaware of what that means if and when they are informed – making it unlikely the transaction would result in a complaint.
In a review of RECBC disciplinary cases between 2011 and 2015, The Globe and Mail found only 13 cases that concerned failure to disclose interest in a property or transaction. Penalties in those cases ranged from three 14-day suspensions to a single instance of a licence being surrendered.
One older disciplinary case, from 2008, involved Amarjit Singh Gill, at the time a Realtor with United Realty RCK and Associates. According to the judgment in his case, Mr. Gill was the listing agent for a couple in Langley who wanted to sell their home. He brought the couple an offer for $425,000 through a numbered company – without disclosing that his spouse was the sole director and shareholder of the numbered company.
Mr. Gill then assigned the contract to other buyers, David and Sharon Preston, for $550,000, again without disclosing his interest.
Mr. Gill was suspended for 180 days for professional misconduct and fined $5,000. During that process, it was determined Mr. Gill lied to the council to hide his family’s role in the deal.
David Preston filed the complaint to the RECBC that resulted in the disciplinary action for Mr. Gill and spoke to The Globe and Mail about the case.
“I got screwed,” Mr. Preston said.
“If I had gone directly to the homeowner, I would have paid $425,000 … after I found out it was a numbered company that bought it, we just casually thought, ‘that doesn’t sound right’ – then we saw it was his wife’s name. Mr. Preston calls a $5,000 fine a “slap on the wrist,” noting that Mr. Gill made $125,000 by flipping the property within a couple of months.
Council spokeswoman Marilee Peters defended the group’s regulatory approach, saying it includes audits of brokerage firms as well as complaint-driven investigations.
“We have one of the strongest regulatory frameworks for real estate of any jurisdiction across the country,” Ms. Peters said. “The penalties assessed are consistent with penalties assessed across the country.”
Darcy McLeod, president of the 11,000-member Real Estate Board of Greater Vancouver, said his group has not received complaints about contract assignments and supports moves by the government and the council to look into any misuse of the technique.
“There are many cases where assignment of a contract is perfectly legitimate and being done correctly,” Mr. McLeod said. “Where it becomes interesting, is if a real estate licensee is a party to a transaction, and they are not disclosing that to the general public – then that’s a problem.”
Follow us on Twitter: Kathy Tomlinson @KathyTGlobe, Wendy Stueck @wendy_stueck, Justine Hunter @justine_hunter

Canadian home price divergence likely to continue in 2016
Subscribers Only
The Globe and Mail
Published Sunday, Feb. 07, 2016 5:49PM EST
Last updated Sunday, Feb. 07, 2016 7:19PM EST
Canada’s housing market resembled a roller coaster ride for much of 2015, as prices soared in Vancouver and Toronto and dropped in the oil-sensitive Prairies. Several new indicators this week are set to offer a glimpse into whether the drama will continue in 2016.
Among the bounty of housing statistics due this week: Teranet-National Bank House Price Index will report on the national resale market for January, while Statistics Canada offers up building permits for December, along with its new-home price index for that month. Meanwhile, the country’s largest alternative mortgage lender, Home Capital Group Inc., will reveal its fourth-quarter earnings.
Early signs suggest that 2016 is shaping up to look a lot like last year, including an even more pronounced divergence between the sizzling regions of Vancouver and Toronto and cooling markets in Alberta.
Canada Mortgage and Housing Corp. accidentally released its data on January housing starts a day early on Friday, showing a slowdown in new home construction in all regions except Ontario. In Alberta, housing starts plunged to the lowest level since 2011.
“The precipitous drop in Alberta building activity now appears to be reflecting much weaker demand conditions in the province,” wrote Bank of Montreal economist Robert Kavcic. He expects overall housing starts to remain at levels similar to last year, but “with demand moving briskly away from oil-producing regions.”
The Calgary Real Estate Board said its benchmark home price fell by 3.27 per cent in January from a year earlier, including a 1.21-per-cent drop from December. The condo market bore the brunt of the January freeze, with the benchmark price sliding more than 6 per cent from a year earlier to $281,900.
Overall home resales activity fell 13 per cent from last January and was 43 per cent below the city’s long-term average as homeowners began to lose hope that the market would rebound soon.
Mortgage insurer Genworth MI Canada Inc. is already seeing more Albertans struggling to pay their mortgages and warned of greater housing woes for the province in the year ahead. “I would expect to now start seeing a gradual build in delinquencies out of Alberta given where unemployment is and given the fact that most of the measures that delayed [a housing downturn] last year were really time-bound,” Genworth chief executive officer Stuart Levings told analysts on Friday. “They can only go on for so long.”
Meanwhile in Greater Vancouver, the benchmark price for a detached home skyrocketed an annualized 28 per cent to $1.3-million last month.
Some of the sharpest price growth came from the suburbs. Benchmark resale prices soared an annualized 37 per cent in Burnaby East and now average more than $1-million. The region’s condo market is also feeling the heat, with prices rising an annualized 20 per cent to $456,600.
Vancouver’s market was almost the mirror opposite of Calgary’s in January, with resale activity running 46 per cent above the city’s long-term average, even as the number of available listings fell 38 per cent from a year earlier.
Analysts had expected the eye-popping price growth to spark new home construction in the province. But so far it hasn’t happened. British Columbia housing starts dropped nearly 6 per cent in January from a month earlier. “Depressed construction activity will likely keep home price gains lofty in B.C. yet again in 2016,” Toronto-Dominion Bank economist Diana Petramala wrote.
The B.C. government has come under increasing pressure to address an affordability crisis in the Lower Mainland. Provincial Finance Minister Mike de Jong has said the government’s budget, due Feb. 16, will include relief for home buyers and measures to encourage more new home construction.
In the Greater Toronto Area, the benchmark home price rose an annualized 11.2 per cent last month, driven by strong sales of more expensive detached homes. The average price surged more than 20 per cent in the suburbs around Toronto, while resale activity was up more than 8 per cent from a year earlier. Sharply rising prices prompted Canada Mortgage and Housing Corp. to renew its warnings about the risks facing Toronto’s overheated housing market.
Another strong showing for the housing markets of Toronto and Vancouver last month has done little to silence the housing bears.
Skittish investors have penalized lenders that are more sensitive to the housing market, including those that have relatively little exposure to mortgages in Alberta. The share prices of non-bank mortgage companies, such as Home Capital, Equitable Finance Inc. and MCAN Mortgage Corp., have fallen an average of 20 per cent since a year ago, compared with a 9-per-cent drop in the share price of the major Canadian banks, Industrial Alliance analyst Dylan Steuart noted.
“While general credit performance for domestic lenders has been extremely positive to date, there is a general expectation that 2016 will see an increase in delinquencies and credit provision from historic lows,” he wrote in a research note.
Some analysts predict that January’s housing strength will prove to be an anomaly that was driven by buyers in more expensive cities rushing into the market ahead of increases to minimum down payments on more expensive insured mortgages, which take effect on Feb. 15.
“Even if the impact of pending mortgage rule changes is ultimately going to be small, the mere perception in the market that minimum down payments are going up next month is probably pulling forward some sales,” Bank of Montreal economist Robert Kavcic wrote.
The tougher mortgage rules come at a time when confidence in the economy is waning among heavily indebted consumers as oil prices show no signs of a sustained recovery. Last month, the Conference Board of Canada said its consumer confidence index fell to its lowest level since 2011.
Household debt hit $1.91-trillion in December, up 5.2 per cent from a year earlier. It was the fastest pace of growth since 2011, outstripping growth in household incomes, wrote Royal Bank of Canada economist Laura Cooper. Most of the new debt came from mortgages, which grew by $79-billion last year, or 6.2 per cent from a year earlier.
Few expect consumers to be able to churn out another year of strong borrowing. “Consumer spending and housing activity across the country will add much less to overall growth in an environment of increasing consumer caution that is being reinforced by moderating employment gains, reduced pent-up demand for big-ticket items because of record home and car ownership rates, and rising household debt burdens,” Bank of Nova Scotia economist Aron Gempel wrote.
This week may also bring more clarity to how the Bank of Canada views the increasingly uncertain outlook for the country’s housing market. The central bank’s deputy governor Timothy Lane is scheduled to give a speech Monday in Montreal on the topic of monetary policy and financial stability.
“Clearly an issue that strikes to the heart of domestic financial stability issues and the role of the central bank is the extent to which easy money policy has inflated house prices from coast to coast,” Scotiabank’s Derek Holt wrote. , “while macroprudential rules have been unsuccessful in materially cooling housing markets.”
Follow Tamsin McMahon on Twitter: @tamsinrm
Canadian Labour Updates
Canada’s Unemployment Rate Rises To 7.2% — Largest Gap With U.S. Rate In 14 Years
The Huffington Post Canada | By Daniel Tencer
Posted: 02/05/2016 8:40 am EST Updated: 02/05/2016 11:59 am EST

Business people standing in interview queue | Gary Waters via Getty Images
- Alberta rate above national average for first time in 28 years
- Canada’s rate 2.3 points higher than U.S. — biggest gap in 14 years
- More trouble ahead as oil crash ‘trickles across broader economy’Canada’s unemployment rate rose in January as the country lost 5,700 jobs, Statistics Canada reports.
The country’s job growth over the past year is now well below the rate needed to keep up with population growth. The country has added 0.7 per cent net new jobs over the past year, below the 0.9 to 1 per cent needed to keep up with the population.
In that time, the jobless rate has jumped from 6.6 per cent to 7.2 per cent in the latest labour force survey.

Canada’s unemployment rate has been creeping upwards for a year. (Chart: StatsCan)
Alberta, Manitoba and Newfoundland all lost jobs, with Alberta shedding 10,000 positions. Employment in the province is down by 35,000, or 1.5 per cent, over the past year, but the province has shed a whopping 100,000 private-sector jobs. Government hiring has offset some of those losses.
Ontario was the one province that saw job growth, StatsCan said. The province added a strong 20,000 jobs in January, and the number of jobs is up a solid 1.5 per cent over the past year. The province’s unemployment rate stayed steady at 6.7 per cent, as more people entered the workforce.
Bank of Montreal chief economist Doug Porter noted that Canada’s unemployment rate hasn’t been this much higher than the U.S.’s in 14 years. The U.S. Bureau of Labor Statistics reported Friday that the country’s unemployment rate stands at 4.9 per cent. The 2.3 percentage point gap in jobless rates between Canada and the U.S. is the highest since 2002, Porter wrote.
Porter noted another dubious milestone in today’s data: Alberta’s unemployment rate is now higher than the national average, for the first time in 28 years. It ticked up to 7.4 per cent, marking the first time the province’s jobless rate is higher than the national rate since 1988.
CIBC chief economist Avery Shenfeld says this isn’t the end of rising unemployment in Canada. There’s “likely more to come on that front as [the] impact of a resource price slump trickles across the broader economy,” he wrote in a client note.

The poor jobs report is “hardly a surprise given that [the fourth quarter of 2015] showed virtually no GDP growth,” Shenfeld added.
Agriculture led the way on job losses, with 13,700 jobs lost in a month. Employment in the sector is down 6.2 per cent in a year. Construction is also struggling, shedding 5,400 jobs last month. Construction employment is down 1.8 pe cent in a year.
Though manufacturing lost 11,000 jobs last month, it’s still up by 17,000 over the past year, an increase of one per cent.

Year-over-year growth in average weekly earnings by province, December 2015

Source(s):
CANSIM table 281-0049.
Some of the changes in employment and participation reflects laid off Alberta oil and gas workers resturning to their province of origin or transferring to BC and Saskatchewan ahead of the ugly tax hikes coming in Alberta.
Canada: Steady trend in housing starts
The trend measure of housing starts in Canada was 198,880 units in February compared to 199,107 in January, according to Canada Mortgage and Housing Corporation (CMHC). The trend is a six-month moving average of the monthly seasonally adjusted annual rates (SAAR) of housing starts.
“The national housing starts trend held steady in February, despite some important regional variances,” said Bob Dugan, CMHC Chief Economist. “Housing starts are trending at a 4-year low in the Prairies where low oil prices have weakened consumer confidence. At the same time, starts are trending at an 8-year high in British Columbia, as new and resale home inventories remain low”.
The standalone monthly SAAR was 212,594 units in February, up from 165,071 units in January. The SAAR of urban starts increased by 30.9 per cent in February to 200,231 units. Multiple urban starts increased by 46.0 per cent to 138,774 units in February and the single-detached urban starts increased by 6.1 per cent to 61,457 units.
In February, the seasonally adjusted annual rate of urban starts increased in British Columbia, Ontario, Québec, Atlantic Canada and decreased in the Prairies.
Rural starts were estimated at a seasonally adjusted annual rate of 12,363 units.
United States Housing News

Fordaq CHMC Jan 18 16

U.S. rental home price growth slowed in December
Josh Boak
WASHINGTON — The Associated Press
Published Friday, Jan. 22, 2016 8:11AM EST
Last updated Friday, Jan. 22, 2016 8:13AM EST

Home rental price growth turned tame in December – a sign that a burst of new apartment construction last year may be relieving cost pressures.
Real estate data firm Zillow said Friday that median rent rose a seasonally adjusted 3.3 per cent from a year ago. The median rent nationwide has held steady at $1,381 a month since August, after having previously surged dramatically above the pace of wage growth.
In several major markets, median rents barely budged over the past year. Rents edged up just 0.4 per cent in Chicago, 1.8 per cent in Philadelphia, and 1.6 in St. Louis. Even hot markets such as Denver, Portland and San Jose have retreated from annual gains that just two months ago were in the double digits.
New construction has helped temper price growth in many of these markets. The government reported Wednesday that the completion of multifamily housing – which includes apartments – surged 20.6 per cent last year to 308,300 buildings.
“Builders and landlords have been saying they need to give up a bunch more concessions now because more units are available,” said Svenja Gudell chief economist at Zillow, adding that apartment buildings in Denver and Washington are even offering free parking spaces to entice potential renters.
Rents had been appreciating at double the pace of incomes for much of 2015. But they’re now starting to pull closer together. Average hourly earnings have risen 2.5 per cent from a year ago to $25.24, the Labor Department said earlier this month.
In some cases, areas with less job growth have seen lower rental price increases. Annual job gains have averaged almost 2 per cent nationally. But that rate was just 1.1 per cent in Chicago, 1 per cent in St. Louis and 1.1 per cent in Philadelphia – all areas with lower rental price growth.
Zillow forecasts that rents will rise just 1.1 per cent in 2016 to $1,396 a month, a major deceleration from recent years.
Housing affordability has emerged as a growing economic concern. More than half of all renters spent at least 30 per cent of their income on rent in 2014, a level the federal government deems financially burdensome. The risk of rising rents is that they may limit down payment savings and delay home ownership.
U.S. housing starts drop 3.8% in January
February 22, 2016
Source:
US Census/Fordaq
U.S. housing starts dropped by 3.8% in January to a seasonally adjusted annual rate of 1.099 million units, the U.S. Commerce Department announced last week. Heavy snowfalls in January may account for much of the decline.
Single-family housing starts in January were at a rate of 731,000, a 3.9% decline for the month. The January rate for units in buildings with five units or more was 354,000. Meanwhile, privately owned housing completions in January rose 2% to a rate of 1.057 million. Single-family housing completions in January were at a rate of 693,000, down 1.4%.
The Commerce Department also said building permits, an indicator of future housing demand, edged down 0.2 percent to an annual rate of 1.202 million in January from 1.204 million in December.
U.S. housing data adds to signs of weak first-quarter GDP growth
WASHINGTON U.S. housing starts fell more than expected in March and permits for future home construction hit a one-year low, suggesting some cooling in the housing market in line with signs of a sharp slowdown in economic growth in the first quarter.
Tuesday’s report from the Commerce Department continued the recent run of weak data that has cast a pall on the economy’s prospects. Economists say the fragile economy, combined with tepid inflation vindicated the Federal Reserve’s cautious approach to raising interest rates.
“It’s not just American consumers stepping back a bit this year, homebuilders also lost steam,” said Sal Guatieri, a senior economist at BMO Capital Markets in Toronto. “This means the two key drivers of the expansion have lost their pep, which explains why the Fed will probably lift rates, at most, a couple of times in 2016.”
Groundbreaking decreased 8.8 percent to a seasonally adjusted annual pace of 1.09 million units, the lowest level since October, the Commerce Department said. Economists polled by Reuters had forecast housing starts slipping to a 1.17 million-unit pace last month.
Last month’s drop in starts pointed to a moderation in housing market activity and mirrors other reports on business spending, industrial production, trade, inventory investment and retail sales that have suggested economic growth stalled in the first quarter.
The economy has been slammed by a strong dollar and weak global demand, which have weighed on exports. Lower oil prices are also a drag as they have undercut profits of energy firms, prompting them to sharply curtail spending on capital projects.
First-quarter gross domestic product growth estimates are currently as low as a 0.2 percent annualized rate. The economy grew at a 1.4 percent rate in the fourth quarter.
The PHLX housing index .HGX was down slightly, underperforming a broadly higher stock market that was buoyed by rising oil prices. Shares in the nation’s largest homebuilder D.R. Horton Inc (DHI.N) were down 0.95 percent andLennar Corp (LEN.N) slipped 0.84 percent.
The dollar fell against a basket of currencies and prices for U.S. government debt were weak.
STRONG FUNDAMENTALS
The Fed’s policy-setting committee meets on April 26-27. Market-based measures of expectations for Fed policy have priced out an interest rate hike in the first half of the year, according to CME Group’s FedWatch.
The Fed lifted its benchmark overnight interest rate in December for the first time in nearly a decade and policymakers recently forecast only two more rate hikes this year.
Despite the slump in groundbreaking activity last month, housing market fundamentals remain strong against the backdrop of a buoyant labor market, which is increasing employment opportunities for young adults, and in turn boosting household formation.
Single-family starts, the largest segment of the market, tumbled 9.2 percent to a 764,000-unit pace in March, the lowest since October, after touching a more than eight-year high in February. They fell in all four regions last month, sliding 4.9 percent in the South, where most home building takes place.
Groundbreaking on multi-family housing projects declined 7.9 percent to a 325,000-unit pace. Starts for buildings with five units and more fell to their lowest level in a year.
“There is still a lot of supply being built, but industry reports finding rental vacancy rates coming off the lows and rent gains slowing appear to be leading builders to pull back,” said Ted Wieseman, an economist at Morgan Stanley in New York.
Building permits dropped 7.7 percent to a 1.09 million-unit rate last month, the lowest level since March last year.
Permits for the construction of single-family homes decreased 1.2 percent in March after scaling a more than eight-year high in February. Multi-family building permits plunged 18.6 percent, with approvals for buildings with five units or more falling to their lowest level since August 2013.
(Reporting by Lucia Mutikani; Editing by Andrea Ricci)

U.S. jobs market signals loss of momentum; productivity plunges
Lucia Mutikani
WASHINGTON — Reuters
Published Thursday, Feb. 04, 2016 8:35AM EST
Last updated Thursday, Feb. 04, 2016 10:39AM EST
The number of Americans filing for unemployment benefits rose more than expected last week, suggesting some loss of momentum in the labour market amid a sharp economic slowdown and stock market selloff.
Signs of creeping employment weakness were also flagged by another report on Thursday showing a 218 per cent jump in announced job cuts by U.S.-based employers in January. The planned layoffs were concentrated in the energy and retail sectors.
“The future is somewhat darker … the labour market may be past its peak for this cycle. It looks like the labor market has scaled back its rapid advance last month,” said Chris Rupkey, chief economist at MUFG Union Bank in New York.
Initial claims for state unemployment benefits increased 8,000 to a seasonally adjusted 285,000 for the week ended Jan. 30, the Labor Department said.
Still, claims remained below 300,000, a level associated with strong labour market conditions, for the 48th straight week. That is the longest run since the early 1970s.
The four-week moving average of claims, considered a better measure of labour market trends as it irons out week-to-week volatility, rose 2,000 to 284,750 last week. Economists had forecast claims rising to 280,000 in the latest week.
The rise in layoffs came amid a slowdown in economic growth. The economy grew at only a 0.7 per cent annual pace in the fourth quarter, held back by the headwinds of a strong dollar and faltering global demand.
A downturn in capital spending by energy companies, reeling from a collapse in oil prices, and inventory destocking by businesses are also constraining growth. At the same time, a stock market rout sparked by fears of a global economic slump has caused financial market conditions to tighten.
In a separate report, global outplacement consultancy Challenger, Gray & Christmas said employers reported 75,114 planned job cuts last month, up from December’s 15-year low of 23,622. Last month’s planned layoffs were the largest since July.
Retailers announced plans to eliminate 22,246 jobs from their payrolls, the most since January 2009. The retail cuts were dominated by Walmart, which announced plans to close 269 stores worldwide. The downtrodden energy sector announced plans to reduce its head count by 20,246, up from 1,682 in December.
“It remains unclear how much of the deterioration in the data is related to an unfavorable shift in the weather and an increase in layoffs of temporary workers following the holiday season,” said Daniel Silver, an economist at JPMorgan in New York.
In a third report, the Commerce Department reported that new orders for manufactured goods fell 2.9 per cent in December, the largest drop in a year, after falling 0.7 per cent in November.
The reports came on the heels of weak data on export growth and consumer spending that suggest the Federal Reserve will probably not raise interest rates in March. The U.S. central bank raised its short-term interest rate in December for the first time in nearly a decade.
U.S. stock indexes rose, while prices for Treasuries were mixed. The dollar fell against a basket of currencies, touching a 15-week low against the euro and a two-week low against the yen.
PRODUCTIVITY WEAK
While the claims data has no bearing on January’s employment report, which is scheduled to be released on Friday, as it falls outside the survey period, it fits in with perceptions of a deceleration in the pace of job growth.
According to a Reuters survey of economists, nonfarm payrolls are expected to have increased 190,000 last month after surging by 292,000 in December. The unemployment rate is forecast holding steady at a 7-1/2-year low of 5 per cent.
In another report on Thursday, the Labor Department said nonfarm productivity, which measures hourly output per worker, declined at a 3.0 per cent rate, the biggest drop since the first quarter of 2014, after rising at a 2.1 per cent rate in the third quarter.
The weak productivity data reflected the sharp slowdown in GDP growth during the quarter and an acceleration in the pace of hiring. Nonfarm payrolls rose by an average 284,000 jobs per month.
Productivity grew 0.6 per cent in 2015, the smallest increase since 2013, and has increased at an annual rate of less than 1.0 per cent in each of the last five years. Economists blame softer productivity on a lack of investment, which they say has led to an unprecedented decline in capital intensity.
In the fourth quarter, unit labour costs, the price of labour per single unit of output, advanced at a 4.5 per cent pace, the fastest rate in a year. They rose 2.4 per cent in 2015, the largest gain since 2007.
US Labor Department Report- Employment Situation Summary February 2016
In February, the unemployment rate held at 4.9 percent, and the number of unemployed persons, at 7.8 million, was unchanged. Over the year, the unemployment rate and the number of unemployed persons were down by 0.6 percentage point and 831,000, respectively.
The number of long-term unemployed (those jobless for 27 weeks or more) was essentially unchanged at 2.2 million in February and has shown little movement since June. In February, these individuals accounted for 27.7 percent of the unemployed.
The employment-population ratio edged up to 59.8 percent over the month, and the labor force participation rate edged up to 62.9 percent. Both measures have increased by 0.5 percentage point since September.

The number of persons employed part time for economic reasons (also referred to as involuntary part-time workers) was unchanged in February at 6.0 million and has shown little movement since November. These individuals, who would have preferred full-time employment, were working part time because their hours had been cut back or because they were unable to find a full-time job.
In February, 1.8 million persons were marginally attached to the labor force, down by 356,000 from a year earlier. (The data are not seasonally adjusted.) These individuals were not in the labor force, wanted and were available for work, and had looked for a job sometime in the prior 12 months. They were not counted as unemployed because they had not searched for work in the 4 weeks preceding the survey.
Among the marginally attached, there were 599,000 discouraged workers in February, down by 133,000 from a year earlier. (The data are not seasonally adjusted.) Discouraged workers are persons not currently looking for work because they believe no jobs are available for them. The remaining 1.2 million persons marginally attached to the labor force in February had not searched for work for reasons such as school attendance or family responsibilities.
A map of where U.S. job growth is spiking
Published: Feb 23, 2016 11:01 a.m. ET

The White House recently touted that U.S. businesses have added more jobs than any time since the 1990s, with unemployment dropping to 4.9%. President Barack Obama called the economy “the strongest, most durable” in the world.
So where exactly is all this job growth?
Cost-estimating website HowMuch.net used data from the Bureau of Labor Statistics to create this three-dimensional representation of the number of jobs added by metro area. As you can see, the action is on the coasts, where California led all states with more than 464,000 jobs related.
Conversely, North Dakota, a victim of falling oil prices, saw the biggest decline at -19,000.
The Greater New York metropolitan area, which includes Newark and Jersey City, showed the highest increase for any single metro area in the country with 156,400 new jobs. Meanwhile, the Los Angeles metro area, including Long Beach and Anaheim, was second at 135,100 jobs.
Lafayette, La. and Davenport-Moline-Rock Island, Ill. were the hardest hit.
In terms of growth rate, Idaho Falls, Idaho. was tops in the country at 4.5%. The heart of Silicon Valley posted an increase of 4.4%.
Overall, the number of jobs grew in 280 of the 286 metro areas.
Assuming the US economy continues to recover, and is not sideswiped by global economic disruptions, housing will continue a strong upward trend.


